


 在使用SSAS创建多维数据集或表格模型之前,应确保源数据库遵循最佳的数据建模实践。文章通过Adventure Works DW的简化示例,讨论了如何构建数据仓库,包括选择合适的数据类型、设计事实表和维表,并强调了ETL过程中外键约束的重要性。同时,提出了数据集市的创建策略,以帮助启动新的数据仓库项目。
sql2018 ssas
Before jumping into creating a cube or tabular model in Analysis Service, the database used as source data should be well structured using best practices for data modeling. Some might say use Dimensional Modeling or Inmon’s data warehouse concepts while others say go with the future, Data Vault. No matter what conceptual path is taken, the tables can be well structured with the proper data types, sizes and constraints.
在开始使用Analysis Service创建多维数据集或表格模型之前,应使用数据建模的最佳实践对用作源数据的数据库进行良好的结构化。 有些人可能会说使用Dimensional Modeling或Inmon的数据仓库概念,而另一些人则说会与未来的Data Vault保持一致。 无论采用哪种概念路径,都可以使用适当的数据类型,大小和约束来很好地组织表。
This article is going to use a scaled down example of the Adventure Works Data Warehouse. The full version of the Adventure Works DW can be downloaded from CodePlex.
本文将使用Adventure Works数据仓库的缩小示例。 完整版本的Adventure Works DW可以从CodePlex下载。
Taking on a complete data warehouse project can be overwhelming. The best path from experience is to create the minimum structure that yields a good result. Not the best, but something of value where management will approve and extend other data warehouse projects.
进行一个完整的数据仓库项目可能会很困难。 经验的最佳途径是创造出可以产生良好结果的最小结构。 不是最好的,而是管理部门将批准和扩展其他数据仓库项目的有价值的东西。
The beginning can be a data mart that might answer the following questions:
开始时可能是一个数据集市,可能会回答以下问题:
- Compare Sales of Mountain Bikes for years 2015 and 2016 比较2015年和2016年山地车的销售额
- What happens to profits when you remove the Bike Category? 当您删除“自行车类别”时,利润会怎样?
- Show average sales for subcategories within categories in the USA? 显示美国类别中子类别的平均销售额?
- Calculate Gross Profit Margin for Internet Sales region by Year, Quarter and Month 按年,季度和月计算互联网销售区域的毛利率
From these specific inquiries, we can get an idea of the data required. There will be a Data dimension because of the need for Year, Quarter and Month. The main numerical value is sales, but there is a calculation for Gross Profit Margin. Sales Line Item Cost is required to compute Gross profit, then Gross Profit Margin.
通过这些特定的查询,我们可以了解所需的数据。 由于需要年份,季度和月份,因此会有一个数据维度。 主要数值是销售额,但是有毛利润率的计算。 要计算毛利润,然后计算毛利润率,需要销售订单项成本。
There is reference to a Category value of Bike and slicing into Subcategories. Products for Sales Line Items will be relate to Subcategory and Category. Average Sales will be another calculation and is sliced by Country.
引用了“自行车”的“类别”值并划分为“子类别”。 销售行项目的产品将与子类别和类别相关。 平均销售额将是另一项计算,并按国家/地区划分。
The Country is not specific, so the question where is the Country located, from Customers or from Sales Territories. The Reseller Sales does not have a different customer for this company but Internet Sales does. So, Sales Territory and Geography will get the country along with Group and Region.
国家/地区不是特定的,因此问题来自客户或销售地区的国家/地区在哪里。 代理商销售没有该公司的其他客户,但互联网销售有。 因此,销售地区和地理区域将与国家和地区一起获得该国家。
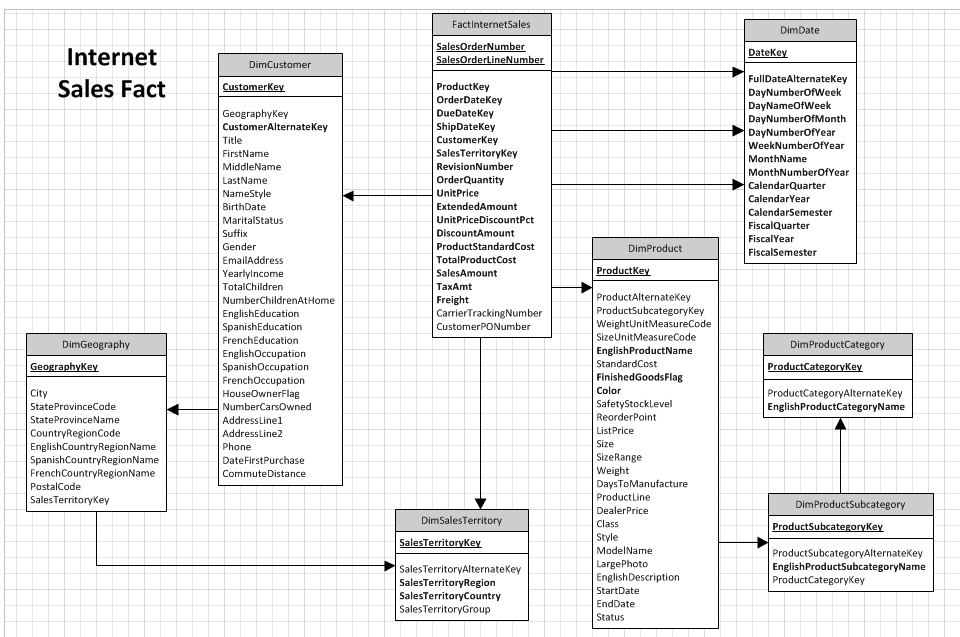
Figure 2 shows a business database diagram of the full Adventure Works DW with just the fact table for Internet Sales.
图2显示了完整的Adventure Works DW的业务数据库图,其中仅包含Internet销售的事实表。
There are a lot of columns that can be very confusing. Figure 3 scales down the model to something simpler.
有很多列可能非常令人困惑。 图3将模型缩小为更简单的模型。
Since all the dimension tables have IDs as a primary key, the use of the integer data type needs to be looked at. There are different uses like bigint, int, smallint and tinyint. You could even use Boolean if there was only 2 possible integer values – 0 or 1. This design uses an int data type for the Date dimension key because it uses values like 20170124, 20170125, etc.
由于所有维表都将ID作为主键,因此需要查看整数数据类型的使用。 有很多不同的用法,例如bigint,int,smallint和tinyint。 如果只有2个可能的整数值(0或1),您甚至可以使用Boolean。此设计对Date维度键使用int数据类型,因为它使用的值如20170124、20170125等。
The Category and Subcategory dimensions can use tinyint because there are less than 255 possible rows. Smallint would work for Customer because there will not be more than 32,000 rows. The int data type will allow 2,000,000+ rows if you use all positive values. You can also use negative values which work well when you have early arriving facts.
类别和子类别维度可以使用tinyint,因为可能的行数少于255。 Smallint将为Customer工作,因为不会超过32,000行。 如果您使用所有正值,则int数据类型将允许2,000,000+行。 您还可以使用负值,这些负值在您早日到达事实时会很好地工作。
The fact table will have these ID columns as foreign keys, and because the fact table grows daily, reducing the size used for these integer type IDs will help keep the table in check as size can be a problem.
事实表会将这些ID列作为外键,并且由于事实表每天都在增长,因此减小用于这些整数类型ID的大小将有助于保持表的检查状态,因为大小可能会成为问题。
CREATE TABLE [dbo].[FactInternetSales](
	[ProductKey] [SMALLINT] NOT NULL,
	[OrderDateKey] [INT] NOT NULL,
	[CustomerKey] [SMALLINT] NOT NULL,
	[SalesOrderNumber] [VARCHAR](20) NOT NULL,
	--[SalesOrderNumber] [NVARCHAR](20) NOT NULL,
	[SalesOrderLineNumber] [TINYINT] NOT NULL,
	[OrderQuantity] [SMALLINT] NOT NULL,
	[UnitPrice] [MONEY] NOT NULL,
	[ExtendedAmount] [MONEY] NOT NULL,
	[DiscountAmount] [MONEY] NOT NULL,
	[SalesAmount] [MONEY] NOT NULL,
	[TaxAmt] [MONEY] NOT NULL,
	[Freight] [MONEY] NOT NULL,
	[TotalProductCost] [MONEY] NOT NULL,
 CONSTRAINT [PK_FactInternetSales_SalesOrderNumber_SalesOrderLineNumber]
    PRIMARY KEY CLUSTERED
  ( [SalesOrderNumber] ASC, [SalesOrderLineNumber] ASC)
Figure 4 show the creation statement for the Internet Sales fact table. The SalesOrderNumber was originally a NVARCHAR, but it is known to only contain numeric text data with maybe some leading zeroes. The case for using NVARCHAR over VARCHAR usually depends on international sales. The system might need to use multiple accounting systems to be combined into one data warehouse. If this is the case, use NVARCHAR.
图4显示了Internet Sales事实表的创建语句。 SalesOrderNumber最初是NVARCHAR,但众所周知它仅包含带有一些前导零的数字文本数据。 在VARCHAR上使用NVARCHAR的情况通常取决于国际销售。 该系统可能需要使用多个会计系统才能合并到一个数据仓库中。 如果是这种情况,请使用NVARCHAR。
The numerical fields are using MONEY data, but SMALLMONEY could be used for some of them. Since they are dollar values, there is no need to use decimal or numeric were the number of decimal places need to be specified.
数字字段使用的是MONEY数据,但是SMALLMONEY可以用于其中的一些。 由于它们是美元值,因此无需使用小数或数字,因为需要指定小数位数。
Once the fact table is created, foreign keys are created to relate to the dimension tables. Figure 5 shows the foreign create statements for the Internet Sales fact table.
创建事实表后,将创建与维表相关的外键。 图5显示了Internet Sales事实表的外部create语句。
ALTER TABLE [dbo].[FactInternetSales]  WITH CHECK
    ADD  CONSTRAINT [FK_FactInternetSales_DimCustomer]
	FOREIGN KEY([CustomerKey])
    REFERENCES [dbo].[DimCustomer] ([CustomerKey])
GO
ALTER TABLE [dbo].[FactInternetSales]
	CHECK CONSTRAINT [FK_FactInternetSales_DimCustomer]
GO

ALTER TABLE [dbo].[FactInternetSales]  WITH CHECK
    ADD  CONSTRAINT [FK_FactInternetSales_DimDate]
    FOREIGN KEY([OrderDateKey])
    REFERENCES [dbo].[DimDate] ([DateSKey])
GO
ALTER TABLE [dbo].[FactInternetSales]
    CHECK CONSTRAINT [FK_FactInternetSales_DimDate]
GO

ALTER TABLE [dbo].[FactInternetSales]  WITH CHECK
    ADD  CONSTRAINT [FK_FactInternetSales_DimProduct]
    FOREIGN KEY([ProductKey])
    REFERENCES [dbo].[DimProduct] ([ProductSKey])
GO
ALTER TABLE [dbo].[FactInternetSales]
    CHECK CONSTRAINT [FK_FactInternetSales_DimProduct]
GO
Some might say that the ETL should enforce foreign key constraints. If that is the case, then there will be no problem adding the foreign keys to the database.
有人可能会说ETL应该强制执行外键约束。 如果是这种情况,那么将外键添加到数据库中就不会有问题。
There are cases of early arriving facts. This indicates that the fact arrives before the dimension value when merging data from separate systems. The ETL for the fact table population will need to have intelligence to add the missing dimension first, then use the ID for the fact row, and later update the new temporary dimension row with the late arriving dimension data.
有一些提早到达的事实。 这表明合并单独系统中的数据时,事实早于维度值到达。 事实表填充的ETL将需要具有智能,以便首先添加缺少的维度,然后使用事实行的ID,然后使用迟到的维度数据更新新的临时维度行。
The scaling down of the first data mart will make creating a new model must easier to get a start on a new data warehouse project. The thought to include more floods the mind. Try to put those ideas in a reminder for the second interaction of the project. Remember to check the data types and not be afraid with a more challenging path.
第一个数据集市的缩减将使创建新模型必须更容易,从而可以开始新的数据仓库项目。 包含更多内容的想法充斥了头脑。 尝试将这些想法提醒给项目的第二次交互。 记住要检查数据类型,不要害怕更具挑战性的路径。
注意 (Note)
The Relationship between Product, Subcategory and Category can be folded into the Product table in this example. That would mean the Subcategory Name and Category Name would become columns in the Product table. In his case, that is ok and some would say it removes the snowflake in the schema so the model becomes a star schema.
在此示例中,产品,子类别和类别之间的关系可以折叠到“产品”表中。 这意味着子类别名称和类别名称将成为“产品”表中的列。 在他的情况下,这还可以,有人会说它消除了模式中的雪花,因此模型变成了星型模式。
But, in other cases, like Sales Territory, there is a different table between the territories and the fact table. The Reseller Sales needs to go through Reseller dimension while the Internet Sales needs to go through the Customer dimension. Both use the Geography dimension to get the country with links to the Sales Territory dimension.
但是,在其他情况下,例如“销售地区”,地区和事实表之间会有一个不同的表。 转销商销售需要通过“转销商”维度,而“ Internet销售”则需要通过“客户”维度。 两者都使用“地理位置”维度来获得具有“销售地区”维度的链接的国家/地区。
Next articles in this series:
本系列的下一篇文章:
- Connecting to Data Source(s) with SQL Server Analysis Services使用SQL Server Analysis Services连接到数据源
- Initial Attributes and Measures in SSAS Multidimensional CubesSSAS多维立方体中的初始属性和度量
- Analysis Services (SSAS) Cubes – Dimension Attributes and HierarchiesAnalysis Services(SSAS)多维数据集–维度属性和层次结构
有用的链接 ( Useful links )
- Data Types (Transact-SQL) 数据类型(Transact-SQL)
- Data warehouse 数据仓库
- Data Warehouse vs Data Mart 数据仓库与数据集市
翻译自: https://www.sqlshack.com/sql-server-data-warehouse-design-best-practice-for-analysis-services-ssas/
sql2018 ssas


 307
307

 被折叠的 条评论
为什么被折叠?
被折叠的 条评论
为什么被折叠?
 到【灌水乐园】发言


