


介绍 (Introduction)
In the article Web URL configuration in a Power BI Desktop report, we explored a different method to use Web URL in a Power BI report. Images help to improve the visual appearance of a report. You can convey messages easily using these images in a report.
在Power BI Desktop报表中的Web URL配置一文中 ,我们探讨了在Power BI报表中使用Web URL的另一种方法。 图像有助于改善报表的视觉外观。 您可以在报告中使用这些图像轻松传达消息。
We might use images for different purposes in a report such as the following:
我们可能在报告中将图像用于不同目的,例如:
- We are adding a company or brand logo in a report 我们正在报告中添加公司或品牌徽标
- Suppose you hold a dataset that contains URLs of the products. How can we display them in a Power BI report? 假设您拥有一个包含产品URL的数据集。 我们如何在Power BI报表中显示它们?
- Suppose you import data from a SQL database, and it contains the binary representation of an image. Can we use that data and display an actual image in a report? 假设您从SQL数据库导入数据,其中包含图像的二进制表示形式。 我们可以使用这些数据并在报告中显示实际图像吗?
Let’s open the Power BI Desktop app and dig into it for a beautiful visual.
让我们打开Power BI Desktop应用程序并对其进行深入挖掘,以获得美丽的视觉效果。
I use March release version 2.79.5768.721 in this article. You should use the latest Power BI Desktop version to use all the latest features.
我在本文中使用3月发行版2.79.5768.721。 您应该使用最新的Power BI Desktop版本来使用所有最新功能。
You can download the latest version from the link.
您可以从链接下载最新版本。
添加静态图像以在报告中展示公司品牌 (Adding a static image to showcase company branding in the report)
Suppose you designed a report and want to display a company logo on the top of the page. It gives a nice visual improvement to showcase the brand logo in the reports.
假设您设计了一个报告,并且想在页面顶部显示公司徽标。 它提供了很好的视觉效果,可以在报告中展示品牌徽标。
To add a static image, Navigate to Insert-> Image from the menu bar.
要添加静态图像,请从菜单栏中导航至“ 插入”->“图像 ”。
Browse to the directory and select the image file. It supports various image formats such as JPEG, PNG.
浏览到目录并选择图像文件。 它支持各种图像格式,例如JPEG,PNG。
It imports the image, as shown below.
它将导入图像,如下所示。
You can adjust the size and location of it as per your requirement. We can do the formatting of this image as well.
您可以根据需要调整其大小和位置。 我们也可以对此图像进行格式化。
Border: By default, it does not use any border for the image. We can go in the format area, enable the border, set the border color.
边框:默认情况下,它不对图像使用任何边框。 我们可以进入格式区域,启用边框,设置边框颜色。
We can see an image border in the following image.
我们可以在下图中看到图像边框。
Image title: Sometimes, we want to use image title as well. Specify a title text, font color, background color, alignment and text color for it.
图片标题:有时候,我们也想使用图片标题。 指定标题文本,字体颜色,背景颜色,对齐方式和文本颜色。
There are few other formatting options as well that you can easily
还有一些其他格式化选项,您可以轻松地进行
Power BI Desktop中的图像URL配置 (Image URL configuration in Power BI Desktop)
We can store the images URL in a data table, and that can view as an image in the report. We can import data from various sources, as shown in the earlier articles on SQLShack. We also get an option to enter data manually in a data table.
我们可以将图像URL存储在数据表中,并且可以在报告中以图像的形式查看。 我们可以从各种来源导入数据,如前面有关SQLShack的文章中所示。 我们还提供了在数据表中手动输入数据的选项。
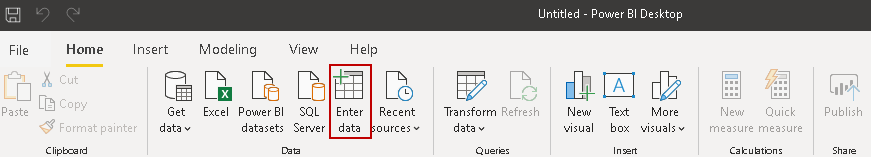
Click on Enter Data in the menu bar as shown below
单击菜单栏中的输入数据,如下所示
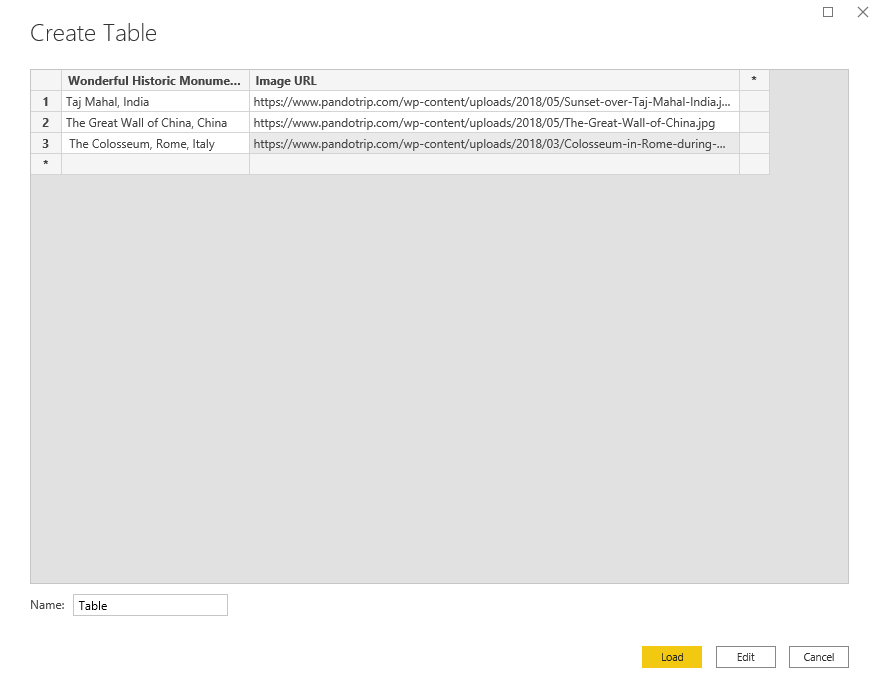
It opens a create table wizard. Currently, it shows a single blank column.
它打开一个创建表向导。 当前,它只显示一个空白列。
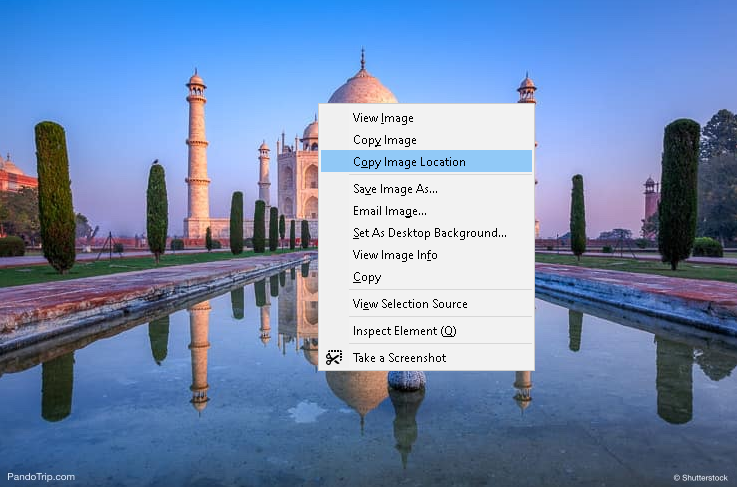
To fill this table, we will use the images in the URL. Open this URL and right-click on an image, it shows you a list of image option. Click on the Copy Image Location, and it copies the image URL in the clipboard.
要填充此表,我们将使用URL中的图像。 打开此URL,然后右键单击图像,它将显示图像列表选项。 单击复制图像位置,它会将图像URL复制到剪贴板中。
Copy this image URL in a new column of a data table. In the following screenshot, we see three image URLs along with the image title. We also specified column names for the data table.
将此图像URL复制到数据表的新列中。 在以下屏幕截图中,我们看到了三个图像URL和图像标题。 我们还为数据表指定了列名。
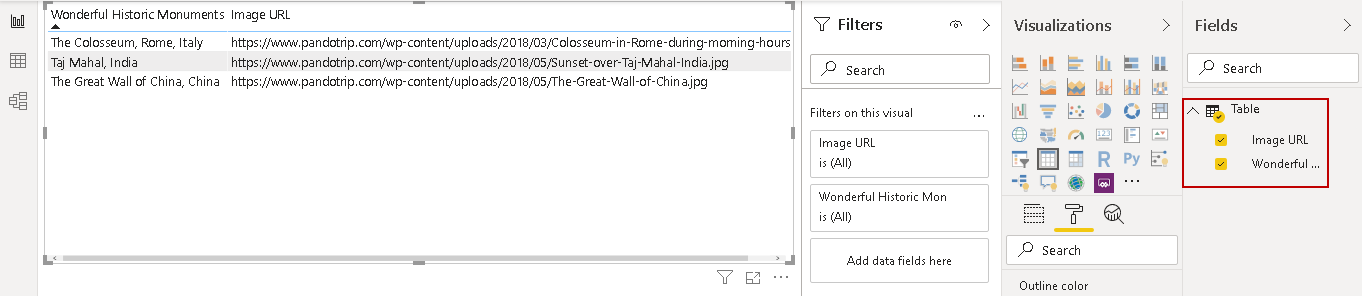
Click on Load, and it shows the columns in the data field section. Put a check on both columns, and it shows you both column data in the Power BI report.
单击加载,它会在数据字段部分中显示列。 选中两个列,它会在Power BI报表中向您显示两个列数据。
We do not require a URL; instead, it should show actual images referencing by the URL. Click on the column that contains the Image URL, and it opens the columns tools.
我们不需要网址; 相反,它应该显示通过URL引用的实际图像。 单击包含“图像URL”的列,它将打开列工具。
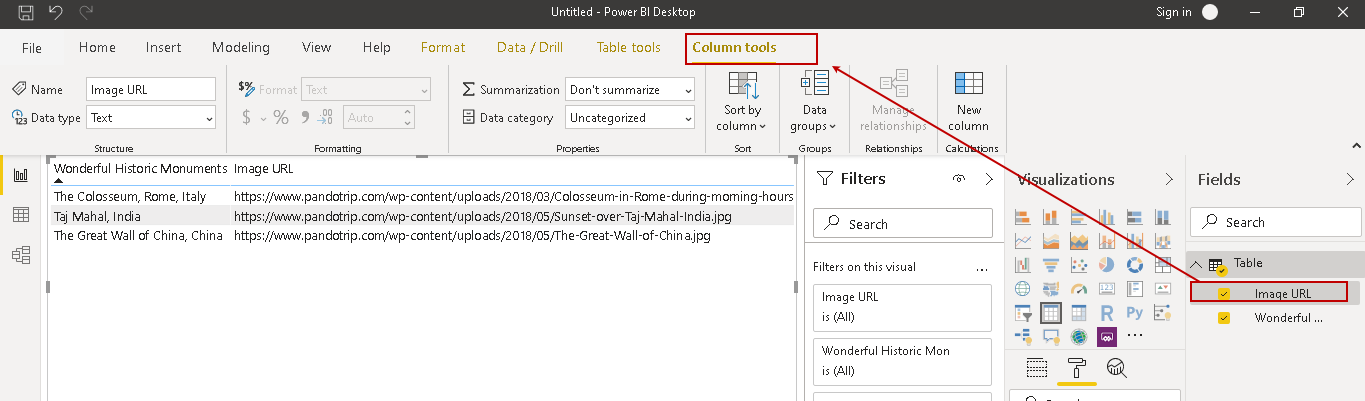
By default, it does not categorize the columns. Click on the Data Category, and it gives you a variety of categories such as Address, Place, Continent, Image URL, Web URL, and Barcode.
默认情况下,它不对列进行分类。 单击数据类别,它会为您提供各种类别,例如地址,位置,大陆,图像URL,Web URL和条形码。
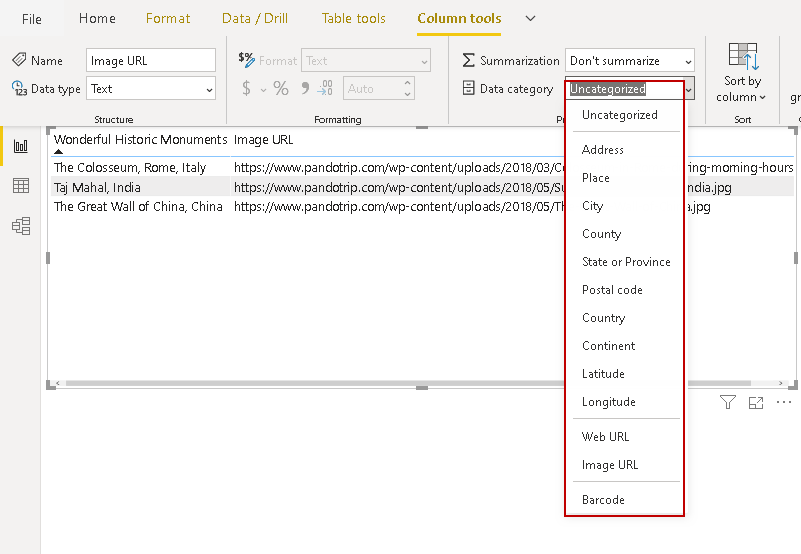
Select Image URL for the column that contains the URL of the images. Once you change the data category, it shows you the images instead of the URLs.
为包含图像URL的列选择“图像URL”。 更改数据类别后,它将显示图像而不是URL。
将图像文件从SQL Server数据库(SQL FILESTREAM)加载到Power BI Desktop (Load Image file from SQL Server database (SQL FILESTREAM) into Power BI Desktop)
We can store images in database tables using the SQL FILESTREAM feature. It stores the metadata into SQL Server tables and images stored in the local disk. You can go through a series of articles on FILESTREAM on SQLShack. In the below image, we can refer to the SQL FILESTREAM feature of SQL Server.
我们可以使用SQL FILESTREAM功能将图像存储在数据库表中。 它将元数据存储到SQL Server表中,并将图像存储在本地磁盘中。 您可以阅读有关SQLShack上FILESTREAM的一系列文章。 在下图中,我们可以引用SQL ServerSQL FILESTREAM功能。
Let me specify steps for FILESTREAM in a brief way here. You can refer to articles FILESTREAM in SQL Server and Managing data with SQL Server FILESTREAM tables for the below steps.
让我在这里简短地指定FILESTREAM的步骤。 您可以参考文章在SQL Server FILESTREAM和管理数据与SQL Server FILESTREAM表的下面的步骤。
- Enable FILESTREAM feature from the SQL Server configuration manager 从SQL Server配置管理器启用FILESTREAM功能
- FILESTREAM access level usingFILESTREAM访问级别 the sp_configure command sp_configure命令
- Create a SQL database with a FILESTREAM filegroup 使用FILESTREAM文件组创建一个SQL数据库
- Create a table in a SQL Server FILESTREAM database 在SQL Server FILESTREAM数据库中创建表
- Insert FILESTREAM data into this table 将FILESTREAM数据插入此表
Once we have a SQL table, run a select statement to check its content.
有了SQL表后,运行select语句检查其内容。
SELECT [FileId],
       [FileName] AS [Image Name],
       [File]
FROM [FileStreamDemoDB].[dbo].[DemoFileStreamTable];
We want to import this Power BI Desktop report.
我们要导入此Power BI Desktop报告。
Select SQL Server data source to import data from a database table.
选择SQL Server数据源以从数据库表导入数据。
It opens a connection window for the SQL Server database. Here specify the following details.
它为SQL Server数据库打开一个连接窗口。 在此指定以下详细信息。
- Specify SQL Server instance details 指定SQL Server实例详细信息
- Database name in which FILESTREAM table exists FILESTREAM表所在的数据库名称
- Select data connectivity mode – Import. We cannot use DirectQuery for the FILESTREAM database because it holds VARBINARY(MAX) column data type 选择数据连接模式-导入。 我们无法将DirectQuery用于FILESTREAM数据库,因为它包含VARBINARY(MAX)列数据类型
- Specify the SQL statement to retrieve FILESTREAM records 指定SQL语句以检索FILESTREAM记录
Click Ok and view data in the preview window.
单击确定,然后在预览窗口中查看数据。
Before we import data, we need an essential transformation for the FILESTREAM image column. In the highlighted column, it shows Binary data. Its data type is also Binary in Power BI.
在导入数据之前,我们需要对FILESTREAM图像列进行必要的转换。 在突出显示的列中,它显示二进制数据。 在Power BI中,其数据类型也是Binary。
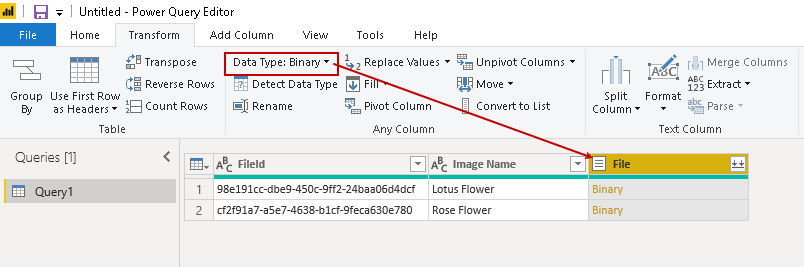
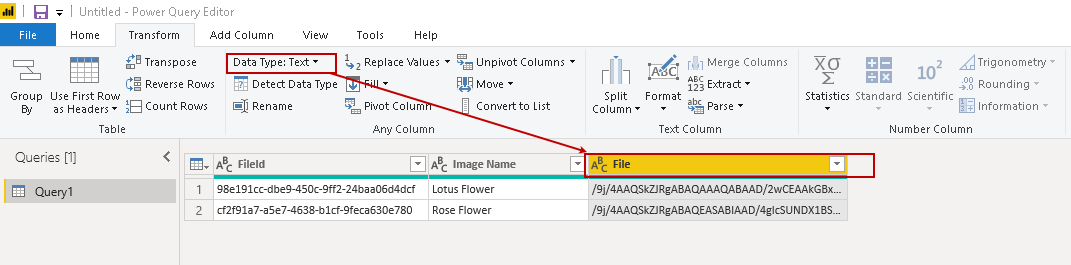
Change the data type for the [File] column to text. Once we change a data type, it shows values in the column, as shown below.
将[文件]列的数据类型更改为文本。 更改数据类型后,它会在列中显示值,如下所示。
We need to add a column for our report. Click on Add Column-> Custom Column from the menu bar.
我们需要为报告添加一列。 从菜单栏中单击添加列->自定义列 。
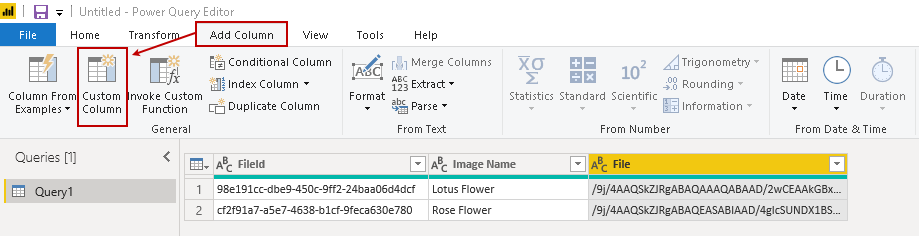
It opens a custom column window.
它打开一个自定义列窗口。
Enter a new column name and specify a formula in the custom column formula section.
输入新的列名称,然后在“自定义列公式”部分中指定一个公式。
“data:image/<image_format>;base64,”&[<Image_binary_column_name>]
“数据:图像/ <图像格式>; base64”和[<图像二进制列名称>]
Once you specify a formula for the custom column, it checks for the syntax as well. In case of any error, it highlights the error message.
为自定义列指定公式后,它也会检查语法。 如果发生任何错误,它将突出显示错误消息。
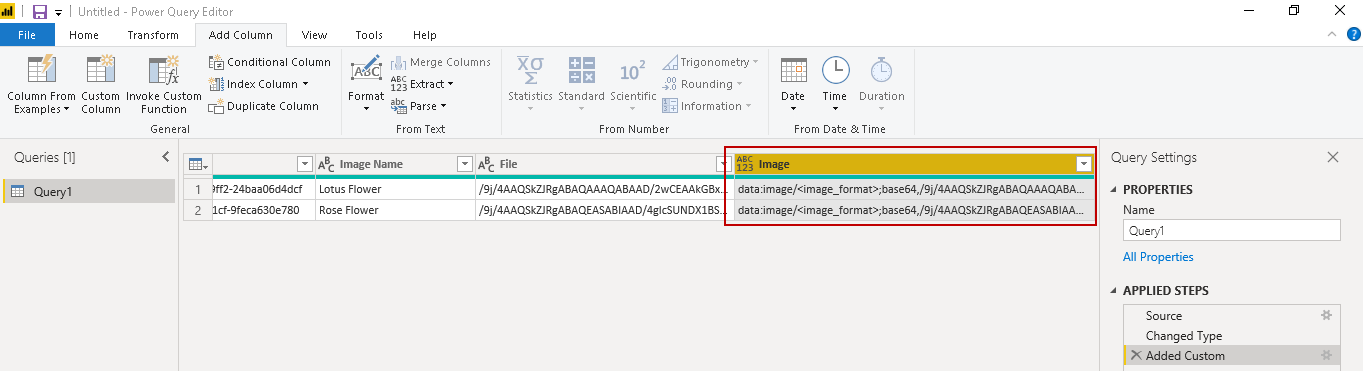
Here, we specify the new column name Image derived from the custom formula.
在这里,我们指定从自定义公式派生的新列名Image 。
Click Ok, and you see additional column Image and its content.
单击确定,您会看到其他列图像及其内容。
Click on Home > Close & Apply to save the changes.
单击主页>关闭并应用以保存更改。
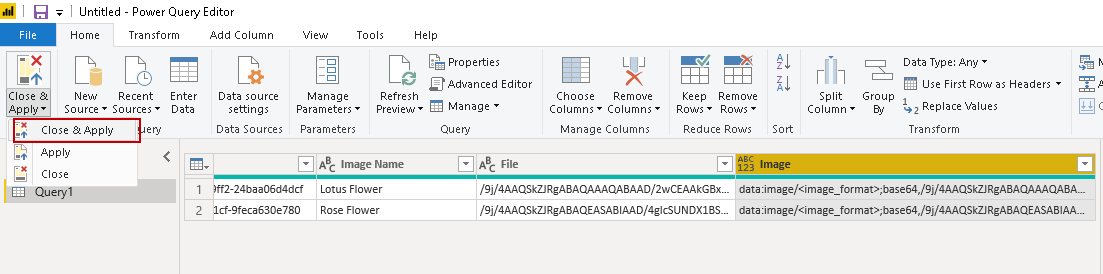
It loads this data into Power BI, and you can see a new column as well in the fields section.
它将数据加载到Power BI中,您也可以在字段部分中看到一个新列。
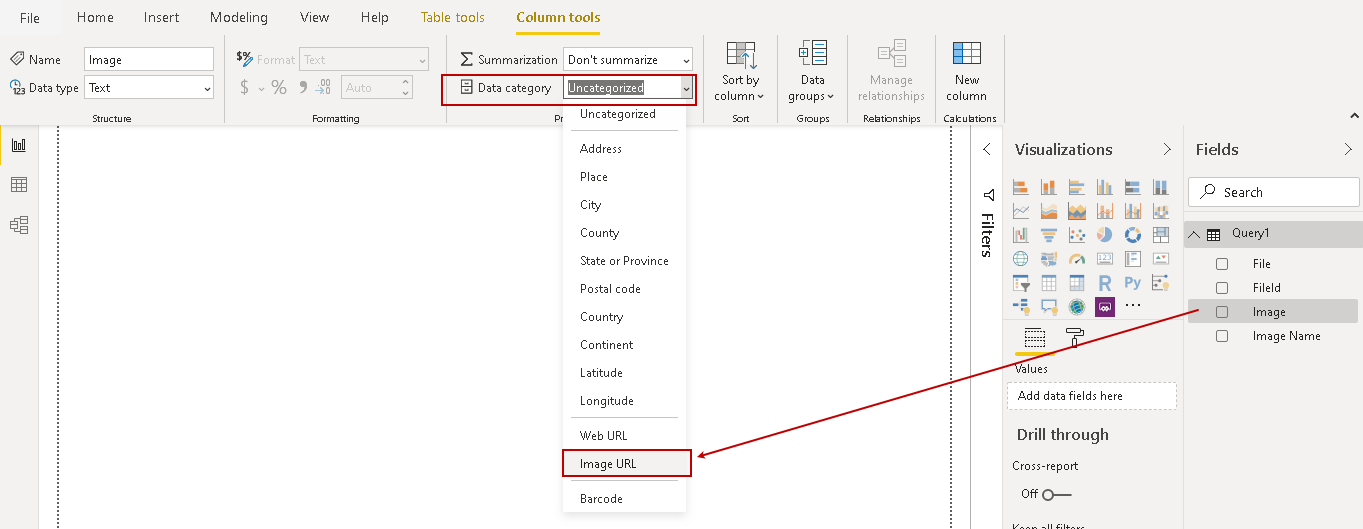
Select this column and change the data category to Image URL from a drop-down list. Once we change it to Image URL, Power BI recognizes it as an image rather than a URL.
选择此列,然后从下拉列表中将数据类别更改为“ 图像URL” 。 一旦将其更改为“图像URL”,Power BI会将其识别为图像而不是URL。
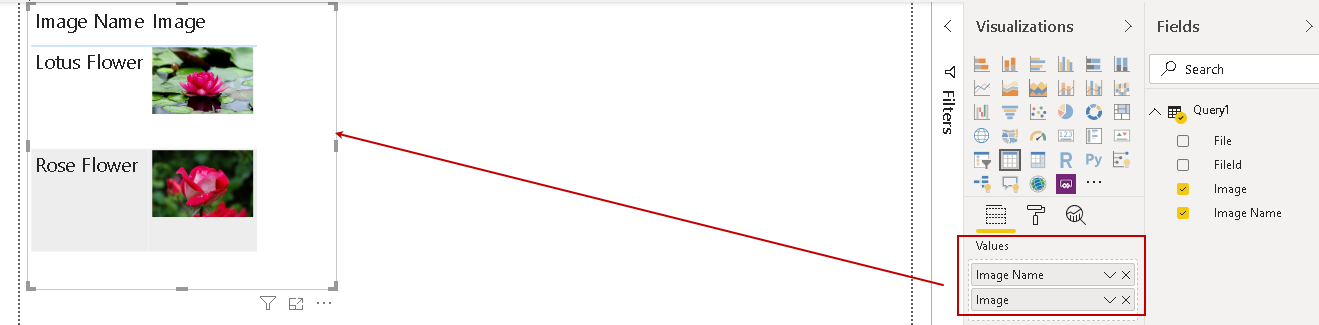
Now, drag a table visual from the visualization and add the columns from the field section, as shown below. It shows the actual image in the report instead of the URL or binary content of an image.
现在,从可视化对象中拖动一个表格视觉对象,并从字段部分添加列,如下所示。 它在报告中显示实际图像,而不是图像的URL或二进制内容。
Note: Power BI allows a maximum string length of 32,766 characters in a column. In the case of a large image, if the string contains more than 32,766 characters, it truncates the rest of the characters. You might get an inconsistent image due to this. You should always consider this limitation before using the image binary in the report.
注意:Power BI允许一列中的最大字符串长度为32,766个字符。 在大图像的情况下,如果字符串包含32,766个以上的字符,则它将截断其余字符。 因此,您可能会得到不一致的图像。 在报表中使用图像二进制文件之前,应始终考虑此限制。
结论 (Conclusion)
In this article, we explored multiple ways to use images in a Power BI Desktop report. We can convey messages using images to a broad audience in an effective manner. You can follow this article and use images to make your report beautiful and informative.
在本文中,我们探讨了在Power BI Desktop报告中使用图像的多种方法。 我们可以使用图像将信息有效地传达给广大受众。 您可以阅读本文,并使用图像使您的报告精美而翔实。
翻译自: https://www.sqlshack.com/working-with-images-in-power-bi-desktop-reports/


 1万+
1万+

 被折叠的 条评论
为什么被折叠?
被折叠的 条评论
为什么被折叠?
 到【灌水乐园】发言


