


介绍 (Introduction)
The Query Store is a new feature in SQL Server 2016 that will greatly improve the process of performance tuning! The biggest limit of the query plan cache and the dynamic management views that relates to it is that it is very temporary. Queries are only accessible for as long as they are in cache, and as a result there is no way to travel back in time to determine what happened at 9am yesterday, or why performance worsened over a week-long period.
查询存储是SQL Server 2016中的一项新功能,它将大大改善性能调整的过程! 查询计划缓存和与之相关的动态管理视图的最大限制是它是非常临时的。 查询只能在缓存中访问,因此无法及时返回以确定昨天上午9点发生了什么,或者为什么性能在一周内变差了。
The purpose of this article is to walk through a variety of hands-on examples of the query store, illustrating how the data can be accessed and used to monitor database performance. Once we have a framework in place for monitoring, we can extend our work towards identifying and tuning misbehaving queries. We’ll skip coverage of configuring the query store as that has been handled quite a bit in other blog posts, and by Microsoft. If you’re looking to get started with enabling and configuring the Query Store, check out this article by Brian Bønk Rueløkke:
本文的目的是逐步介绍查询存储的各种动手示例,说明如何访问数据以及如何使用这些数据来监视数据库性能。 一旦有了用于监视的框架,我们就可以将工作扩展到识别和调整行为异常的查询。 我们将跳过配置查询存储的内容,因为其他博客文章和Microsoft已经对此进行了很多处理。 如果您希望开始启用和配置查询存储,请查看BrianBønkRueløkke的这篇文章:
Query Store – the next generation tool for every DBA
You can verify the configuration of the Query Store on a given database by checking a new view:
您可以通过检查新视图来验证给定数据库上查询存储的配置:
SELECT * FROM sys.database_query_store_options
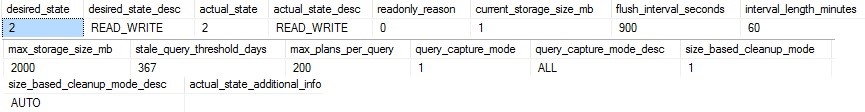
The results will confirm if the Query Store is enabled, as well as all of the configuration options that are available by selecting the Query Store menu under the database properties:
结果将通过选择数据库属性下的“查询存储”菜单来确认是否启用了“查询存储”以及所有可用的配置选项:
挑战 (The Challenge)
SQL Server has provided many tools over the years that assist in optimizing indexes, queries, memory and CPU settings, waits, and more. The primary tool available directly from Microsoft has been DMVs, which provide direct insight into many different features. The biggest difficulty in using these views has been consistency: Some accumulate data since server restart, others only maintain data that is in the plan cache, while others are only point-in-time measurements. In order to effectively use this information, it is necessary to capture, store, and analyze the data within, which is not a task suited for beginners. The alternative has often been to purchase 3rd party tools that monitor and manage this data for you, which costs money that your organization may or may not be willing to spend. The last, and least desirable option was to do none of these, and live by the seat of your pants.
多年来,SQL Server提供了许多工具来帮助优化索引,查询,内存和CPU设置,等待等。 可以直接从Microsoft获得的主要工具是DMV,它们可以直接了解许多不同的功能。 使用这些视图的最大困难在于一致性:一些自服务器重新启动以来会累积数据,另一些仅维护计划缓存中的数据,而另一些仅是时间点度量。 为了有效地使用此信息,有必要捕获,存储和分析其中的数据,这不是适合初学者的任务。 另一种方法常常是购买第三方工具,监控和管理这些数据对你来说,它的成本钱,你的组织可能会或可能不会愿意花。 最后,也是最不希望的选择是不执行任何操作,而是靠裤子的座位生活。
寻找顶级资源消费者 (Finding Top Resource Consumers)
The Query Store is an impressive feature, and one that provides quite a bit of functionality, with more being added in each Community Technical Preview. We will cover accessing this data via TSQL as well as using the Management Studio GUI. And with no further ado, let’s jump into what we can do with it!
查询存储是一项令人印象深刻的功能,它提供了很多功能,并且在每个社区技术预览版中都添加了更多功能。 我们将介绍如何通过TSQL以及使用Management Studio GUI来访问此数据。 事不宜迟,让我们跳进去做吧!
Our primary goal is to identify problematic queries, and Microsoft has provided a handful of out-of-the-box reports that allow us to quickly assess this. Within a database that has Query Store enabled, expand the Query Store menu:
我们的主要目标是确定有问题的查询,Microsoft提供了一些现成的报告,使我们可以快速评估此问题。 在已启用查询存储的数据库中,展开“查询存储”菜单:
Within here is a report called “Top Resource Consuming Queries”, which when run will display a screen like this:
这是一个名为“顶级资源消耗查询”的报告,该报告在运行时将显示如下屏幕:
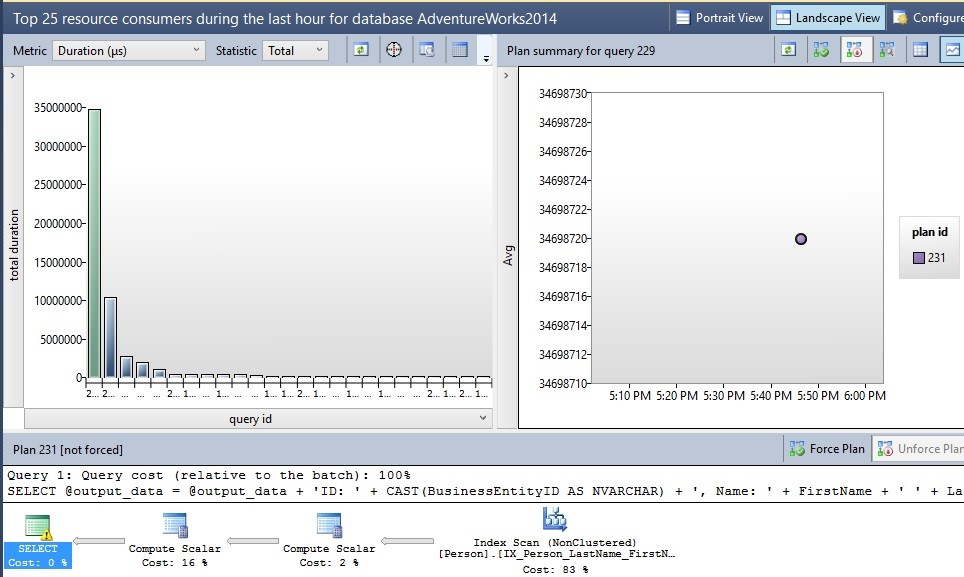
The default settings for this report show a chart of the top queries executed over the past hour, along with a graph of each query execution plan with duration, and then the actual execution plan on the bottom. From here, you can view any portion of the execution plan just as you normally would from Management Studio, or from the related dynamic management views. Query data such as this will be stored until the stale query threshold is met, or until the disk quota is met and cleanup needs to occur. This data is stored quite efficiently: My query store currently has 267 queries in it, and only 1MB is consumed of the 2GB that I allocated!
该报告的默认设置显示过去一个小时执行的最热门查询的图表,以及每个查询执行计划及其持续时间的图表,然后显示底部的实际执行计划。 从这里,您可以像通常从Management Studio或相关的动态管理视图中一样查看执行计划的任何部分。 诸如此类的查询数据将被存储,直到达到过时的查询阈值,或者达到磁盘配额并需要进行清理为止。 这些数据的存储效率很高:我的查询存储中目前有267个查询,在分配的2GB中仅消耗了1MB!
In the event that a query has multiple plans associated with it, you will be able to view each plan on the graph to the right. Below is an example of a sample query that had two different plans. You can drill into each one to learn more about when it was chosen and how it performed:
如果查询有多个与之关联的计划,您将能够在右侧的图形上查看每个计划。 下面是一个示例查询的示例,该示例具有两个不同的计划。 您可以深入研究每一个,以了解有关何时选择它以及如何执行的更多信息:
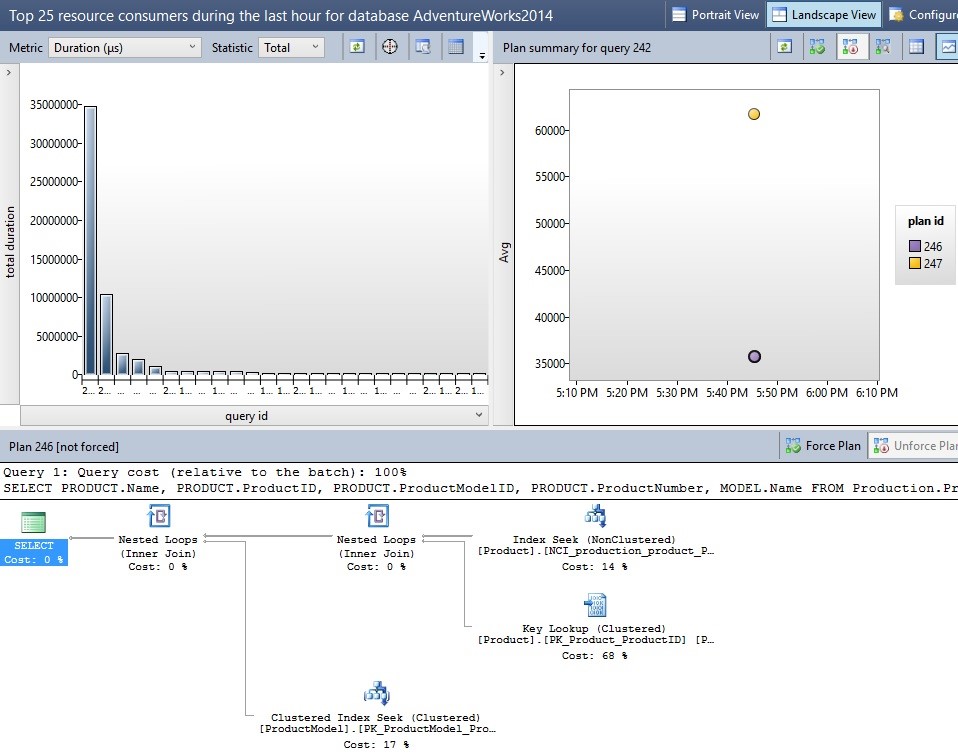
The icons on the upper right may be used to compare execution plans or to force a query to use a specific plan when possible in the future. In addition, you can change the view to create an ordered list of each plan, allowing you to more easily compare a variety of metrics all at once. Use caution when forcing plans, though, as a single plan may not always be the best one. Only force a plan if you are certain that it will be beneficial to all use cases for the given query!
将来可能时,右上方的图标可用于比较执行计划或强制查询使用特定计划。 此外,您可以更改视图以创建每个计划的有序列表,从而使您可以更轻松地一次比较各种指标。 但是,在强制执行计划时要谨慎,因为单个计划可能并不总是最好的。 仅在确定对给定查询的所有用例都有利的情况下,才实施计划!
Clicking on the Configure tab in the upper-right corner allows you to change a variety of options, such as which metrics to view, units, calculations, time intervals, and the number of queries to return:
单击右上角的“配置”选项卡,您可以更改各种选项,例如要查看的指标,单位,计算,时间间隔以及要返回的查询数:
These can all be useful when tracking down specific troublesome queries. For example, if your SQL Server has been showing signs of high CPU consumption, you could focus the charts on reporting CPU, rather than duration, reads, or some other metric. In addition, you can adjust the time period to view to any within the history of the query store. This is the true value of the Query Store as you can now locate a point in time when something bad happened on your server and review it whenever you’re free to do so.
当跟踪特定的麻烦查询时,所有这些都将很有用。 例如,如果您SQL Server一直显示CPU使用率高的迹象,则可以将图表重点放在报告CPU上,而不是持续时间,读取数或其他某种指标上。 此外,您可以调整时间段以查看查询存储历史中的任何时间段。 这是查询存储的真正价值,因为您现在可以找到服务器上发生问题的时间点,并在有空的时候对其进行检查。
Before diving into TSQL that can be used to identify the top resource-consuming queries, let’s introduce a database diagram to show how these views are related:
在探究可用于确定最消耗资源的查询的TSQL之前,让我们介绍一个数据库图以显示这些视图之间的关系:
The structure of these views is fairly straight-forward, with sys.query_store_query being the root of the diagram, and additional views branching off to provide details on the execution plan, query text, stats, and more. Using the diagram, we can write a query that joins each together:
这些视图的结构非常简单,其中sys.query_store_query是图的根,并且分支了其他视图以提供有关执行计划,查询文本,统计信息等的详细信息。 使用该图,我们可以编写一个将每个连接在一起的查询:
SELECT
	*
FROM sys.query_store_query
LEFT JOIN sys.query_store_query_text
ON query_store_query.query_text_id = query_store_query_text.query_text_id
LEFT JOIN sys.query_store_plan
ON query_store_query.query_id = query_store_plan.query_id
LEFT JOIN sys.query_store_runtime_stats
ON query_store_plan.plan_id = query_store_runtime_stats.plan_id
LEFT JOIN sys.query_store_runtime_stats_interval
ON query_store_runtime_stats.runtime_stats_interval_id = query_store_runtime_stats_interval.runtime_stats_interval_id
This returns absolutely everything, and does not make a very useful query, but does illustrate the important relationships above and how we will write queries against these views going forward. Now let’s pick out the most important columns to us and add some filters and sorts to make some use out of this data:
这绝对会返回所有内容,并且不会做出非常有用的查询,但是确实说明了上述重要关系以及我们将如何针对这些视图编写查询。 现在,让我们挑选出最重要的列,并添加一些过滤器和排序来利用这些数据:
SELECT TOP 50
	query_store_query_text.query_sql_text,
	CAST(query_store_plan.query_plan AS XML) AS query_plan_xml,
	query_store_runtime_stats.first_execution_time,
	query_store_runtime_stats.last_execution_time,
	query_store_runtime_stats.count_executions,
	query_store_runtime_stats.avg_duration AS avg_duration_microseconds,
	query_store_runtime_stats.last_duration AS last_duration_microseconds,
	query_store_runtime_stats.avg_cpu_time AS avg_cpu_time_microseconds,
	query_store_runtime_stats.last_cpu_time AS last_cpu_time_microseconds,
	query_store_runtime_stats.avg_logical_io_reads,
	query_store_runtime_stats.last_logical_io_reads,
	query_store_runtime_stats.avg_query_max_used_memory AS avg_query_max_used_memory_8k_pages,
	query_store_runtime_stats.last_query_max_used_memory AS last_query_max_used_memory_8k_pages,
	query_store_runtime_stats.avg_rowcount,
	query_store_runtime_stats.last_rowcount,
	query_store_runtime_stats_interval.start_time AS interval_start_time,
	query_store_runtime_stats_interval.end_time AS interval_end_time,
	query_store_query.query_id,
	query_store_query_text.query_text_id,
	query_store_plan.plan_id
FROM sys.query_store_query
LEFT JOIN sys.query_store_query_text
ON query_store_query.query_text_id = query_store_query_text.query_text_id
LEFT JOIN sys.query_store_plan
ON query_store_query.query_id = query_store_plan.query_id
LEFT JOIN sys.query_store_runtime_stats
ON query_store_plan.plan_id = query_store_runtime_stats.plan_id
LEFT JOIN sys.query_store_runtime_stats_interval
ON query_store_runtime_stats.runtime_stats_interval_id = query_store_runtime_stats_interval.runtime_stats_interval_id
WHERE query_store_runtime_stats_interval.start_time BETWEEN '11/17/2015 22:00:00' AND '11/17/2015 23:00:00'
ORDER BY query_store_runtime_stats.avg_cpu_time DESC
-- ORDER BY query_store_runtime_stats.avg_duration DESC
-- ORDER BY query_store_runtime_stats.count_executions DESC
-- ORDER BY query_store_runtime_stats.avg_logical_io_reads DESC
-- ORDER BY query_store_runtime_stats.avg_rowcount DESC
This query returns useful info on queries, their text, execution plans, and some historical statistics on their resource consumption. It filters on the start_time found in sys.query_store_runtime_stats_interval, which breaks up queries into hour-long intervals for reporting ease and does so over a fixed one hour period. The data is sorted by average CPU time, putting the greatest CPU consumers on the top of the list. Additional useful filters are provided, but commented out, for sorting on duration, execution count, logical reads, and average row count. This query will return multiple rows if multiple execution plans exist.
该查询返回有关查询的有用信息,其文本,执行计划以及一些有关其资源消耗的历史统计信息。 它根据sys.query_store_runtime_stats_interval中找到的start_time进行过滤 ,该查询将查询分为几个小时的时间间隔以简化报告,并且在一小时的固定时间内执行。 数据按平均CPU时间排序,将最大的CPU使用者放在列表的顶部。 提供了其他有用的过滤器,但已将其注释掉,以对持续时间,执行计数,逻辑读取和平均行计数进行排序。 如果存在多个执行计划,则此查询将返回多行。
追踪查询 (Tracking Queries)
If there is a particular query that you want to focus on, it is possible to track it within the Query Store. For example, let’s say that my research above uncovered a particular query that was performing inconsistently. After identifying the query using one of the methods above, we can go to “Tracked Queries”, under the Query Store options within a database:
如果有您要关注的特定查询,则可以在查询存储中对其进行跟踪。 例如,假设我的上述研究发现了一个执行不一致的特定查询。 使用上述方法之一识别查询后,我们可以转到数据库中“查询存储”选项下的“跟踪查询”:
From here, a new tab opens with a text-box where you can enter a query id:
在这里,将打开一个新选项卡,其中包含一个文本框,您可以在其中输入查询ID:
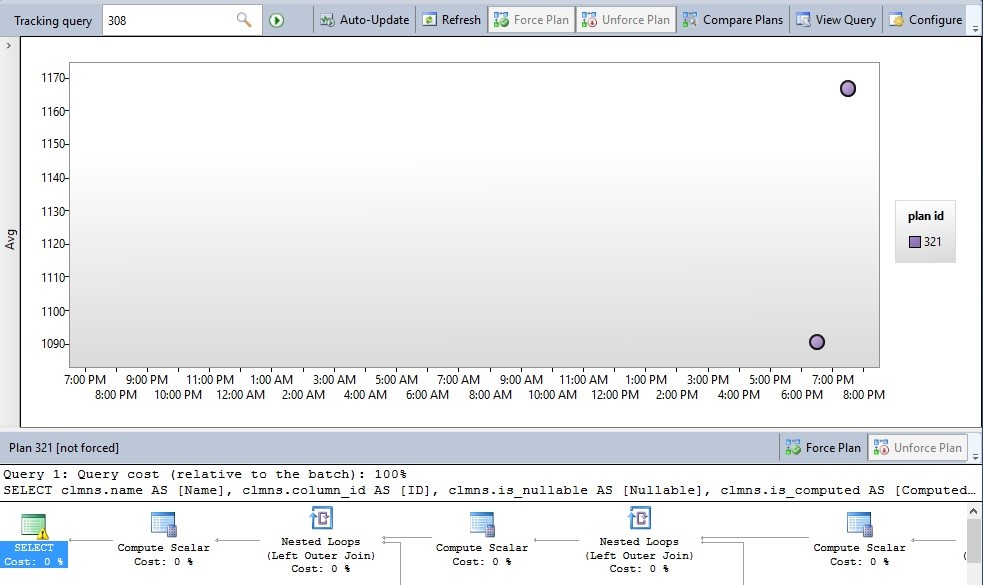
Once a query id is entered, the data for that specific query will be brought up for review. In addition to refreshing and configuring this query view, you can also enable the Auto-Update option, which will refresh the window, using whatever interval is entered in the Configure menu to the right. The default auto-refresh rate is 5s, but can be adjusted higher or lower, depending on the urgency of your research. All of the data available in the query store can be accessed here, including query text, query plans, and query stats. This feature is only available in the GUI, but is a convenient graphical interface for watching query executions and analyzing the performance results in real-time.
输入查询ID后,将调出该特定查询的数据以供查看。 除了刷新和配置此查询视图之外,您还可以启用自动更新选项,该选项将使用在右侧“配置”菜单中输入的任何间隔刷新窗口。 默认的自动刷新率是5s,但可以根据研究的紧迫性将其调整为更高或更低。 可以在此处访问查询存储中的所有可用数据,包括查询文本,查询计划和查询统计信息。 此功能仅在GUI中可用,但是它是方便的图形界面,用于观察查询执行情况和实时分析性能结果。
We can write TSQL to restrict our query search to a specific time interval, as well as an individual query or group or queries, which will essentially perform the same function:
我们可以编写TSQL来将查询搜索限制在特定的时间间隔内,也可以将单个查询或单个组或多个查询限制在一定的时间范围内,这些功能基本上将执行相同的功能:
SELECT TOP 50
	query_store_query.query_id,
	query_store_query_text.query_sql_text,
	CAST(query_store_plan.query_plan AS XML) AS query_plan_xml,
	query_store_runtime_stats.first_execution_time,
	query_store_runtime_stats.last_execution_time,
	query_store_runtime_stats.count_executions,
	query_store_runtime_stats.avg_duration AS avg_duration_microseconds,
	query_store_runtime_stats.last_duration AS last_duration_microseconds,
	query_store_runtime_stats.avg_cpu_time AS avg_cpu_time_microseconds,
	query_store_runtime_stats.last_cpu_time AS last_cpu_time_microseconds,
	query_store_runtime_stats.avg_logical_io_reads,
	query_store_runtime_stats.last_logical_io_reads,
	query_store_runtime_stats.avg_query_max_used_memory AS avg_query_max_used_memory_8k_pages,
	query_store_runtime_stats.last_query_max_used_memory AS last_query_max_used_memory_8k_pages,
	query_store_runtime_stats.avg_rowcount,
	query_store_runtime_stats.last_rowcount
FROM sys.query_store_query
LEFT JOIN sys.query_store_query_text
ON query_store_query.query_text_id = query_store_query_text.query_text_id
LEFT JOIN sys.query_store_plan
ON query_store_query.query_id = query_store_plan.query_id
LEFT JOIN sys.query_store_runtime_stats
ON query_store_plan.plan_id = query_store_runtime_stats.plan_id
LEFT JOIN sys.query_store_runtime_stats_interval
ON query_store_runtime_stats.runtime_stats_interval_id = query_store_runtime_stats_interval.runtime_stats_interval_id
WHERE query_store_runtime_stats_interval.start_time BETWEEN '11/17/2015 22:00:00' AND '11/18/2015 22:00:00'
AND query_store_query_text.query_sql_text LIKE '%SELECT * FROM Person.Person%'
ORDER BY query_store_runtime_stats.last_execution_time DESC
This example will pull all query data from the past day for any query with “SELECT * FROM Person.Person” anywhere within its SQL text and order it with the most recently executed at the top of the list. Searching query text using the query store is quite fast compared to many of the older methods of searching through query text.
此示例将从SQL文本内任何位置使用“ SELECT * FROM Person.Person”的查询中提取过去一天的所有查询数据,并以列表的最新执行顺序对其进行排序。 与许多通过查询文本进行搜索的较旧方法相比,使用查询存储库搜索查询文本的速度相当快。
搜索执行计划 (Searching Execution Plans)
In addition to searching through query text, we can also look through the execution plan text in order to find specific indexes used, or other operators that interest you. In the following example, we find the top 50 queries that use the IX_Person_LastName_FirstName_MiddleName index, found in the AdventureWorks database:
除了搜索查询文本外,我们还可以浏览执行计划文本以查找所使用的特定索引或您感兴趣的其他运算符。 在以下示例中,我们发现使用AdventureWorks数据库中的IX_Person_LastName_FirstName_MiddleName索引的前50个查询:
SELECT TOP 50
	query_store_query.query_id,
	query_store_query_text.query_sql_text,
	CAST(query_store_plan.query_plan AS XML) AS query_plan_xml,
	query_store_runtime_stats.avg_logical_io_reads
FROM sys.query_store_query
LEFT JOIN sys.query_store_query_text
ON query_store_query.query_text_id = query_store_query_text.query_text_id
LEFT JOIN sys.query_store_plan
ON query_store_query.query_id = query_store_plan.query_id
LEFT JOIN sys.query_store_runtime_stats
ON query_store_plan.plan_id = query_store_runtime_stats.plan_id
LEFT JOIN sys.query_store_runtime_stats_interval
ON query_store_runtime_stats.runtime_stats_interval_id = query_store_runtime_stats_interval.runtime_stats_interval_id
WHERE query_store_runtime_stats_interval.start_time BETWEEN '11/17/2015 22:00:00' AND '11/18/2015 22:00:00'
AND query_store_plan.query_plan LIKE '%IX_Person_LastName_FirstName_MiddleName%'
ORDER BY query_store_runtime_stats.avg_logical_io_reads DESC
The results are ordered by logical reads, allowing us to gather information about the worst IO offenders that are using a particular index. Additionally, this is a valuable way to investigate how specific indexes are used and can be a useful tool when combined with index stats. We can also search execution plans for specific database, table, column names, operator types, or even optimizer warnings. The following search will find any queries from the past day with the CONVERT_IMPLICIT operator found within the execution plan:
结果按逻辑读取排序,使我们可以收集有关使用特定索引的最严重IO违规者的信息。 此外,这是研究如何使用特定索引的宝贵方法,并且在与索引统计信息结合使用时可以成为有用的工具。 我们还可以搜索执行计划,以查找特定的数据库,表,列名称,运算符类型甚至优化器警告。 以下搜索将查找执行计划中找到的CONVERT_IMPLICIT运算符在过去一天中的所有查询:
SELECT TOP 50
	query_store_query.query_id,
	query_store_query_text.query_sql_text,
	query_store_plan.query_plan AS query_plan_text,
	CAST(query_store_plan.query_plan AS XML) AS query_plan_xml,
	query_store_runtime_stats.last_execution_time
FROM sys.query_store_query
LEFT JOIN sys.query_store_query_text
ON query_store_query.query_text_id = query_store_query_text.query_text_id
LEFT JOIN sys.query_store_plan
ON query_store_query.query_id = query_store_plan.query_id
LEFT JOIN sys.query_store_runtime_stats
ON query_store_plan.plan_id = query_store_runtime_stats.plan_id
LEFT JOIN sys.query_store_runtime_stats_interval
ON query_store_runtime_stats.runtime_stats_interval_id = query_store_runtime_stats_interval.runtime_stats_interval_id
WHERE query_store_runtime_stats_interval.start_time BETWEEN '11/17/2015 22:00:00' AND '11/18/2015 22:00:00'
AND query_store_plan.query_plan LIKE '%convert_implicit%'
ORDER BY query_store_runtime_stats.last_execution_time DESC
This can be a potentially great way to dig up unwanted type conversions that may be harming performance, or uncover other warnings that could aid in performance optimization. If you find that there is a lot of noise in your results, additional filters can be added to remove queries on system objects or on those that are irrelevant to your research.
这可能是挖掘有害的类型转换(可能损害性能)或发现其他有助于性能优化的警告的潜在好方法。 如果发现结果中有很多杂音,则可以添加其他过滤器以删除对系统对象或与您的研究无关的查询。
回归查询 (Regressed Queries)
One additional functionality the query store has is that it allows us to track regressed queries. A regressed query is the one where resource consumption or duration increased significantly at a given point in time. This is an excellent way to identify changes due to application releases, data imports, or other significant events that can affect overall SQL Server performance. In addition, this feature can be used to find unknown database events and use that knowledge to proactively prevent such events from occurring in the future. For example, if a large number of queries on a specific table suddenly doubled in runtime and CPU consumption in a very short span of time one day, we could use that data to determine the time of the event and use the query data to figure out the details and take the necessary actions in response to it. Regressed queries can be found in the GUI in the Query Store menu within a database:
查询存储具有的另一项功能是,它允许我们跟踪回归查询。 回归查询是在给定时间点资源消耗或持续时间显着增加的查询。 这是识别由于应用程序版本,数据导入或其他可能影响整体SQL Server性能的重要事件而导致的更改的绝佳方法。 另外,此功能可用于查找未知的数据库事件,并使用该知识来主动防止将来发生此类事件。 例如,如果特定表上的大量查询在一天的很短时间内突然在运行时和CPU消耗上翻了一番,我们可以使用该数据确定事件的时间,并使用查询数据来确定详细信息并采取必要的措施以应对之。 可以在GUI的“查询存储”菜单中找到数据库中的回归查询:
Double-clicking on Regressed Queries will open a new tab, similar to the ones we have seen thus far:
双击“回归查询”将打开一个新选项卡,类似于我们到目前为止所看到的:
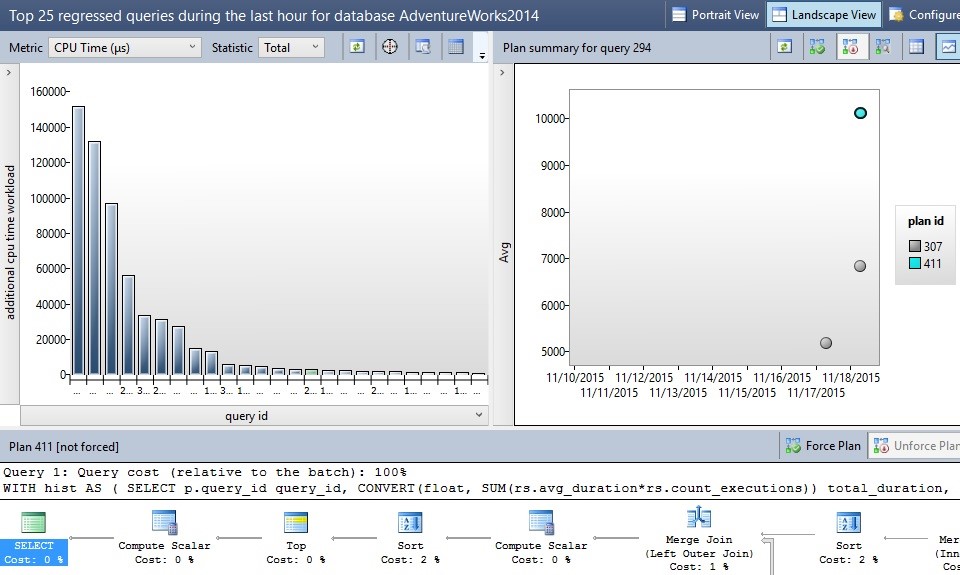
As with the other Query Store reports, you can customize to your heart’s content, as well as sort and display whatever metrics you are looking for. The goal here is to take a look at these metrics and determine which queries have truly begun to perform poorly and why. In the example above, we can determine if any queries had their CPU consumption increase greatly. There are a number of icons available that will open the execution plans or query text in a separate window, or change the graphical view to a sortable list.
与其他查询存储报告一样,您可以根据自己的需求进行自定义,还可以对所需的指标进行排序和显示。 此处的目标是查看这些指标,并确定哪些查询真正开始表现不佳以及原因。 在上面的示例中,我们可以确定是否有任何查询的CPU使用量大大增加。 有许多图标可用于打开执行计划或在单独的窗口中查询文本,或将图形视图更改为可排序的列表。
The following query is an adaption of one provided by Microsoft in their SQL Server 2016 preview documentation that returns customized data on regressed queries. This provides additional information as well as more ways to filter/sort:
以下查询是Microsoft在其SQL Server 2016预览文档中提供的查询的改编,该文档在回归查询中返回自定义数据。 这提供了更多信息以及更多的过滤/排序方式:
returns customized data on regressed queries.  This provides additional information as well as more ways to filter/sort:
SELECT
    query_store_query_text.query_sql_text,
    stats_interval_1.start_time AS interval_1,
    stats_interval_2.start_time AS interval_2,
    query_plan_1.plan_id AS plan_id_1,
	query_plan_2.plan_id AS plan_id_2,
    runtime_stats_1.avg_duration AS avg_duration_1,
    runtime_stats_2.avg_duration AS avg_duration_2,
	runtime_stats_1.avg_cpu_time AS avg_cpu_1,
    runtime_stats_2.avg_cpu_time AS avg_cpu_2,
	runtime_stats_1.avg_logical_io_reads AS avg_reads_1,
    runtime_stats_2.avg_logical_io_reads AS avg_reads_2
FROM sys.query_store_query_text
INNER JOIN sys.query_store_query
ON query_store_query_text.query_text_id = query_store_query.query_text_id
INNER JOIN sys.query_store_plan AS query_plan_1
ON query_store_query.query_id = query_plan_1.query_id
INNER JOIN sys.query_store_runtime_stats AS runtime_stats_1
ON query_plan_1.plan_id = runtime_stats_1.plan_id
INNER JOIN sys.query_store_runtime_stats_interval AS stats_interval_1
ON stats_interval_1.runtime_stats_interval_id = runtime_stats_1.runtime_stats_interval_id
INNER JOIN sys.query_store_plan AS query_plan_2
ON query_store_query.query_id = query_plan_2.query_id
INNER JOIN sys.query_store_runtime_stats AS runtime_stats_2
ON query_plan_2.plan_id = runtime_stats_2.plan_id
INNER JOIN sys.query_store_runtime_stats_interval AS stats_interval_2
ON stats_interval_2.runtime_stats_interval_id = runtime_stats_2.runtime_stats_interval_id
WHERE stats_interval_1.start_time > DATEADD(DAY, -7, CURRENT_TIMESTAMP)
AND stats_interval_2.start_time > stats_interval_1.start_time
AND query_plan_1.plan_id <> query_plan_2.plan_id
-- AND runtime_stats_2.avg_duration > 2 * runtime_stats_1.avg_duration
-- AND runtime_stats_2.avg_logical_io_reads > 2 * runtime_stats_1.avg_logical_io_reads
AND runtime_stats_2.avg_cpu_time > 2 * runtime_stats_1.avg_cpu_time
ORDER BY query_store_query.query_id, stats_interval_1.start_time, stats_interval_2.start_time;
This can be a useful way to customize the criteria used in determining a regressed query. The above example returns any queries in the past week where the CPU doubled between one execution and another future execution. Some commented TSQL allows for comparisons based on duration and reads, though any other columns could be included. For example, we could check for queries whose duration doubled while reads tripled. Alternatively, we could search for queries whose performance improved over time and determine the cause. In either case, we can use this data to hone in on important events that may require further attention in the future.
这是自定义用于确定回归查询的条件的有用方法。 上面的示例返回过去一周中CPU在一个执行和另一个将来执行之间加倍的所有查询。 一些注释过的TSQL允许基于持续时间和读取进行比较,尽管可以包括任何其他列。 例如,我们可以检查持续时间增加一倍而读取次数增加三倍的查询。 或者,我们可以搜索性能随时间而提高的查询并确定原因。 无论哪种情况,我们都可以使用这些数据来处理可能在将来可能需要进一步关注的重要事件。
结论 (Conclusion)
With the information provided so far, we could easily write an endless list of queries in order to utilize the query store data provided in this new feature. This feature was a pleasant surprise and provided a valuable tool for any database administrator’s performance tuning arsenal. Please note that all data, queries, and screenshots have been tested in SQL Server 2016 CTP 3.0 and may not work in previous or future versions as they are released. In addition to all of the features introduced so far, Microsoft has indicated that more will be added by the time SQL Server 2016 is released to the public. This gives me quite a bit to look forward to over the next year!
利用到目前为止提供的信息,我们可以轻松地编写无休止的查询列表,以利用此新功能中提供的查询存储数据。 此功能令人惊讶,它为任何数据库管理员的性能调优工具提供了宝贵的工具。 请注意,所有数据,查询和屏幕截图均已在SQL Server 2016 CTP 3.0中进行了测试,并且在发布之前或将来的版本中可能无法使用。 除了到目前为止介绍的所有功能,Microsoft表示,到SQL Server 2016发行时,还将添加更多功能。 这使我有很多期待下一年的机会!
翻译自: https://www.sqlshack.com/the-sql-server-query-store-in-action/


 1633
1633

 被折叠的 条评论
为什么被折叠?
被折叠的 条评论
为什么被折叠?
 到【灌水乐园】发言


