


SQL Server Query Store is a performance monitoring tool that helps us evaluate the performance of a SQL query in terms of several different performance metrics such as CPU and Memory Consumption, execution time and the I/O cycles consumed by the query. Query store is similar to the windows “Task Manager”. A task manager provides information about the CPU, Memory, Network and Disc consumption of a process. Similarly, the Query Store provides insight to similar information.
SQL Server查询存储是一种性能监视工具,可以帮助我们根据几种不同的性能指标(例如,CPU和内存消耗,执行时间以及查询消耗的I / O周期)评估SQL查询的性能。 查询存储类似于窗口“任务管理器”。 任务管理器提供有关进程的CPU,内存,网络和磁盘消耗的信息。 同样,查询存储可提供对相似信息的洞察力。
The following are some of the operations that the Query Store performs:
以下是查询存储执行的一些操作:
- Captures query plans and runtime query statistics 捕获查询计划和运行时查询统计信息
- Stores query workload history 存储查询工作负载历史记录
- Allows database level troubleshooting and performance analysis 允许数据库级故障排除和性能分析
- Enforce policies that execute queries in a specific way 强制执行以特定方式执行查询的策略
In this article, we will see how to enable the Query Store option and how to perform different operations with the Query Store.
在本文中,我们将看到如何启用查询存储选项以及如何对查询存储执行不同的操作。
创建虚拟数据集 (Creating Dummy Dataset)
Before working with the SQL Server Query Store, let’s first create a dummy dataset. Execute the following script to create the dataset:
在使用SQL Server查询存储之前,我们首先创建一个虚拟数据集。 执行以下脚本创建数据集:
CREATE Database Bookshop;
    GO
    USE Bookshop;

    CREATE TABLE Book
    (
        id INT,
        name VARCHAR(50) NOT NULL,
        price VARCHAR(50) NOT NULL
     )

     CREATE TABLE Author
    (
        id INT,
        name VARCHAR(50) NOT NULL,
        age VARCHAR(50) NOT NULL
    )
In the script above, we create a new database Bookshop. We then created two tables i.e. Book and Author within the Bookshop database. The Book table contains three columns: id, name, and price. Similarly, the Author table contains columns: id, name, and age.
在上面的脚本中,我们创建一个新的数据库Bookshop。 然后,我们在Bookshop数据库中创建了两个表,即Book和Author。 Book表包含三列:id,名称和价格。 同样,“作者”表包含以下列:ID,名称和年龄。
Let’s now add some dummy data in the Book table.
现在让我们在Book表中添加一些虚拟数据。
INSERT INTO Book

    VALUES
    (1, 'Book1', 15),
    (2, 'Book2', 20),
    (3, 'Book3', 30),
    (4, 'Book4', 25),
    (5, 'Book5', 10)
Similarly, the following script adds records in the Author table.
同样,以下脚本在Author表中添加记录。
INSERT INTO Author

VALUES
(1, 'Author1', 15),
(2, 'Author2', 20),
(3, 'Author3', 30),
(4, 'Author4', 25),
(5, 'Author5', 10)
启用SQL Server查询存储 (Enabling SQL Server Query Store)
To enable a query store for a database, you can go to SQL Server Management Studio (SSMS) and right-click on the database which you want to enable Query Store for. From the dropdown menu that appears, click on “properties” as shown in the following figure:
要为数据库启用查询存储,可以转到SQL Server Management Studio(SSMS),然后右键单击要为其启用查询存储的数据库。 在出现的下拉菜单中,单击“属性”,如下图所示:
Once you click “properties”, you should see the following screen window.
单击“属性”后,应该会看到以下屏幕窗口。
From the options on the top left, select “Query Store”. You will be taken to the following window.
从左上方的选项中,选择“查询存储”。 您将被带到以下窗口。
To enable the SQL Server Query store, click on the “Off” option to the right of “Operation Mode” and then select “Read-Write” from the drop-down list that appears as shown in the following screenshot. Doing so will enable the Query Store for the “Bookshop” database.
要启用SQL Server查询存储,请单击“操作模式”右侧的“关闭”选项,然后从出现的下拉列表中选择“读写”,如以下屏幕快照所示。 这样做将启用“ Bookshop”数据库的查询存储。
Let’s briefly discuss the different options in the Query Store window.
让我们简要讨论“查询存储”窗口中的不同选项。
- Data Flush Interval: Writes query and database statistics to discuss for logging purposes. The default time is 15 minutes 数据刷新间隔 :编写查询和数据库统计信息以进行讨论,以进行日志记录。 默认时间是15分钟
- Statistics Collection Interval: Interval to collect database and query statistics over. The default value is 1 hour 统计信息收集间隔 :收集数据库和查询统计信息的间隔。 默认值为1小时
- Max Size (MB): Data captured by the SQL Server Query Store is stored in a file. The Max Size (MB) specifies the file size. The default value is 100 MB 最大大小(MB) :SQL Server查询存储捕获的数据存储在文件中。 最大大小(MB)指定文件大小。 默认值为100 MB
- Query Store Capture Mode: By default, this is set to ALL which means that all the different types of statistics that the Query Store is supposed to store will be stored 查询存储捕获模式 :默认情况下,它设置为ALL,这意味着将存储查询存储应该存储的所有不同类型的统计信息
- Size Based Cleanup Mode: It is used to purge the data when the file size for SQL Server Query Store exceeds Max Size in MBs. By default, it is set to Off. You can enable it by selecting the Auto option 基于大小的清理模式 :当SQL Server查询存储的文件大小超过最大大小(以MB为单位)时,用于清除数据。 默认情况下,它设置为“关”。 您可以通过选择自动选项来启用它
- Stale Query Threshold (Days): Number of days after which the statistics from the Query will be removed 过时的查询阈值(天) :从查询中删除统计信息的天数
SQL Server creates a view for the Query Store in System Views of the database on which you enable the Query Store. To see the view, go to Database-> Views -> System Views and there you should see sys.query_store_plan. This view can be used to view reports about the information retrieved by the Query Store.
SQL Server在启用查询存储的数据库的系统视图中为查询存储创建一个视图。 要查看该视图,请转到“ 数据库”->“视图”->“系统视图” ,在那里您应该看到sys.query_store_plan。 该视图可用于查看有关查询存储所检索信息的报告。
查看SQL Server查询存储报告 (Viewing SQL Server Query Store Reports)
If you do not have already executed any queries on the “Bookshop” database, execute the following queries. We are executing these queries because we want to see different types of performance metrics for our queries.
如果尚未在“ Bookshop”数据库上执行任何查询,请执行以下查询。 我们执行这些查询是因为我们想查看查询的不同类型的性能指标。
Execute the following script:
执行以下脚本:
USE Bookshop

    SELECT * FROM Author
    GO 100


    INSERT INTO Book

    VALUES
    (6, 'Book6', 15),
    (7, 'Book7', 20),
    (8, 'Book8', 30),
    (9, 'Book9', 25),
    (10, 'Book10', 10)
    Go 10


    INSERT INTO Author

    VALUES
    (6, 'Author6', 15),
    (7, 'Author7', 20),
    (8, 'Author8', 30),
    (9, 'Author9', 25),
    (10, 'Author10', 10)
    Go 10
In the script above, we execute three different queries multiple times. The first READ query is executed for 100 times. The next two INSERT queries are executed 10 times.
在上面的脚本中,我们多次执行三个不同的查询。 第一个READ查询执行100次。 接下来的两个INSERT查询执行10次。
To view the SQL Server Query Store Reports, go to the Database->Query Store as shown below:
要查看SQL Server查询存储报告,请转到数据库->查询存储,如下所示:
回归查询 (Regressed Queries)
To view the regressed queries, right-click on the “Regressed Queries” option and then click “View Regressed Queries”. The following screen will appear:
要查看回归查询,请右键单击“回归查询”选项,然后单击“查看回归查询”。 将出现以下屏幕:
To configure the regressed query window, select the Configure option from the top right corner. The Configure options open the following window:
要配置回归查询窗口,请从右上角选择“配置”选项。 配置选项将打开以下窗口:
Here you can select the characteristics that you want to view for the regressed queries. For instance, the duration of the query, the Memory Consumption, Logical Reads and Writes etc. You can also set the Time Interval and the number of Queries to view.
在这里,您可以选择要为回归查询查看的特征。 例如,查询的持续时间,内存消耗,逻辑读取和写入等。您还可以设置时间间隔和要查看的查询数。
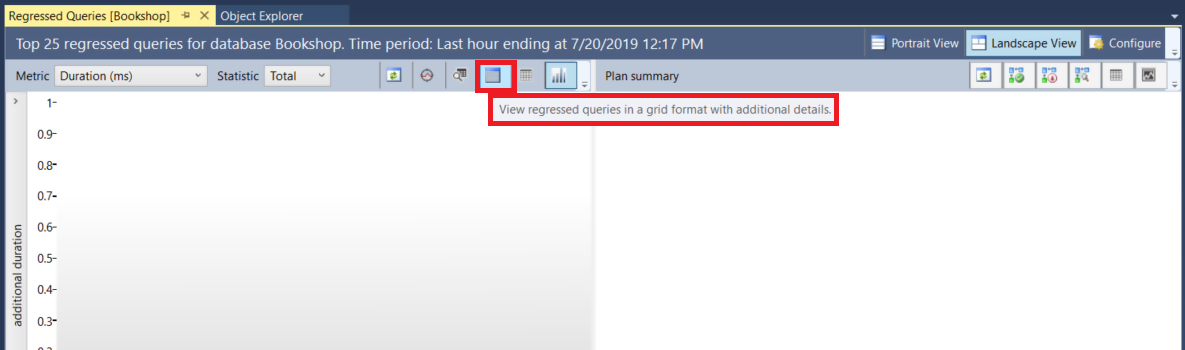
It is important to note that if you do not see any query in the chart view, click on “View regressed queries in a grid format with additional details” as shown below.
重要的是要注意,如果您在图表视图中看不到任何查询,请单击“以其他详细信息以网格格式查看回归查询”,如下所示。
You will see the details of the regressed queries as shown below:
您将看到如下所示的回归查询的详细信息:
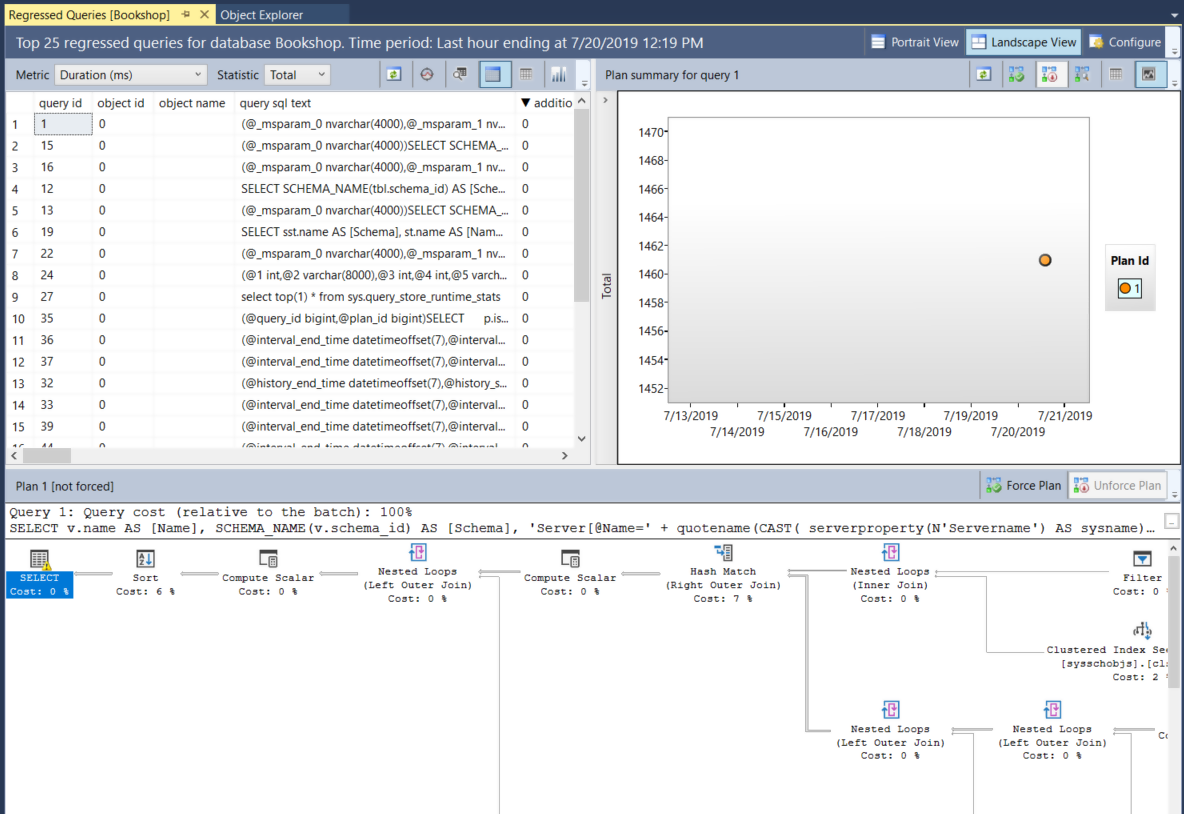
You can see the query Id along with the detailed statistics regarding every query.
您可以查看查询ID以及有关每个查询的详细统计信息。
整体资源消耗 (Overall Resource Consumption)
The overall resource consumption option shows an overall view of the resources consumed by the queries over a specific period of time. In the following screenshot, the overall resource consumption by all of our queries, executed in the last one hour is being shown.
“总体资源消耗”选项显示特定时间段内查询消耗的资源的总体视图。 在以下屏幕截图中,显示了在过去一小时内执行的所有查询的总体资源消耗。
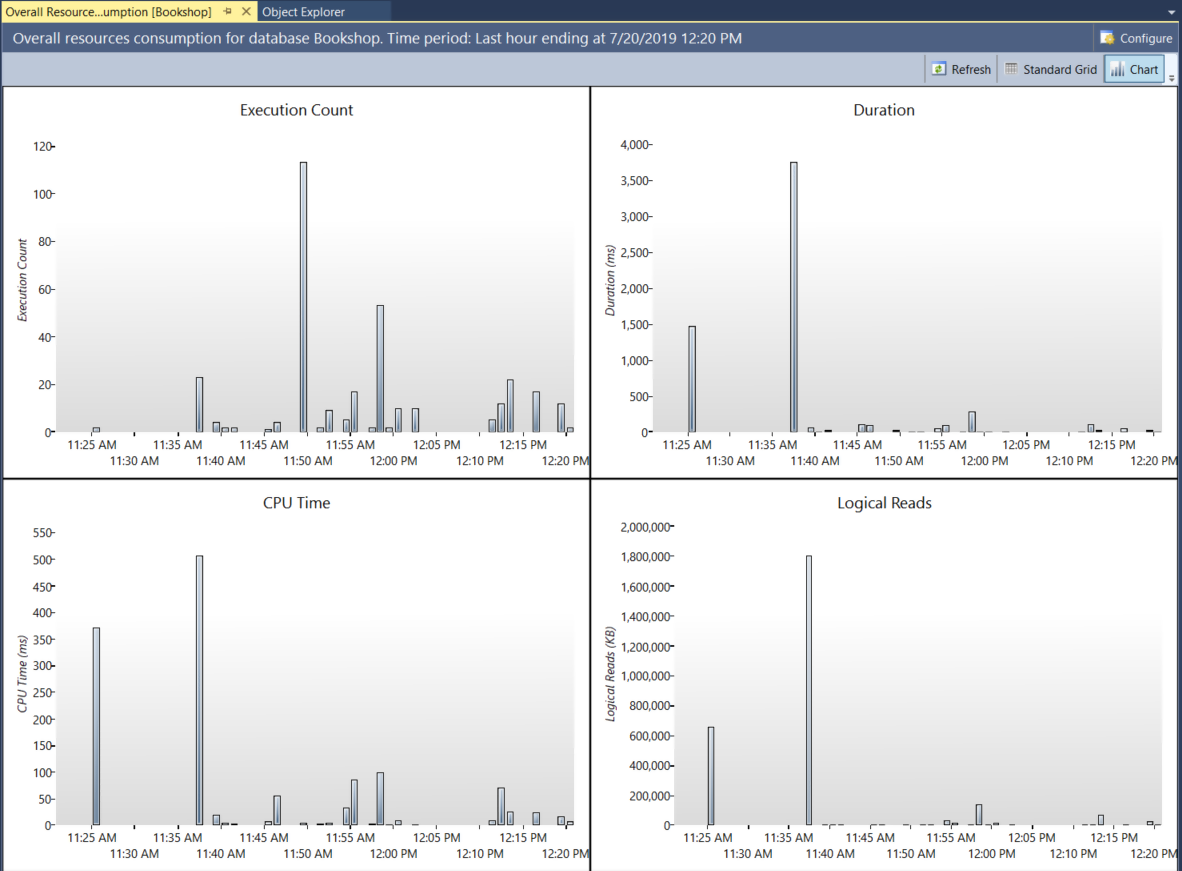
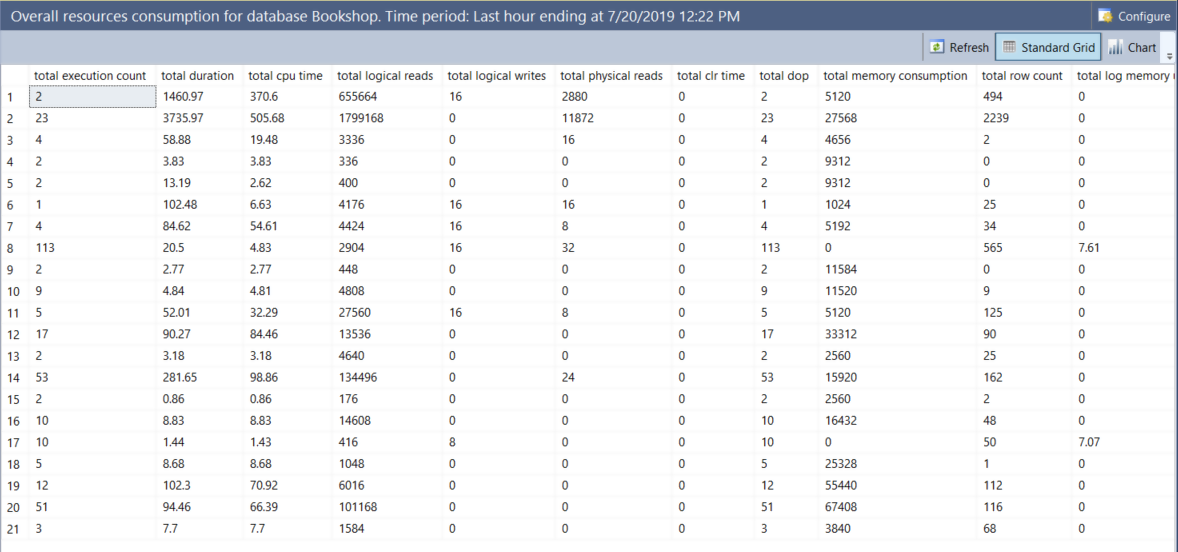
Here again, you can use the “Configure” option to specify the type of statistics you want to see, the time interval for which you want to see the statistics and the number of queries that you want to see in the report. If you click on the Standard Grid option from the top left menu, you will see the overall resource consumption in a grid format as shown below:
再次在这里,您可以使用“配置”选项来指定要查看的统计信息的类型,要查看其统计信息的时间间隔以及要在报告中查看的查询数。 如果单击左上方菜单中的“标准网格”选项,您将以网格格式看到总体资源消耗,如下所示:
顶级资源消费者 (Top Resource Consumers)
Top resource consumers, as the name suggests are the queries that consume the most resources. By default, information about 25 most resource consuming queries are displayed. As shown below, it shows the CPU time for the highest resource consuming queries for the last hour.
顾名思义,顶级资源使用者是消耗最多资源的查询。 默认情况下,显示有关25个最消耗资源的查询的信息。 如下所示,它显示了最近一个小时消耗资源最多的查询的CPU时间。
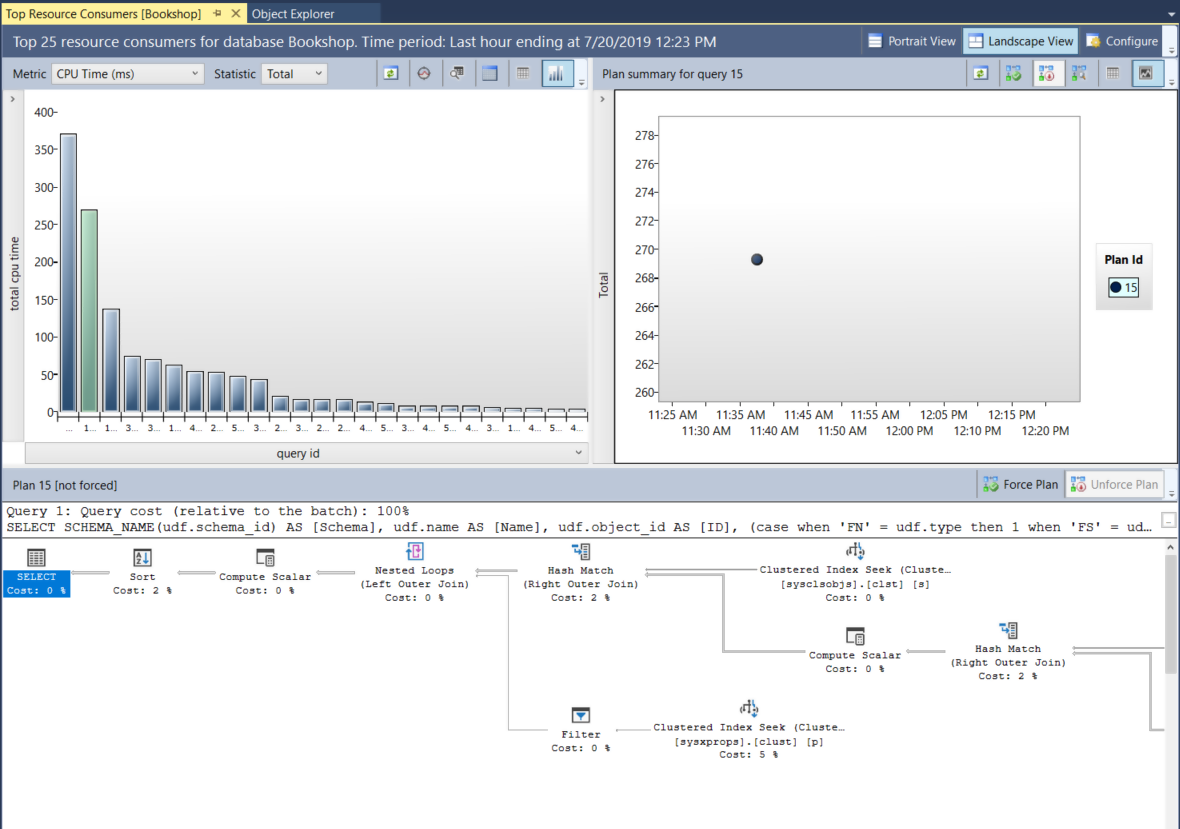
Again, you can use the “Configure” option to change the statistics. Another option is to click on “Metric” in the top right of the window and to change the performance metric for the queries.
同样,您可以使用“配置”选项来更改统计信息。 另一个选项是单击窗口右上角的“指标”,然后更改查询的性能指标。
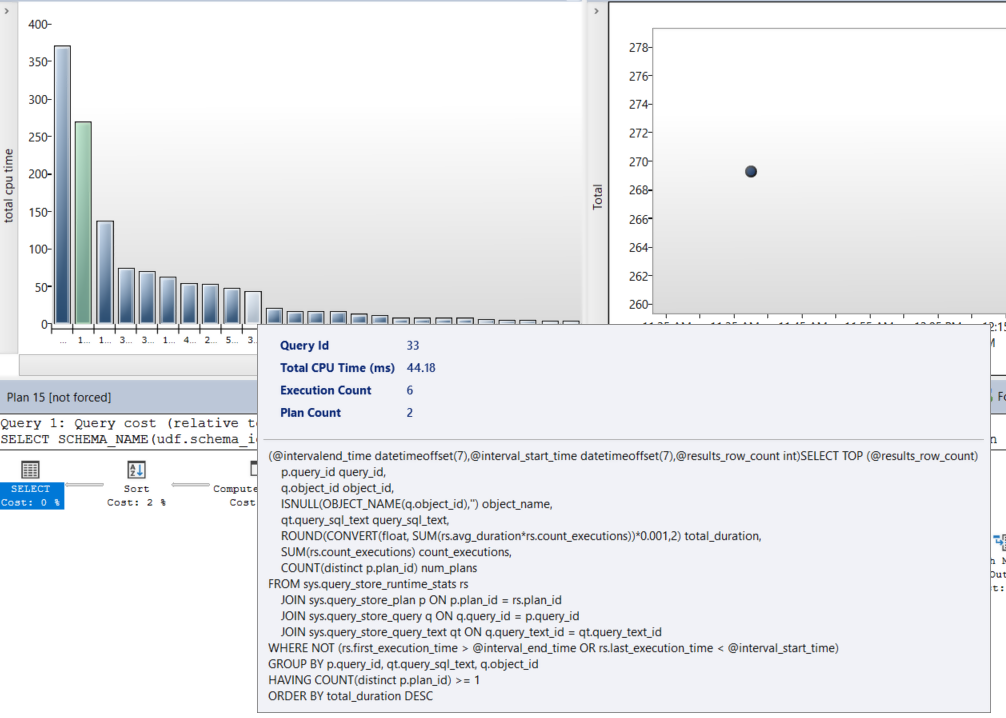
If you hover over a query, you can see the details of the query as shown below:
如果将鼠标悬停在查询上,则可以看到查询的详细信息,如下所示:
Since we do not have any queries with a forced plan, if you select “Query with Forced Plans” option, you will not see anything.
由于我们没有任何有关强制计划的查询,因此,如果选择“强制计划查询”选项,则不会看到任何内容。
高变异查询 (Queries with High Variation)
This feature was introduced in 2017. Queries with high variations are the queries with the most variation between different performance metrics. For example, sometimes they take more CPU cycles and times to execute and sometimes they execute fairly quickly. Such queries have parameterization problems. It is important to locate and correct such queries. The following screenshot displays information about queries with high variation.
此功能于2017年推出。变化最大的查询是不同性能指标之间变化最大的查询。 例如,有时它们需要更多的CPU周期和时间来执行,有时它们执行得很快。 这样的查询具有参数化问题。 找到并纠正此类查询很重要。 以下屏幕快照显示了有关变化较大的查询的信息。
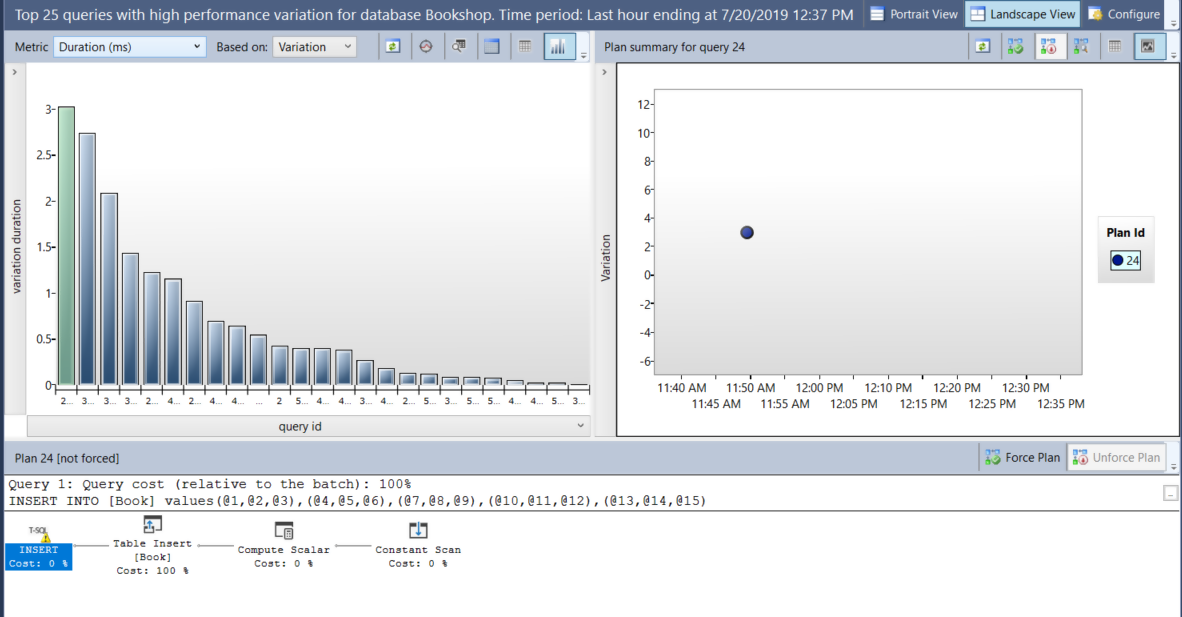
You can hover over the query and see the details of the query.
您可以将鼠标悬停在查询上并查看查询的详细信息。
查询等待统计 (Query Wait Statistics)
Query wait statistics contain information about how long a query had to wait because of different bottlenecks, before it gained access to the required database resources. The following figure contains a screenshot of query wait statistics.
查询等待统计信息包含有关在获得对所需数据库资源的访问权限之前由于不同瓶颈而必须等待多长时间的信息。 下图包含查询等待统计信息的屏幕快照。
Finally, “Tracked Queries” contains the queries that we have been tracking. If you want to keep track of any particular query, you can just add that query to tracked query and it will show up in tracked queries.
最后,“跟踪查询”包含我们一直在跟踪的查询。 如果要跟踪任何特定查询,只需将该查询添加到跟踪查询中,它将显示在跟踪查询中。
If you wish to learn more on Query Store in SQL Server, I would recommend going through these articles, SQL Server Query Store – Overview and Use cases for Query Store in SQL Server.
如果您想了解有关SQL Server中查询存储的更多信息,建议阅读以下文章: SQL Server查询存储– SQL Server中查询存储的概述和用例 。
结论 (Conclusion)
In this article, we saw how to enable SQL Server Query Store that can be used for the performance monitoring of SQL Server queries. We also saw different types of reports offered by the SQL Server Query Store.
在本文中,我们看到了如何启用可用于SQL Server查询性能监视SQL Server查询存储。 我们还看到了SQL Server查询存储提供的不同类型的报告。
本的其他精彩文章 (Other great articles from Ben)
| Understanding SQL Server case statement |
| How to use window functions |
| What is the Difference Between Clustered and Non-clustered Indexes? |
| 了解SQL Server的案例声明 |
| 如何使用视窗功能 |
| 聚集索引和非聚集索引有什么区别? |
翻译自: https://www.sqlshack.com/performance-monitoring-via-sql-server-query-store/


 1714
1714

 被折叠的 条评论
为什么被折叠?
被折叠的 条评论
为什么被折叠?
 到【灌水乐园】发言


