


In this article, we will be discussing measuring Accuracy in Data Mining in SQL Server. We have discussed all the Data mining techniques that are available in SQL Server in a series of articles. The discussed techniques were Naïve Bayes, Decision Trees, Time Series, Association Rules, Clustering, Linear Regression, Neural Network, Sequence Clustering. Data mining is a predicting technique using the existing pattern. It is obvious that we won’t be able to predict 100% accurately. However, since we are using data mining outcomes for better business decisions, the result should have better accuracy. If the accuracy is very low, we tend not to use those data mining models. Therefore, it is essential to find out how accurate your data mining models are.
在本文中,我们将讨论在SQL Server中测量数据挖掘的准确性。 我们在一系列文章中讨论了SQL Server中可用的所有数据挖掘技术。 讨论的技术是朴素贝叶斯 , 决策树 , 时间序列 , 关联规则 , 聚类 , 线性回归 , 神经网络 , 序列聚类 。 数据挖掘是一种使用现有模式的预测技术。 显然,我们将无法准确地预测100%。 但是,由于我们将数据挖掘结果用于更好的业务决策,因此结果应具有更高的准确性。 如果准确性非常低,我们倾向于不使用那些数据挖掘模型。 因此,找出数据挖掘模型的准确性至关重要。
分类模型的准确性 (Accuracy in Classification Models)
Out of the nine data mining models in SQL Server, three of them can be considered as classification models. The Classification models are Naïve Bayes Decision Trees, Neural Network. Though the logistic regression is a regression technique, that can be used for a classification problem as well. Since you have four models as a solution for the classification problem, we need to look at which algorithm should be selected to use. Obviously, you need to select the most accurate data mining model. To evaluate which algorithm to use, an accuracy test should be done.
在SQL Server的9种数据挖掘模型中,其中3种可以视为分类模型。 分类模型是朴素贝叶斯决策树,神经网络。 尽管逻辑回归是一种回归技术,但它也可以用于分类问题。 由于您有四个模型作为分类问题的解决方案,因此我们需要查看应选择使用哪种算法。 显然,您需要选择最准确的数据挖掘模型。 为了评估使用哪种算法,应该进行准确性测试。
Let us create simple four models using Naïve Bayes, Decision Trees, Logistic Regression, and Neural Network algorithms for measuring Accuracy in Data Mining.
让我们使用朴素贝叶斯,决策树,逻辑回归和神经网络算法创建简单的四个模型,以测量数据挖掘的准确性。
设置数据挖掘项目 (Setting up the Data Mining Project)
First, as we did during the previous article, we need to create a connection to the database, AdventureWorksDW after creating an SSAS project using SQL Server Data Tools.
首先,就像在上一篇文章中所做的那样,在使用SQL Server数据工具创建SSAS项目之后,我们需要创建到数据库AdventureWorksDW的连接。
Next, we need to create the data source view and we need to add, vTargetMail view to the data source view.
接下来,我们需要创建数据源视图,并且需要将vTargetMail视图添加到数据源视图。
Then, we will be creating a mining model choosing the Decision Tree algorithm and we will add the rest of the three algorithms later.
然后,我们将选择“决策树”算法来创建挖掘模型,稍后再添加这三种算法的其余部分。
During the Data Mining project creation, Create a Testing Data Set is an important option for accuracy. This screen was ignored in the previous articles but it plays an important role during the Accuracy Measuring in data mining.
在数据挖掘项目创建期间,创建测试数据集是提高准确性的重要选项。 该屏幕在以前的文章中被忽略,但是在数据挖掘的准确性测量中扮演着重要的角色。
During the model building, we need two data sets. One is to train and the other is to test data set. The Train set will be used to build the model and the test data set will be used to evaluate the built model. This test data set will be used to measure the accuracy and other matrices.
在模型构建期间,我们需要两个数据集。 一种是训练,另一种是测试数据集。 训练集将用于构建模型,测试数据集将用于评估构建的模型。 该测试数据集将用于测量准确性和其他矩阵。
In the following screenshot, allow selecting data volume to the test data set.
在以下屏幕截图中,允许选择测试数据集的数据量。
There are two options to create a test data set. The first option is to define the percentage value for the test data set. Apart from the percentage setting, there is an option to set the number of cases for the test data set. If both values are specified in the above screen, both limits are enforced.
有两个选项可以创建测试数据集。 第一种选择是定义测试数据集的百分比值。 除了百分比设置外,还有一个选项可以设置测试数据集的案例数。 如果在以上屏幕中指定了两个值,则将同时执行两个限制。
Typically, this is set to 30% meaning that 70% of data will be used to build the model while 30% is used to evaluate the model.
通常,将其设置为30%,这意味着70%的数据将用于构建模型,而30%的数据用于评估模型。
After one model is built, the rest of the techniques are added to the data mining model and the final model can be viewed as the following screenshot.
构建一个模型后,将其余技术添加到数据挖掘模型中,最终模型可以如下图所示。
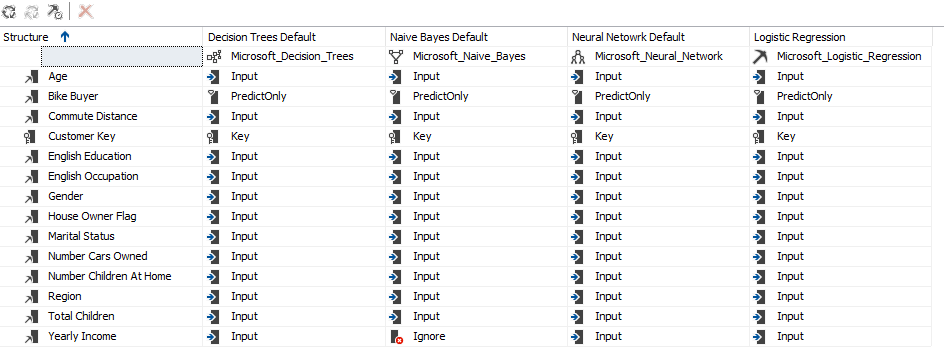
Since Yearly Income is a continuous variable, Microsoft Naïve Bayes has ignored that input variable as Microsoft naïve Bayes can have only discrete inputs. Apart from that ignored variable exception, everything else is the same across all the four algorithms.
由于年收入是一个连续变量,因此Microsoft朴素贝叶斯忽略了该输入变量,因为Microsoft朴素贝叶斯只能具有离散输入。 除了被忽略的变量异常之外,所有这四种算法的其他所有方面都是相同的。
Next, we will look at the Mining Accuracy Chart.
接下来,我们将查看“采矿精度图”。
采矿精度图 (Mining Accuracy Chart)
In the previous articles, we looked at Mining Structure, Mining Models, Mining Model Viewer and Mining Model Predictions tabs. The only tab we have not discussed so far is the Mining Accuracy Chart tab. With this article, we will discuss the Mining Accuracy Chart tab in detail as accuracy Measuring in Data Mining.
在之前的文章中,我们研究了“挖掘结构”,“挖掘模型”,“挖掘模型查看器”和“挖掘模型预测”选项卡。 到目前为止,我们尚未讨论的唯一选项卡是“采矿精度图表”选项卡。 在本文中,我们将详细讨论“挖掘准确性图表”选项卡,作为数据挖掘中的准确性度量。
In the Input Selection, you can choose which models to evaluate. Since we used these models to predict Bike Buyer, Predictable Column Name is Bike Buyer and the Predict value is 1.
在输入选择中,您可以选择要评估的模型。 由于我们使用这些模型来预测“自行车购买者”,因此“可预测列名称”为“自行车购买者”,“预测”值为1。
Next is to choose, test data for the Accuracy Chart. The first two options allow selecting the randomly selected test data set. However, you have the option of choosing a different data set for the evaluation purposes by using the Specify a different data set. In this option, you can create a filter expression as well. Let us assume that you need to test the built model for the customers with age over 40 years. You will not be able to do this by using any of the first two options. In the third option, you can select the data set and set the filter so that the evaluation is done only for the filtered data set.
接下来是选择精度图表的测试数据。 前两个选项允许选择随机选择的测试数据集。 但是,您可以通过使用“指定其他数据集”来选择其他数据集以进行评估。 在此选项中,您也可以创建一个过滤器表达式。 让我们假设您需要为40岁以上的客户测试构建的模型。 使用前两个选项中的任何一个都将无法执行此操作。 在第三个选项中,可以选择数据集并设置过滤器,以便仅对过滤后的数据集进行评估。
提升图 (Lift Chart)
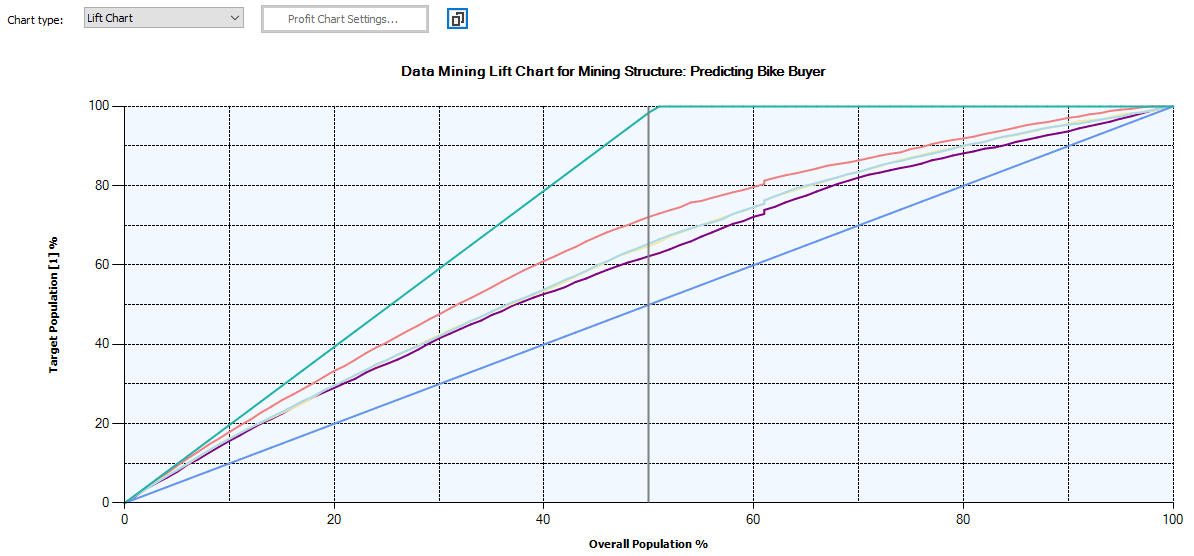
A life chart will be used to evaluate the effectiveness of different data mining models. Following are the lift charts for different four models, random model, and the ideal model.
寿命图将用于评估不同数据挖掘模型的有效性。 以下是不同四种模型,随机模型和理想模型的提升图。
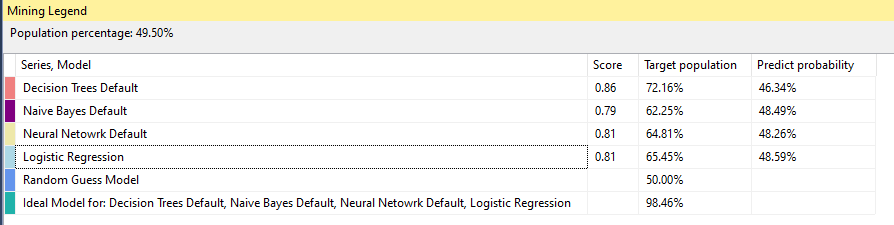
The following screenshot is the legend for the above chart.
以下屏幕截图是上述图表的图例。
Since Neural Network and Logistic Regression have similar results, it is difficult to distinguish them in the chart.
由于神经网络和逻辑回归具有相似的结果,因此很难在图表中区分它们。
The random model is 50% as we have two probable, buying a bike or not. If we do not use any data mining models, random is the model that will be automatically selected. Out of the four models, the best model is the model which is close to the Ideal model or the model which is away from the random models. This means that the best model for the above data set is Decision Trees. Logistic Regression, Neural Network and Naïve Bayes models are other models in the order of the effectiveness.
随机模型是50%,因为我们有两种可能,是否购买自行车。 如果我们不使用任何数据挖掘模型,那么random是将被自动选择的模型。 在这四个模型中,最好的模型是接近理想模型的模型或远离随机模型的模型。 这意味着上述数据集的最佳模型是决策树。 按有效性的顺序,Logistic回归,神经网络和朴素贝叶斯模型是其他模型。
利润图 (Profit Chart)
The Profit chart is somewhat unique in Microsoft tools. We use data mining to maximize profit.
利润图表在Microsoft工具中有些独特。 我们使用数据挖掘来最大化利润。
Let us assume, we are looking at a promotion to improve the bike buyers. For a marketing campaign, there are four parameters, population. Fixed Cost, Individual cost and the expected revenue. Those parameters can be entered in the following screen. This is available after the selection of the Profit Chart.
让我们假设,我们正在寻找一种促进自行车购买者的促销活动。 对于营销活动,有四个参数,人口。 固定成本,个人成本和预期收入。 这些参数可以在以下屏幕中输入。 选择利润图后,此功能可用。
After the above data was entered, the following Profit chart can be observed.
输入以上数据后,可以观察以下利润图。
Even the profit chart indicates that the Decision Tree algorithm is better than other techniques. In the decision tree, 45% of the population would make the maximum profit of 3,500 $. This means it is better to target only 45% of possible buyers who have the highest probability of buying. It is important to choose the correct parameters for the profit chart.
甚至利润图也表明,决策树算法比其他技术要好。 在决策树中,45%的人口将获得3500美元的最大利润。 这意味着最好只针对45%的具有最高购买可能性的买家。 为利润图选择正确的参数很重要。
分类矩阵 (Classification Matrix)
Most of the time, the Classification Matrix is known as the Confusion Matrix. This is the most common matrix used to evaluate the effectiveness of the data mining models.
大多数时候,分类矩阵被称为混淆矩阵。 这是用于评估数据挖掘模型有效性的最常用矩阵。
Let us look at the Decision tree classification matrix. In that model, there are 2023 cases where are actually not bike buyers and those are predicted as same. Similarly, there are 2024 actual bike buyers and which are predicted the same. Those are correct predictions. However, there are 706 cases which actually are not bike buyers but the decision tree model predicted them as possible bike buyers. 792 cases are another way around.
让我们看一下决策树分类矩阵。 在该模型中,有2023个案例实际上不是自行车购买者,并且被预测为相同。 同样,有2024个实际的自行车购买者,并且预测的数目相同。 这些是正确的预测。 但是,有706个案例实际上不是自行车购买者,但决策树模型预测它们可能是自行车购买者。 792例是另一回事。
However, there are few other parameters that are derived from the above classification matrix. The above values are defined as follows.
但是,从上述分类矩阵中得出的其他参数很少。 上述值定义如下。
| Predicted | 0 (Actual) | 1 (Actual) |
| 0 | True Negative (TN) | False Negative (FN) |
| 1 | False Positive (FP) | True Positive (TP) |
预料到的 | 0(实际) | 1(实际) |
0 | 真负(TN) | 假阴性(FN) |
1个 | 误报(FP) | 真正(TP) |
The following are the basic measures that can be derived from the classification matrix.
以下是可以从分类矩阵中得出的基本度量。
| Measure | Formula | Description |
| Accuracy |
| What is the percentage of correct predictions? |
| Precision | Percentage of the correct cases out of the selected cases | |
| Recall |
| Percentage of the correct cases out of the actual correct cases. |
| F1 Score | Harmonic means of Precision and Recall | |
| Matthews correlation coefficient (MCC) |
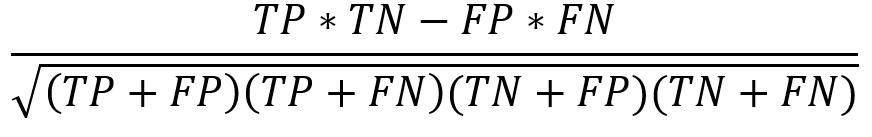
| Balanced measure even if the class sizes are different. |
测量 | 式 | 描述 |
准确性 | 正确预测的百分比是多少? | |
精确 |
| 所选案例中正确案例的百分比 |
召回 | 正确案例中正确案例所占的百分比。 | |
F1分数 |
| 调和与调和的谐波手段 |
马修斯相关系数(MCC) | 即使班级人数不同,也要保持平衡。 |
Let us look at different evaluation parameters for the different algorithms.
让我们看看针对不同算法的不同评估参数。
| Accuracy | Precision | Recall | F1 Score | MCC | |
| Decision Tree | 72.98 | 74.14 | 71.88 | 72.99 | 45.30 |
| Naïve Bayes | 63.07 | 64.31 | 61.29 | 62.76 | 25.58 |
| Neural Network | 65.37 | 67.60 | 61.12 | 64.19 | 29.46 |
| Logistic Regression | 65.63 | 67.73 | 61.72 | 64.59 | 30.03 |
准确性 | 精确 | 召回 | F1分数 | 我的客户中心 | |
决策树 | 72.98 | 74.14 | 71.88 | 72.99 | 45.30 |
朴素贝叶斯 | 63.07 | 64.31 | 61.29 | 62.76 | 25.58 |
神经网络 | 65.37 | 67.60 | 61.12 | 64.19 | 29.46 |
逻辑回归 | 65.63 | 67.73 | 61.72 | 64.59 | 30.03 |
In most of the tools such as Weka, Azure Machine learning has calculated most of these values but not in SQL Server.
在Weka等大多数工具中,Azure机器学习已计算出其中大多数值,但在SQL Server中却未计算出这些值。
After looking at the above values, from the classification matrices, the decision tree is the best algorithm from the available four. We discussed during our previous articles, that there are different mining model parameters relevant to different algorithms. To verify whether the parameters have improved the model, we can utilize the same techniques.
从分类矩阵看完上述值之后,决策树是可用的四种算法中最好的算法。 在之前的文章中,我们讨论了与不同算法相关的不同挖掘模型参数。 为了验证参数是否改善了模型,我们可以利用相同的技术。
结论 (Conclusion)
Measuring Accuracy in data mining is an important aspect of data Mining. Since there are a few options to choose the necessary algorithms, it is essential to choose what is the best algorithms. In this, a Lift chart can be used as a visual tool to find a better model. Further, the Profit chart will be helpful to find out what is the optimum number of cases that can be chosen. Classification Matrix or the confusion matrix is used to derive various classification accuracy matrices.
数据挖掘中的测量准确性是数据挖掘的重要方面。 由于有几种选择必要算法的选项,因此选择最佳算法至关重要。 在这种情况下,提升图可以用作可视化工具来查找更好的模型。 此外,利润图将有助于找出可以选择的最佳案例数。 分类矩阵或混淆矩阵用于导出各种分类精度矩阵。
目录 (Table of contents)
翻译自: https://www.sqlshack.com/measuring-the-accuracy-in-data-mining-in-sql-server/


 1419
1419

 被折叠的 条评论
为什么被折叠?
被折叠的 条评论
为什么被折叠?
 到【灌水乐园】发言


