


Power BI has a rich set of visuals to represent data according to our requirements. These custom visuals make it easy for us to highlight data effectively to understand and share the data in reports. We have learned many customized visuals so far in ongoing series of Power BI Desktop.
Power BI具有丰富的视觉效果,可以根据我们的要求来表示数据。 这些自定义的视觉效果使我们可以轻松有效地突出显示数据,以理解和共享报告中的数据。 到目前为止,在正在进行的Power BI Desktop系列中,我们已经学习了许多自定义的视觉效果。
In this article, we will explore Enlighten World Flag Slicer visual for Power BI Desktop.
在本文中,我们将探索Power BI Desktop的Enlighten World Flag Slicer视觉效果。
在Power BI桌面中导入Enlighten World Flag Slicer的数据 (Import Data for Enlighten World Flag Slicer in the Power BI Desktop)
Suppose we want to prepare a report to examine the 2018 Asian Games medal table using Power BI Desktop. In the report, Enlighten World Flag Slicer is helpful to visualize the data from the dataset and represent country names with their flags. This represents the country with flags symbol and we can filter out the report for the country just by click on the respective country flag.
假设我们要准备一份报告,以使用Power BI Desktop检查2018年亚运会奖牌表。 在报告中,Enlighten World Flag Slicer有助于可视化数据集中的数据并用其国旗表示国家/地区名称。 这代表带有标志符号的国家,我们只需单击相应的国家标志就可以过滤出该国家的报告。
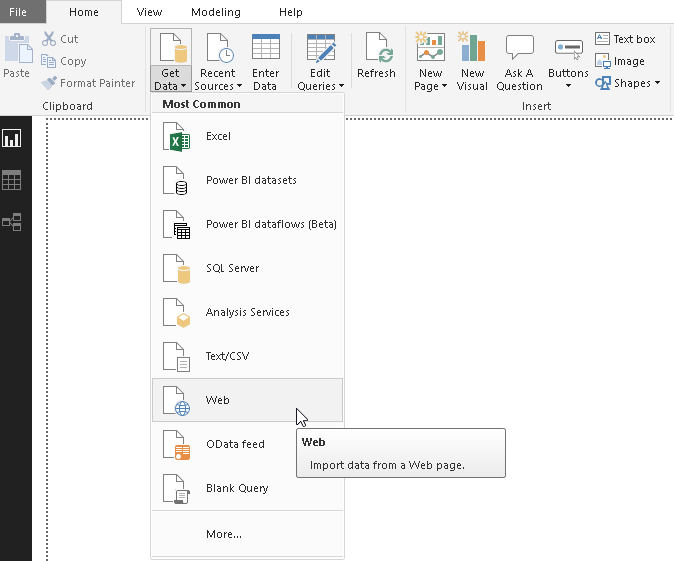
In this article, we will take data from the Wikipedia 2018 Asian Games medal table. In Power BI Desktop, we can directly fetch data from the web data source and prepare chart from it without exporting data into excel or flat file format. Launch the web data source from Get Data -> Web
在本文中,我们将从Wikipedia 2018亚运会奖牌表中获取数据。 在Power BI Desktop中,我们可以直接从Web数据源获取数据并从中准备图表,而无需将数据导出为excel或平面文件格式。 从获取数据-> Web启动Web数据源
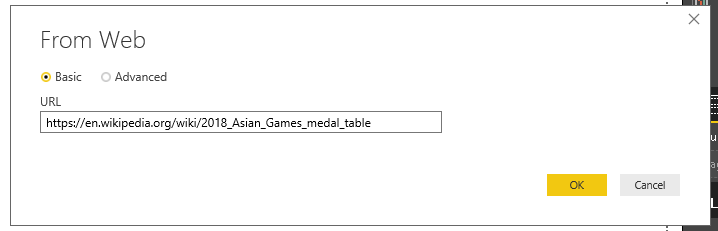
In the basic option, enter the URL of the web page containing data table and click OK.
在基本选项中,输入包含数据表的网页的URL,然后单击“确定”。
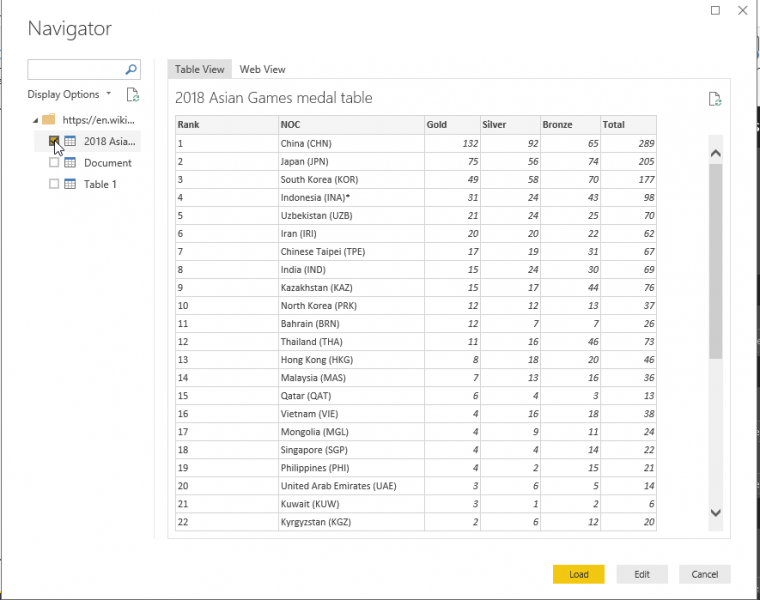
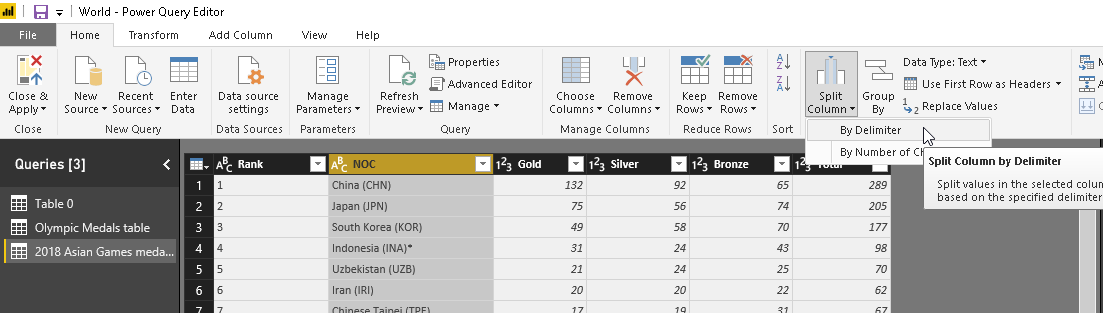
Preview the data. We can see in the column ‘NOC’ country name are shows along with abbreviations, for example, China (CHN). We need to remove the abbreviation so that we can generate the enlighten world flag slicer. To edit the data, click on ‘Edit’
预览数据。 我们可以在“ NOC”列中看到国家名称以及缩写,例如中国(CHN)。 我们需要删除缩写,以便生成启蒙世界标志切片器。 要编辑数据,请单击“编辑”
It opens Power BI editor to make changes in the data.
它会打开Power BI编辑器以对数据进行更改。
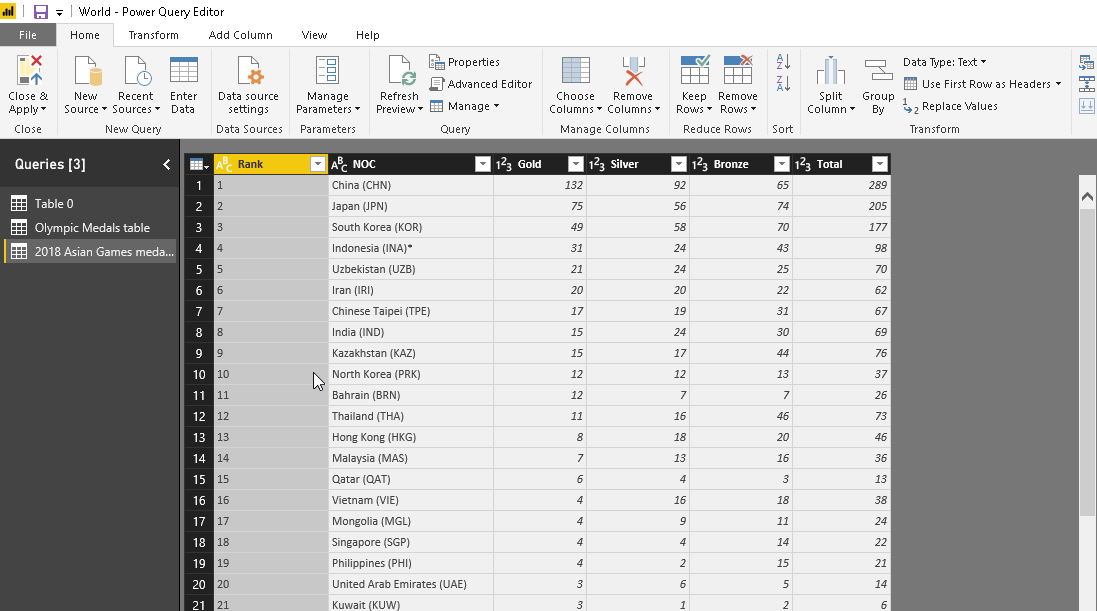
We can split the column to get rid of abbreviations. Click on the ‘Split Column -> By Delimiter’
我们可以拆分该列以除去缩写。 点击“拆分列->按分隔符”
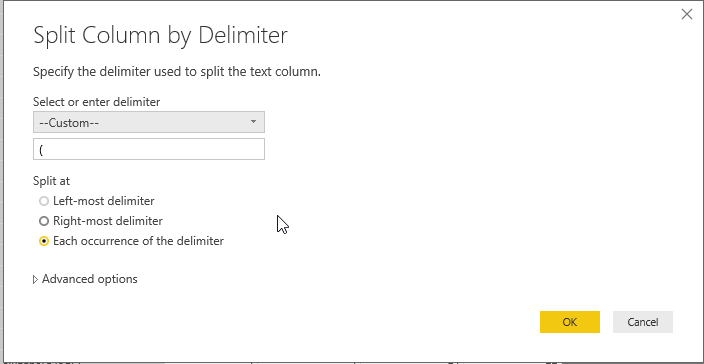
It automatically selects the delimiter. However, we can select or enter delimiter. We can also choose to split at leftmost/rightmost or split at each occurrence of the delimiter. Proceed next by clicking on ‘OK’.
它会自动选择定界符。 但是,我们可以选择或输入定界符。 我们还可以选择在最左边/最右边拆分,或者在每次出现分隔符时拆分。 单击“确定”继续下一步。
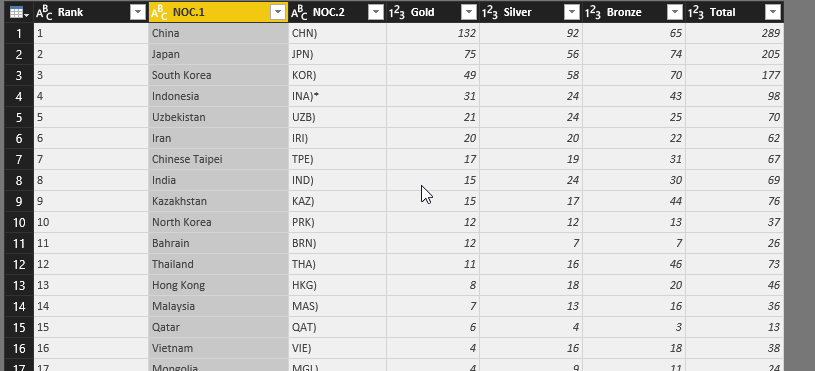
It splits the column based on the delimiter condition specified.
它根据指定的分隔符条件拆分列。
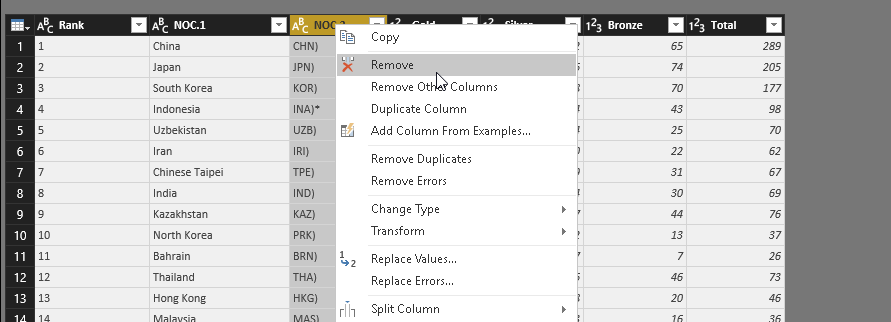
We do not need this column, so right click on the column and remove it.
我们不需要此列,因此右键单击该列并将其删除。
Also, rename the column name from ‘NOC’ to ‘Country’. Close and apply to save changes.
同样,将列名从“ NOC”重命名为“ Country”。 关闭并应用以保存更改。
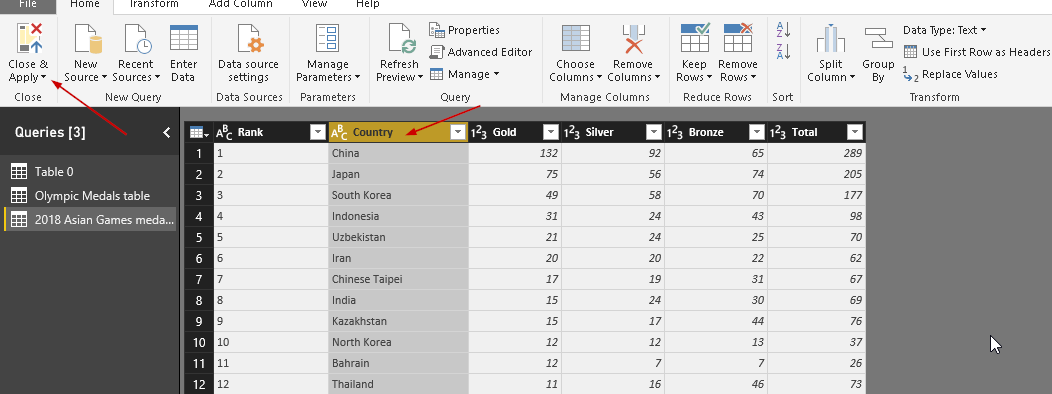
We can see dataset now to prepare visuals as required. Our sample dataset contains a list of countries, and their medals tally (Gold, bronze or silver).
我们现在可以看到数据集,以根据需要准备视觉效果。 我们的样本数据集包含国家列表及其奖牌总数(金,铜或银)。
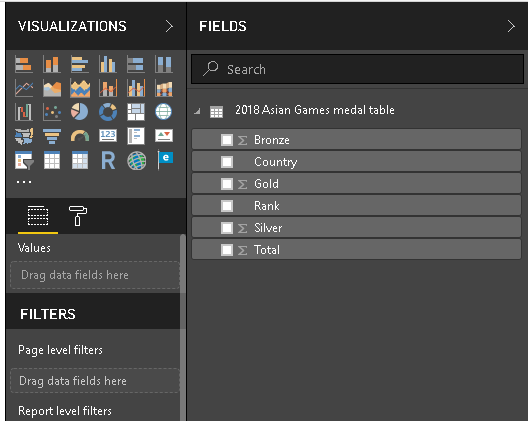
Before we create the enlighten world flag slicer visual, let us create ‘Map’ chart from our data set. Double click on ‘Map’ chart icon as shown and adjust the chart height width in the bottom part of the screen.
在创建启蒙世界标志切片器视觉效果之前,让我们从数据集中创建“地图”图表。 如图所示,双击“地图”图表图标,然后在屏幕底部调整图表高度宽度。
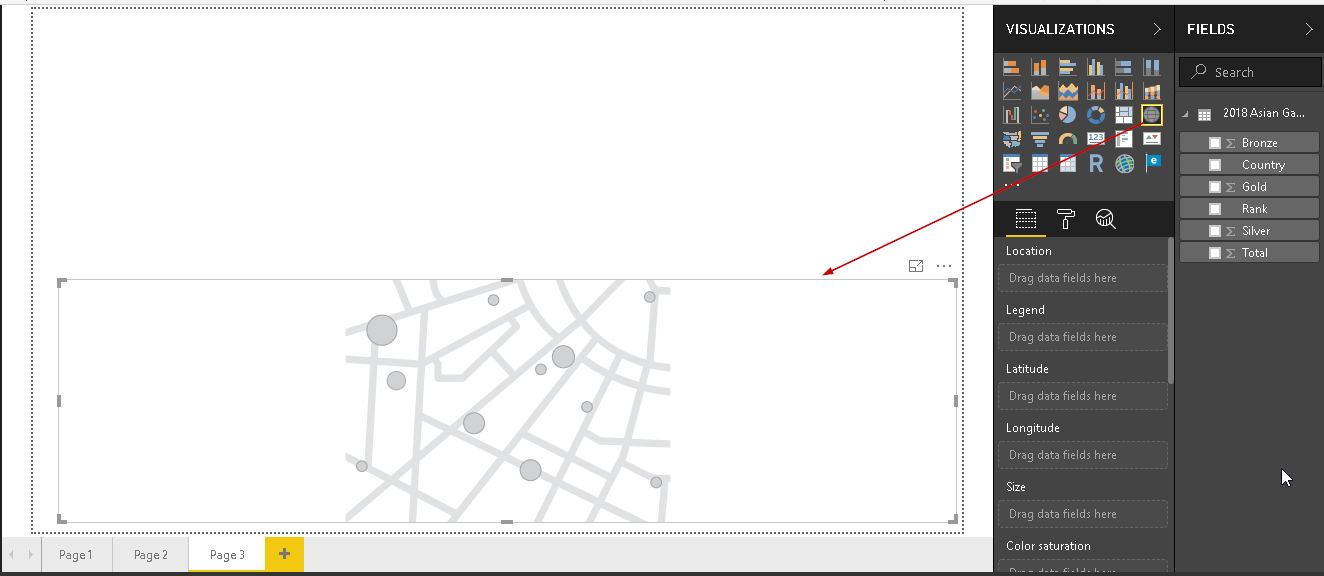
Now, drag the column fields as below
现在,如下拖动列字段
- Location -> Country 位置->国家
- Size -> Total 大小->总计
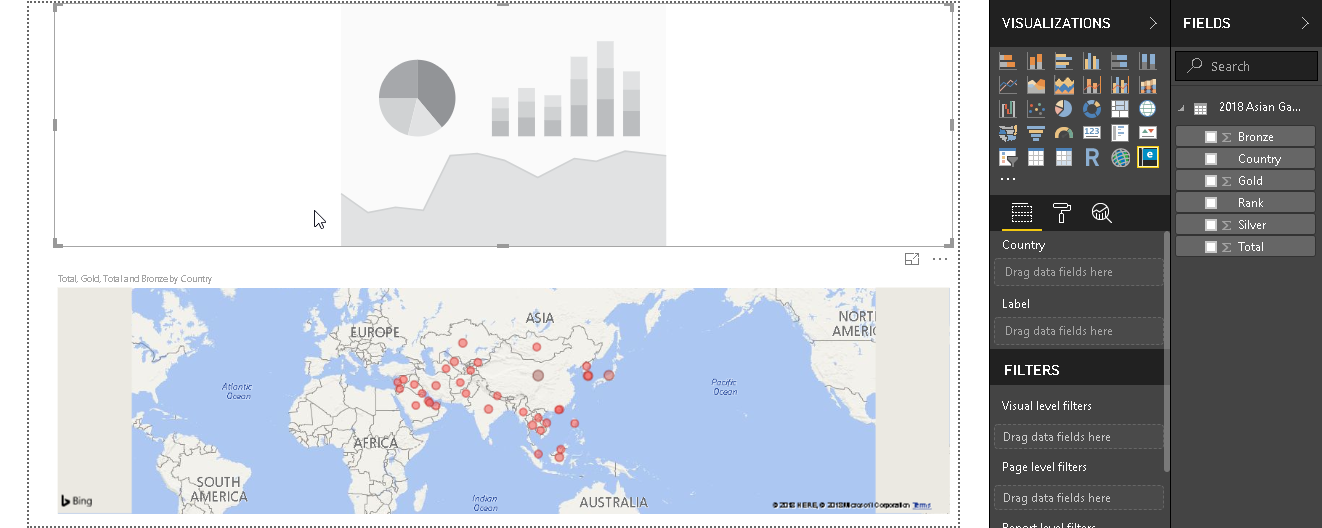
It generates the map chart as shown here. For the countries listed in our data set, it puts a dot to represent the country.
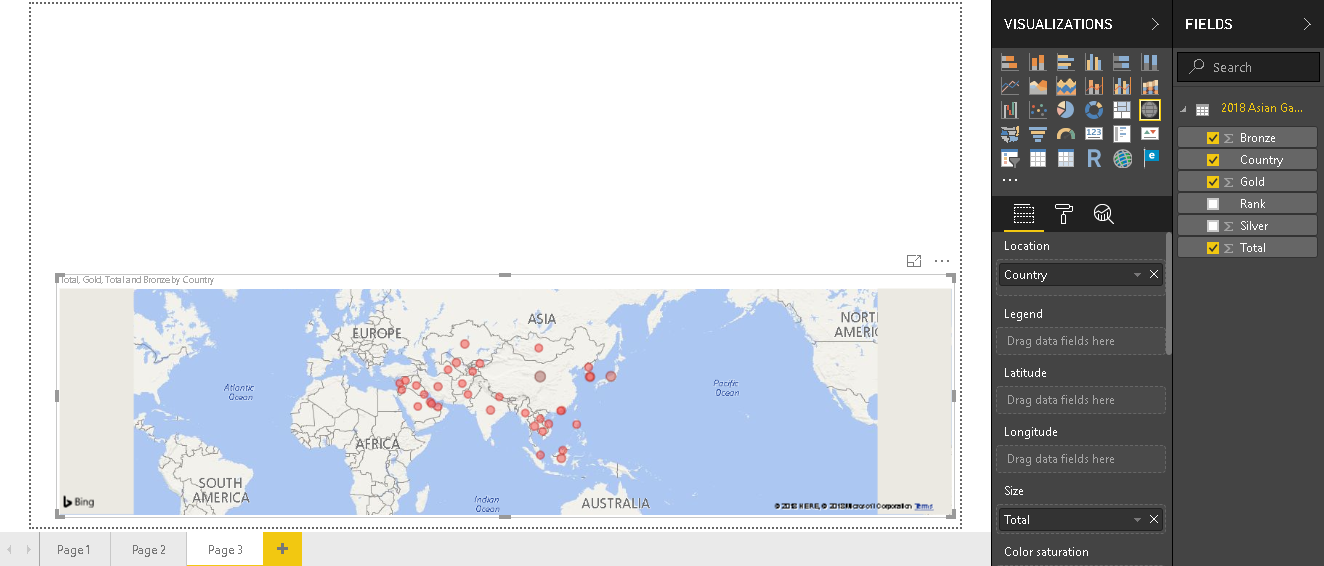
它生成地图,如下所示。 对于我们数据集中列出的国家/地区,它会用一个点表示该国家/地区。
In this chart, data is shown for all countries together. We can get the data for Individual County if we hover the mouse over the dots.
在此图表中,一起显示了所有国家/地区的数据。 如果将鼠标悬停在点上,则可以获取个人县的数据。
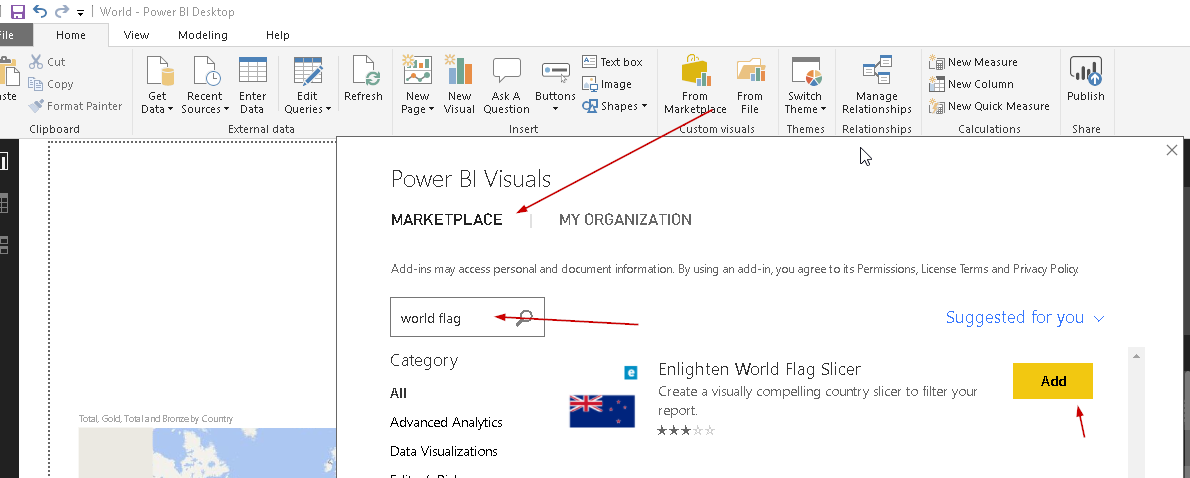
Now, we will import the ‘Enlighten World Flag Slicer’ visual from the Marketplace. Search it and add as shown below.
现在,我们将从市场中导入“ Enlighten World Flag Slicer”视觉效果。 搜索并添加,如下所示。
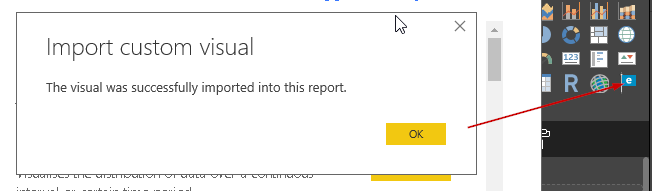
You can see the icon as a flag shape in the visualization area.
您可以在可视化区域中将图标视为标志形状。
Double click on it and adjust the size on the upper side of the blank screen.
双击它,然后在空白屏幕的上方调整大小。
Click on the ‘Enlighten World Flag Slicer’ and select the ‘Country’ from our dataset. It shows the flag of each country listed in our data set.
单击“启发世界国旗切片器”,然后从我们的数据集中选择“国家”。 它显示了我们数据集中列出的每个国家的国旗。
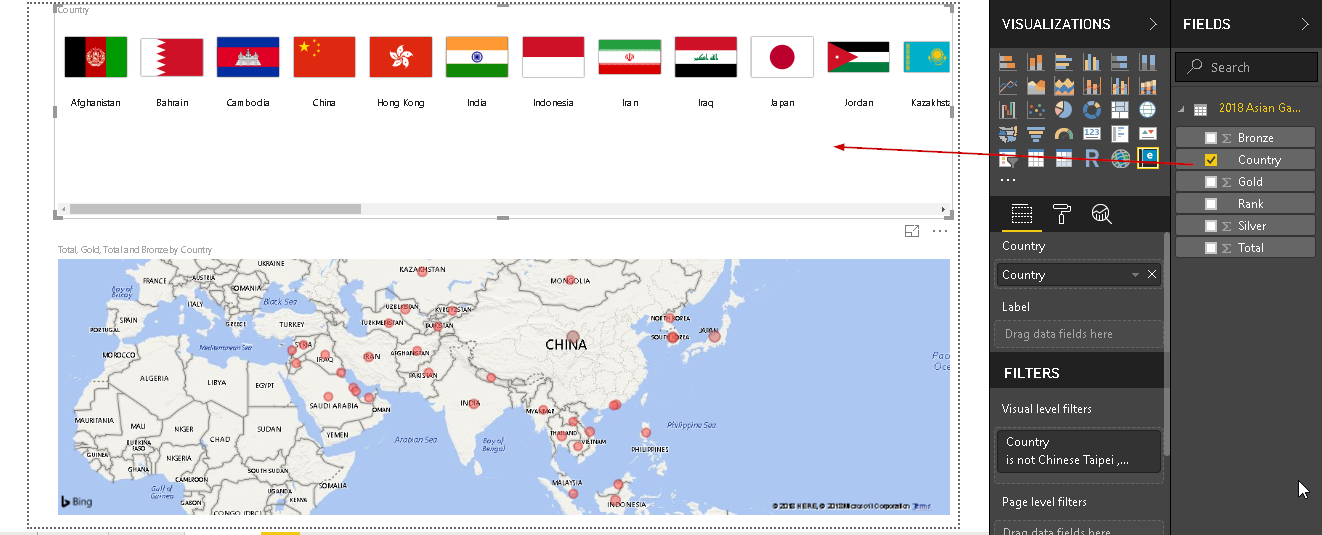
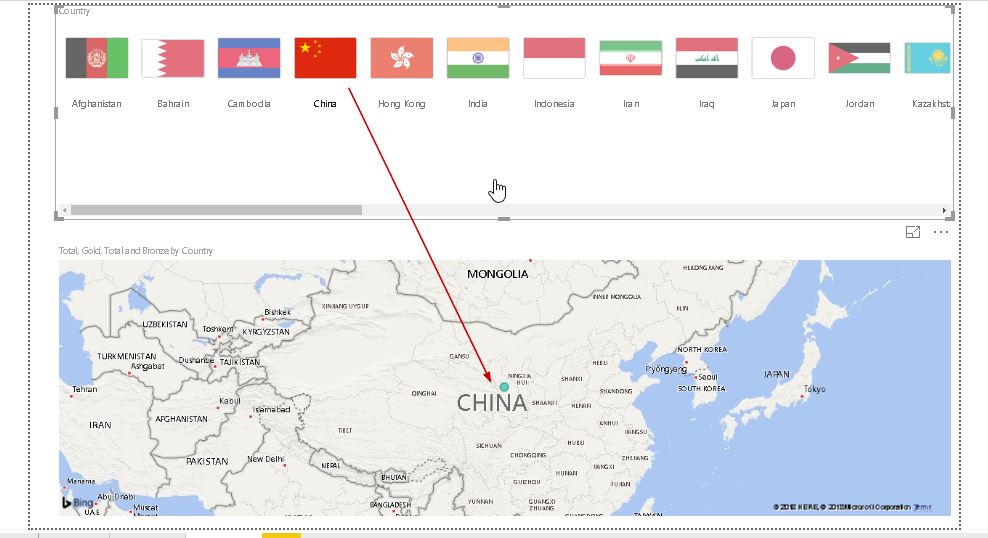
Now, if we click on any particular country, the map auto zooms to that particular country. For example, here I clicked on ‘China’ and you can see in the chart ‘China’ is zoomed in.
现在,如果我们单击任何特定国家,地图将自动缩放到该特定国家。 例如,在这里我单击了“中国”,您可以在图表中看到“中国”已放大。
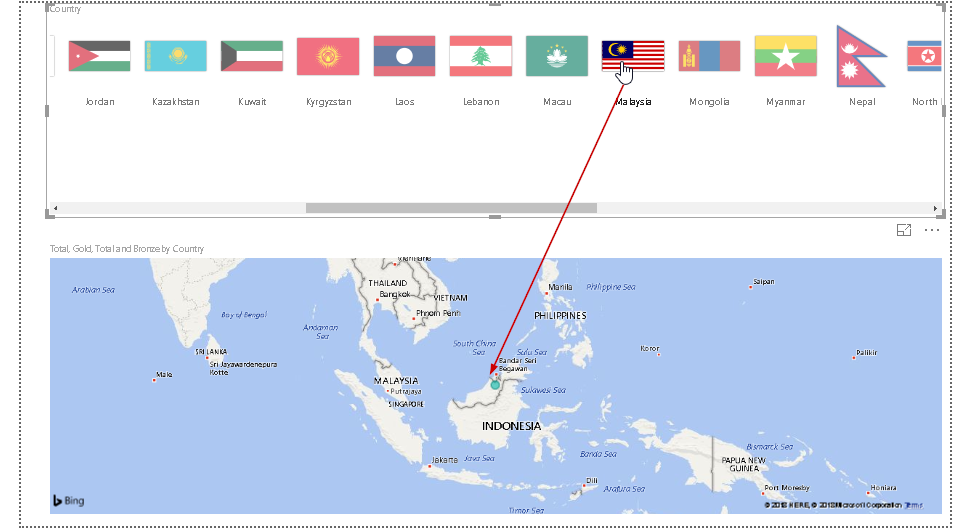
Similarly, let us click on another country say ‘Malaysia’ and map chart is again zoomed on that country.
同样,让我们单击另一个国家,即“马来西亚”,然后地图再次放大该国家。
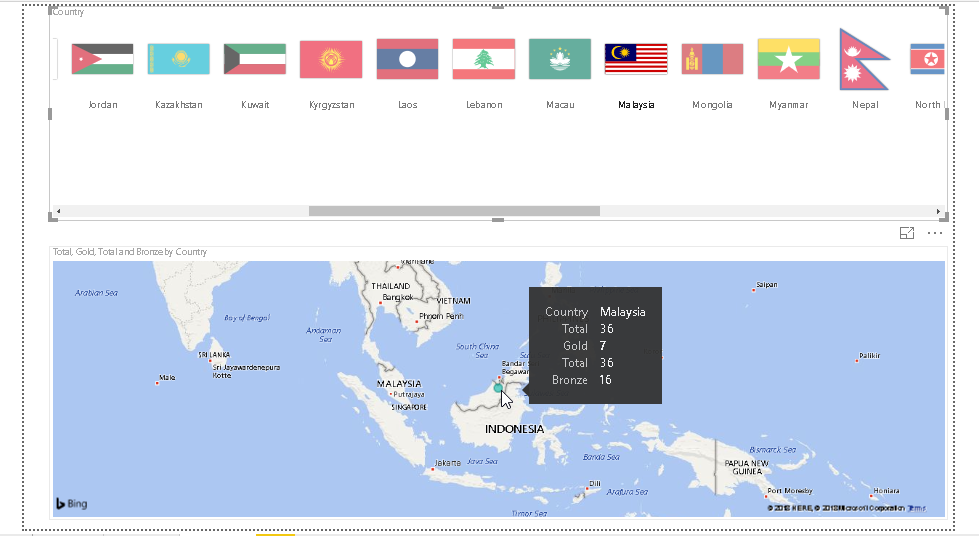
If we hover the mouse over the dot representing country, you can see details of medals won by that particular country. For example, below you can find details of ‘Malaysia’ country medals.
如果将鼠标悬停在代表国家的点上,您会看到该特定国家所赢得的奖牌的详细信息。 例如,下面您可以找到“马来西亚”国家奖牌的详细信息。
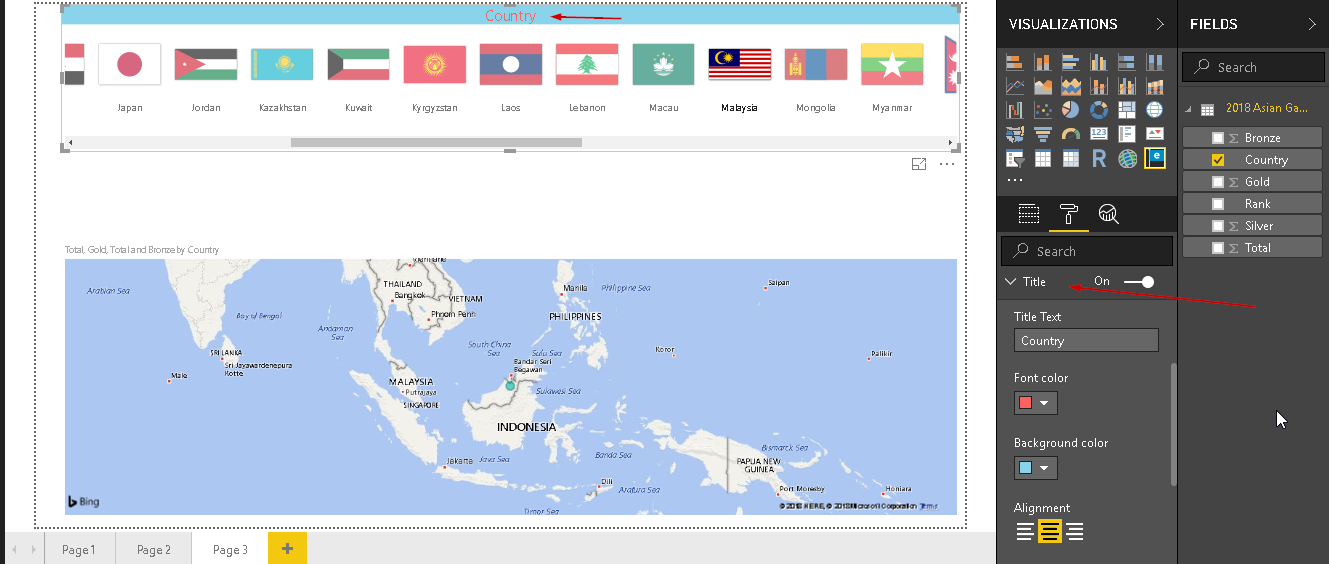
Now, we will do a little bit of formatting for our enlighten world flag slicer visual. In the format area, click on ‘Title’ and modify the title properties such as font color, background, alignment etc. This will provide a better look for our chart title.
现在,我们将对启蒙世界国旗切片器的视觉效果进行一些格式化。 在格式区域中,单击“标题”并修改标题属性,例如字体颜色,背景,对齐方式等。这将为我们的图表标题提供更好的外观。
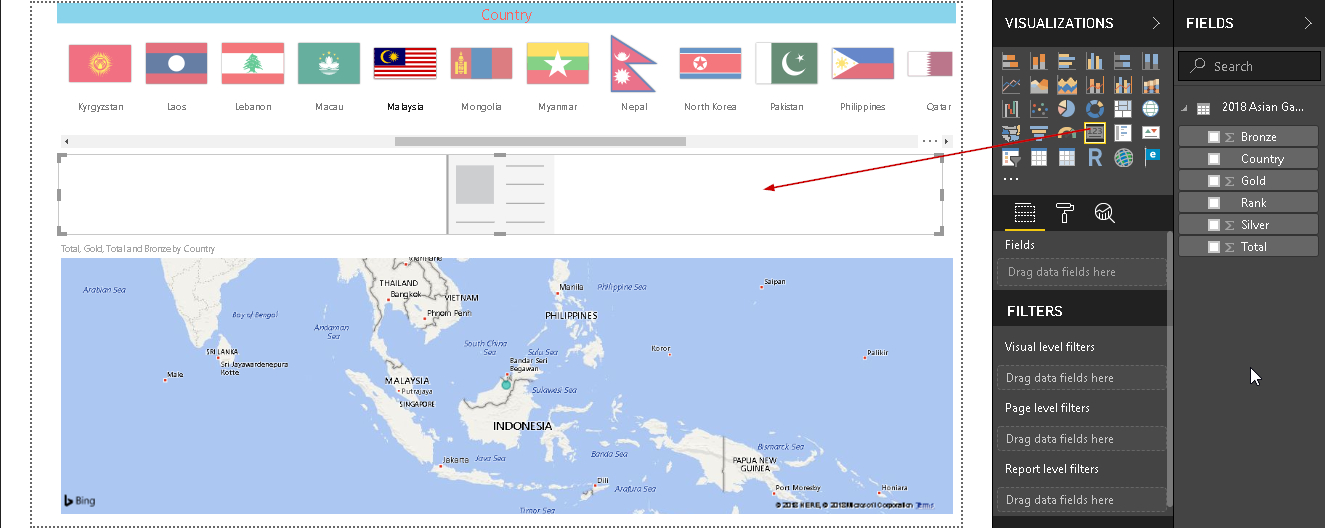
As shown above, when we click on any particular country, map redirects to that country. We cannot find the selected country from the flags since it is not highlighted. Therefore, let us add another chart ‘Card’ into the area.
如上所示,当我们单击任何特定国家时,地图将重定向到该国家。 由于标记未突出显示,因此我们无法从标记中找到所选国家/地区。 因此,让我们在该区域中添加另一个图表“卡”。
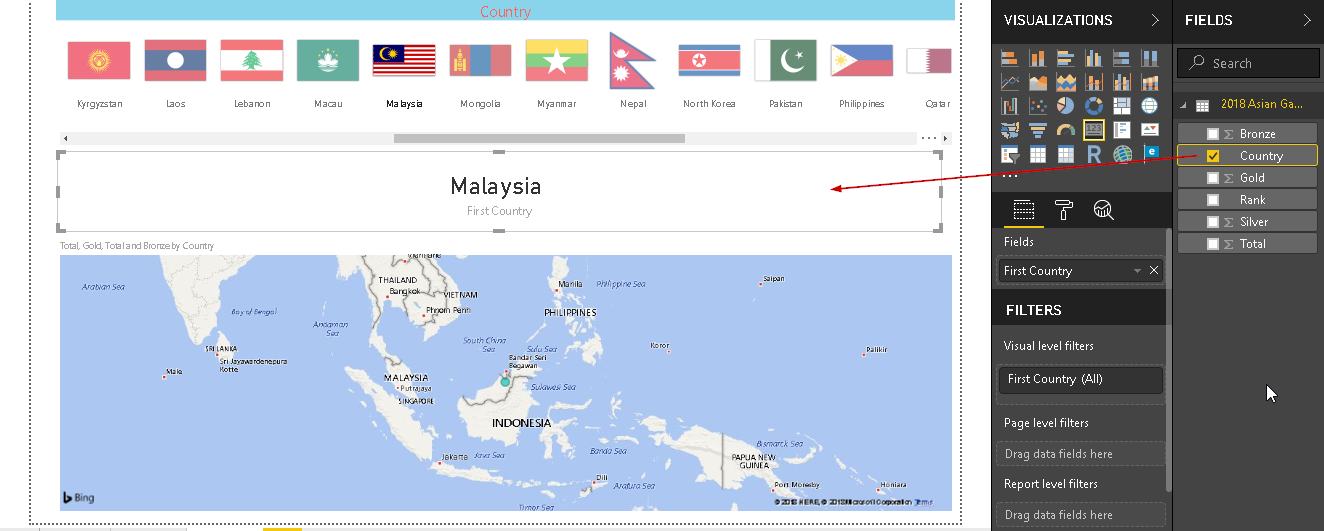
Select the chart and click on a country from the dataset. Now, it will show the name of the country we selected from the flags. For example, below it shows Malaysia.
选择图表,然后从数据集中单击一个国家。 现在,它将显示我们从标志中选择的国家的名称。 例如,下面显示马来西亚。
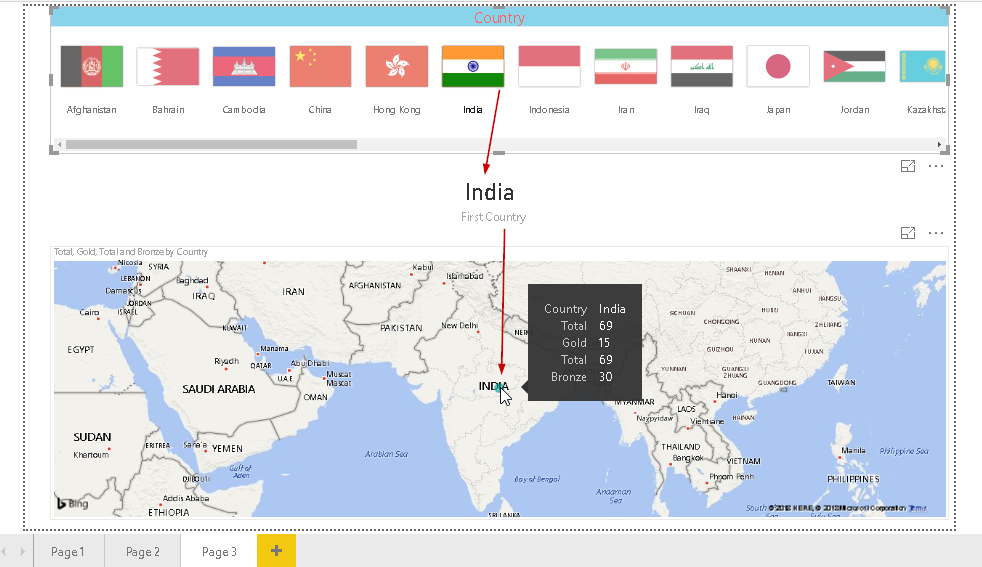
Similarly, below it shows county ‘India’
同样,下面显示的是县“印度”
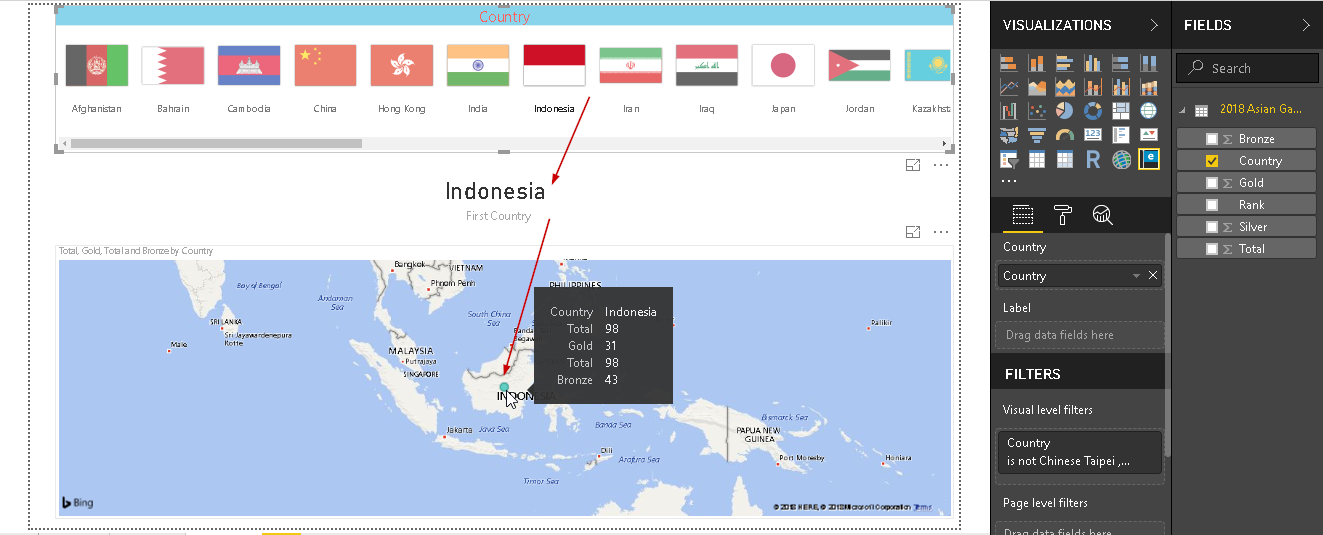
Below we can see Indonesia along with the medals tally for it.
在下面我们可以看到印度尼西亚以及它的奖牌总数。
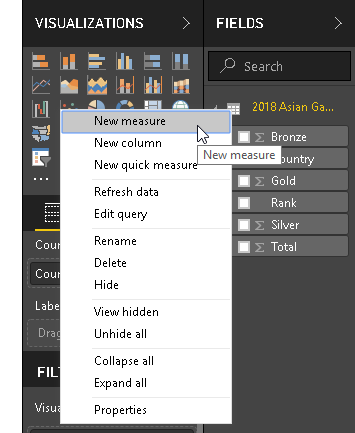
We still have one issue with our report. In the above example, you can notice that whichever country we select, it shows ‘First Country’ below the country name. In order to address this, let us create another ‘Measure’ column in the dataset. Right, click on the dataset and select ‘New Measure’.
我们的报告仍然有一个问题。 在上面的示例中,您会注意到,无论我们选择哪个国家,都会在国家名称下方显示“第一个国家”。 为了解决这个问题,让我们在数据集中创建另一个“度量”列。 右键,单击数据集,然后选择“新度量”。
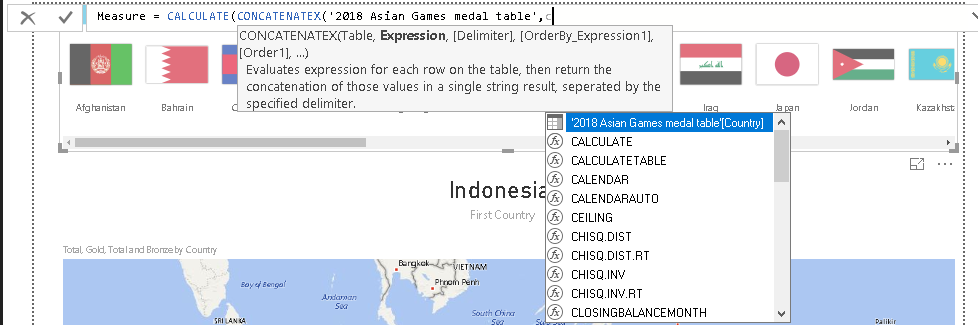
Here, we will use DAX codes to prepare a measured column:
在这里,我们将使用DAX代码准备要测量的列:
- CALCULATE: It evaluates an expression in a context that is modified by the specified filters
- CALCULATE :它在由指定过滤器修改的上下文中计算表达式
- CONCATENATEX: it concatenates the result of an expression evaluated for each row in a table CONCATENATEX :它将表中每一行的表达式结果连接起来
This is interactive to write DAX queries, as soon we write, it guides us with syntax, options.
这是交互式编写DAX查询的方法,一旦我们编写,它将为我们提供语法,选项的指导。
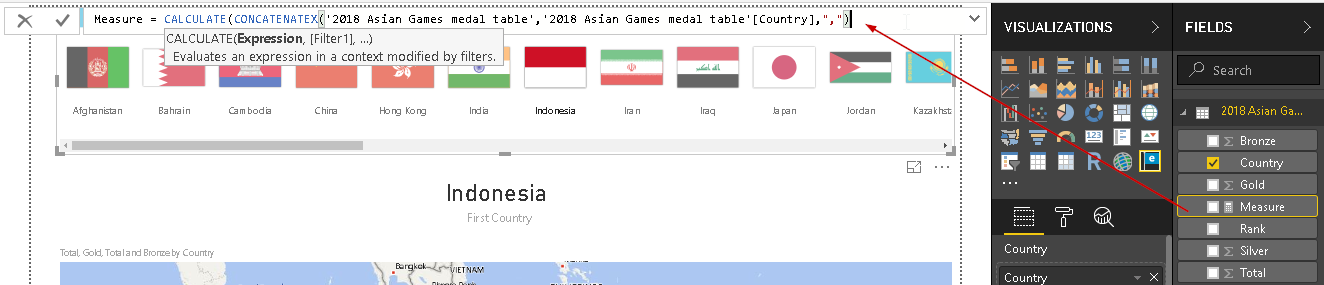
Therefore, the formula for the measured column is as below
因此,被测列的公式如下
Measure = CALCULATE(CONCATENATEX(‘2018 Asian Games medal table’,’2018 Asian Games medal table'[Country],”,”))
度量= CALCULATE(CONCATENATEX('2018亚运会奖牌榜','2018亚运会奖牌榜'[国家],”,”))
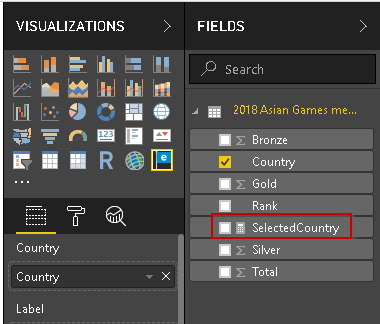
Rename the column from Measure to ‘SelectedCountry’.
将列从度量重命名为“ SelectedCountry”。
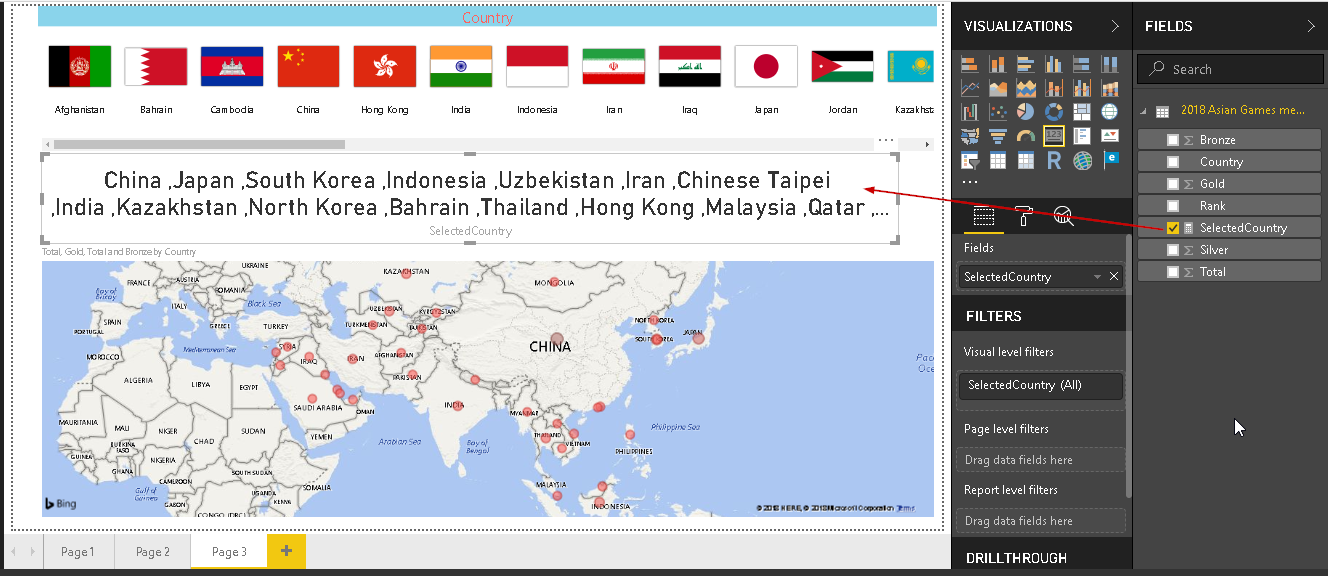
Now, map the ‘Selectedcountry’ column in the chart. It shows all countries name if we do not select the country, else only that particular country name is shown.
现在,在图表中映射“ Selectedcountry”列。 如果不选择国家,它将显示所有国家名称,否则仅显示该特定国家名称。
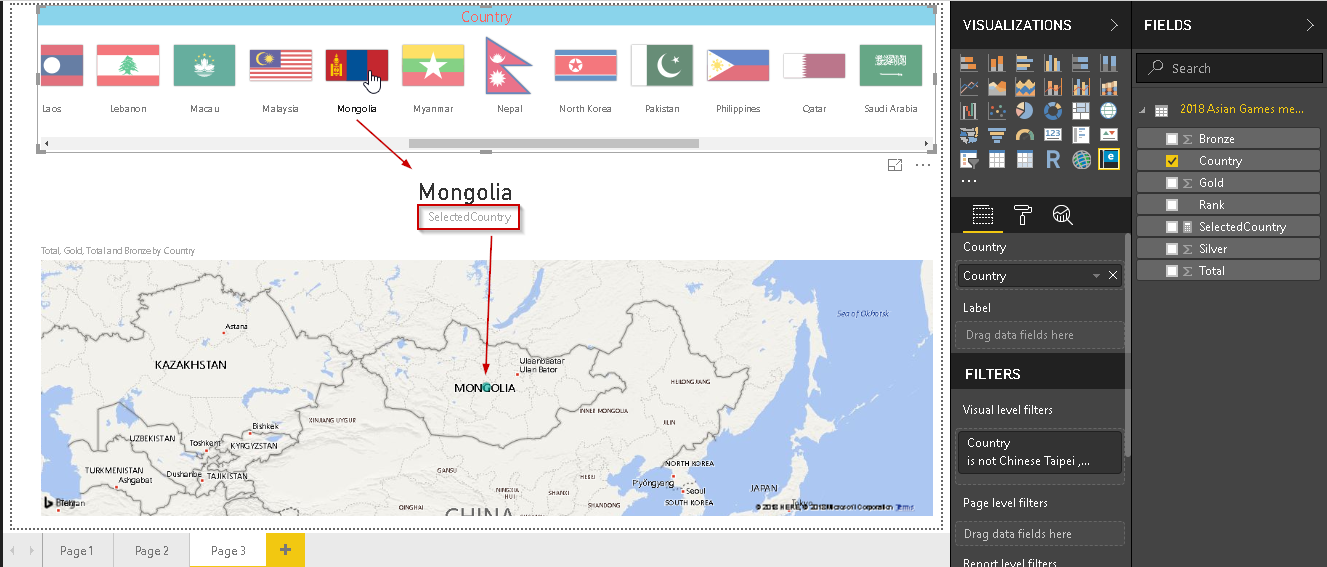
Select any country and we can see that it shows our new column name instead of the first country below the selected country name.
选择任何国家,我们可以看到它显示了我们新的列名,而不是所选国家名下面的第一个国家。
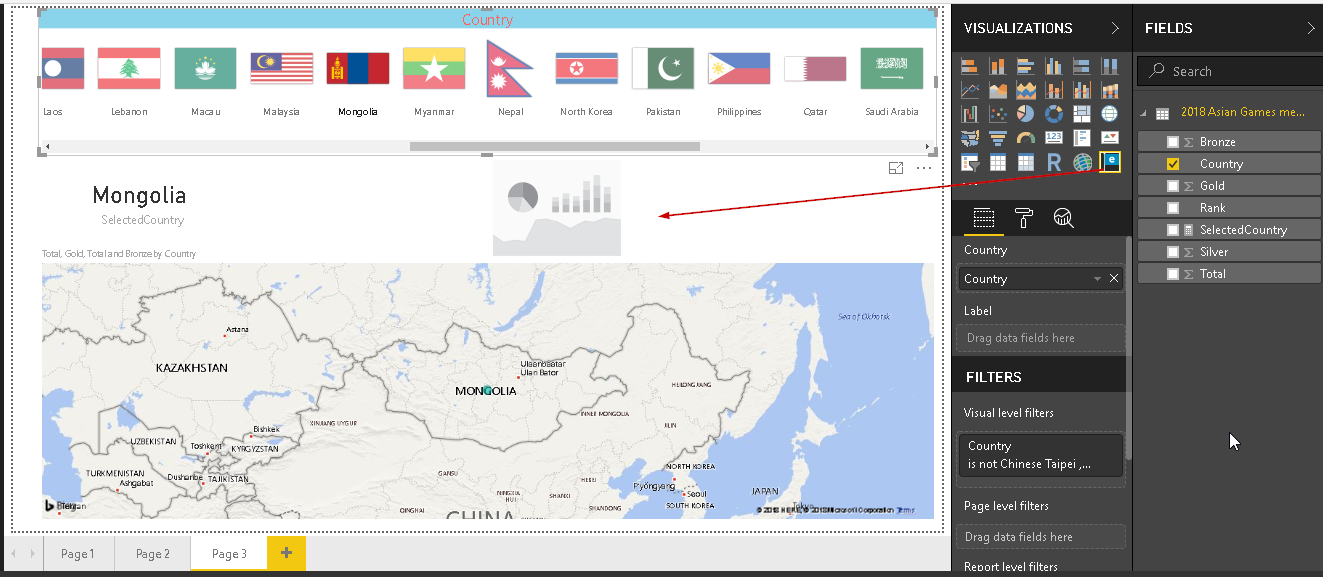
Suppose, we want to filter the records based on top 5 countries. We need to make a separate section and display these top 5 countries flags. Adjust the chart size and insert another enlighten world flag slicer as shown here.
假设我们要根据前5个国家/地区过滤记录。 我们需要单独创建一个部分,并显示前5个国家/地区的标志。 调整图表大小,然后插入另一个启蒙世界标志切片器,如下所示。
In the new enlighten chart, map the column ‘Country’.
在新的启发图中,映射“国家”列。
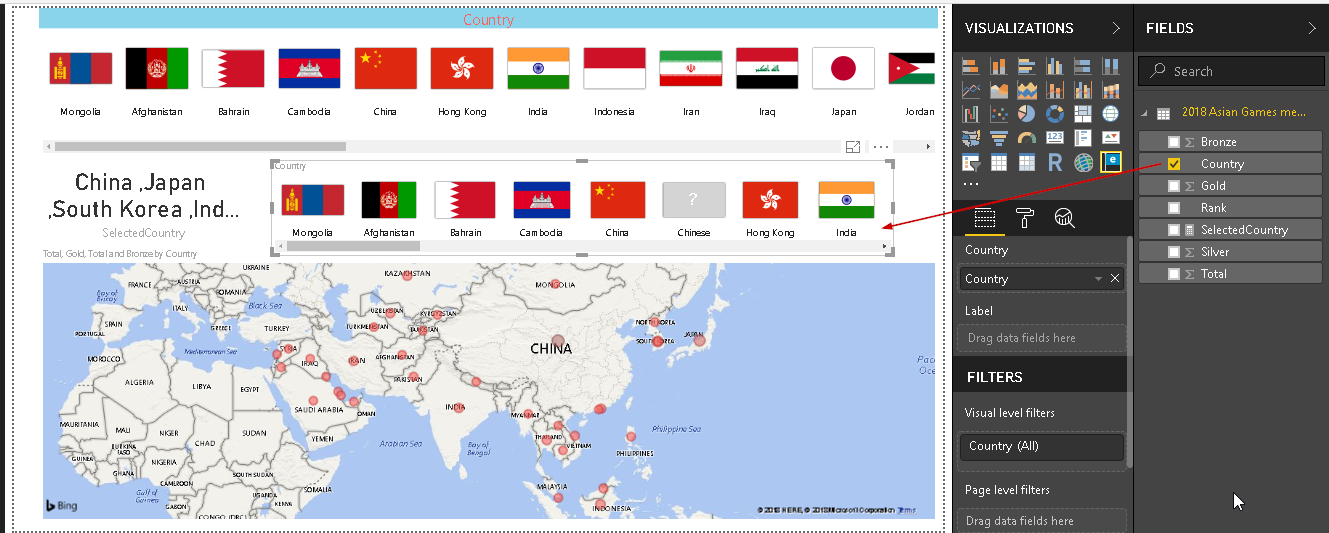
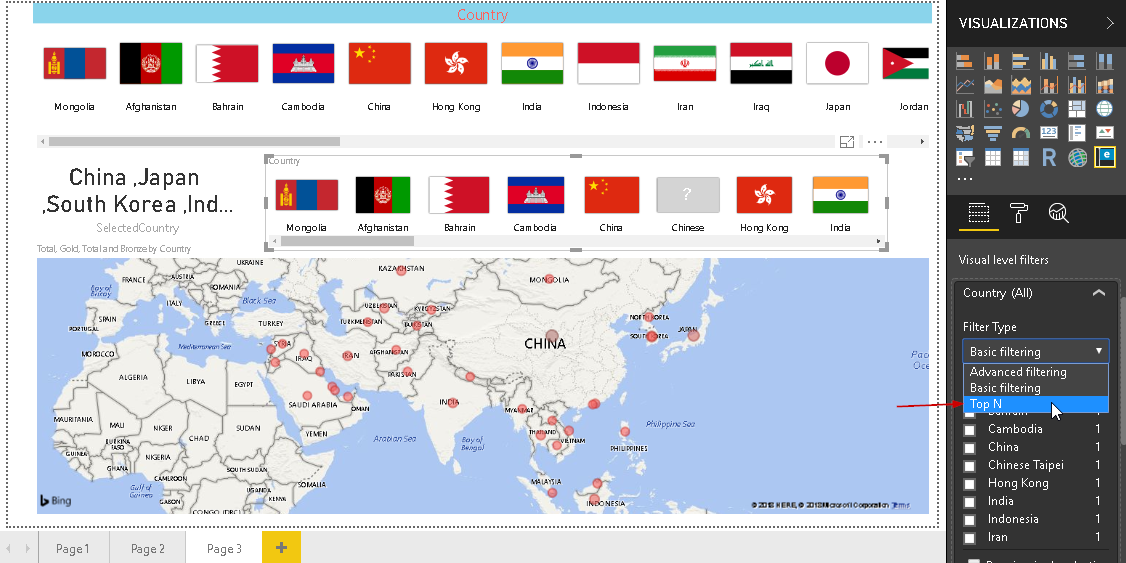
Currently, it is showing all flags in the new enlighten world flag slicer chart. We want to display only the top five countries chart here, so in the ‘Visual level filter’ section, select Top ‘N’.
当前,它在新的启发世界标志切片器图表中显示所有标志。 我们只想在此处显示前五个国家/地区的图表,因此在“可视级别过滤器”部分中,选择“前N个”。
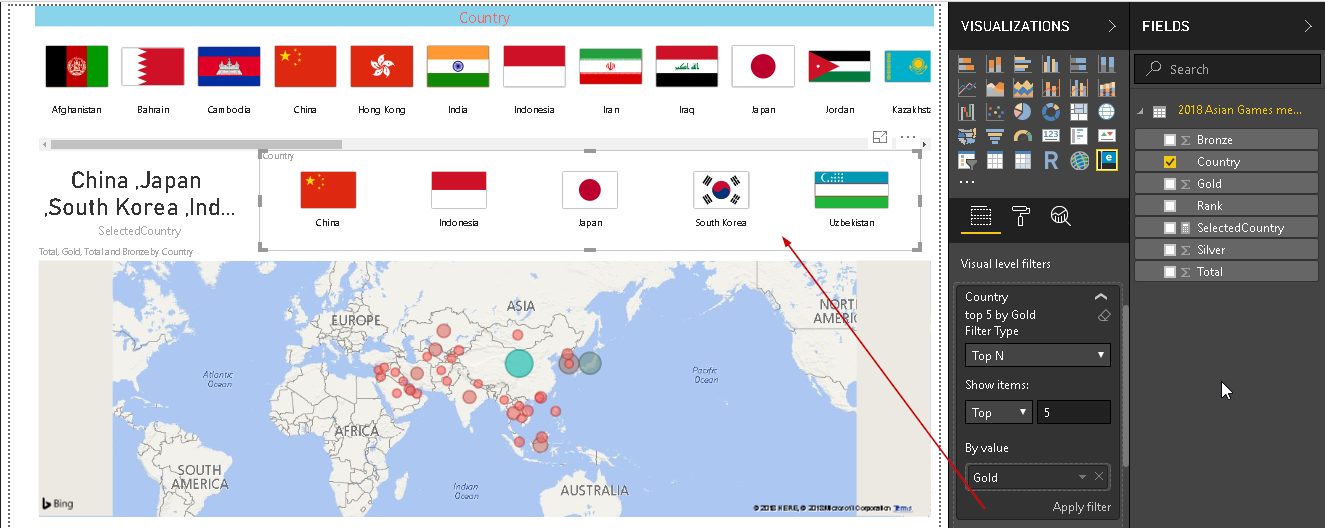
Enter the number of items we want to show. Below this, we can select how to want this filter to apply. For example, in my example, I want to select top countries based on the total number of gold medals. You can see now only top 5 countries flags are displayed.
输入我们要显示的项目数。 在此之下,我们可以选择如何应用此过滤器。 例如,在我的示例中,我想根据金牌总数来选择排名靠前的国家。 您现在可以看到仅显示前5个国家/地区的标志。
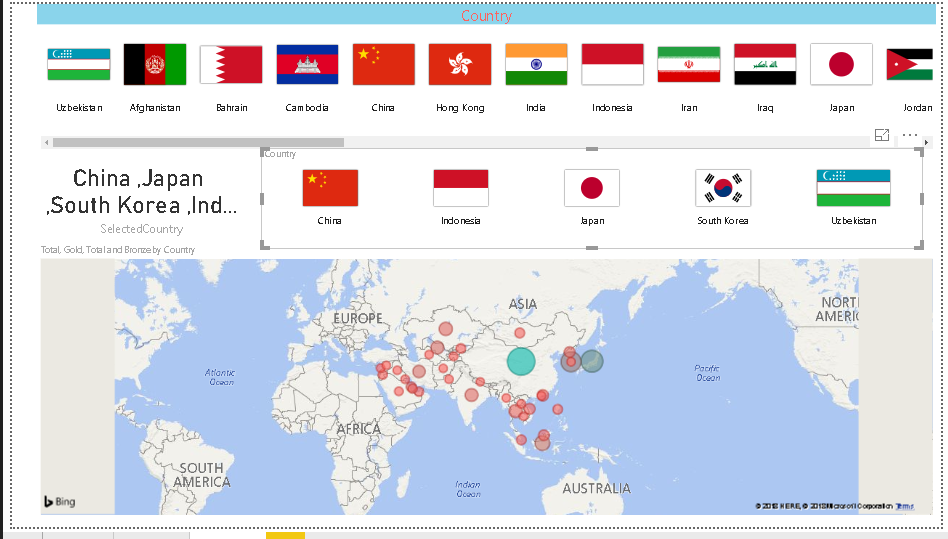
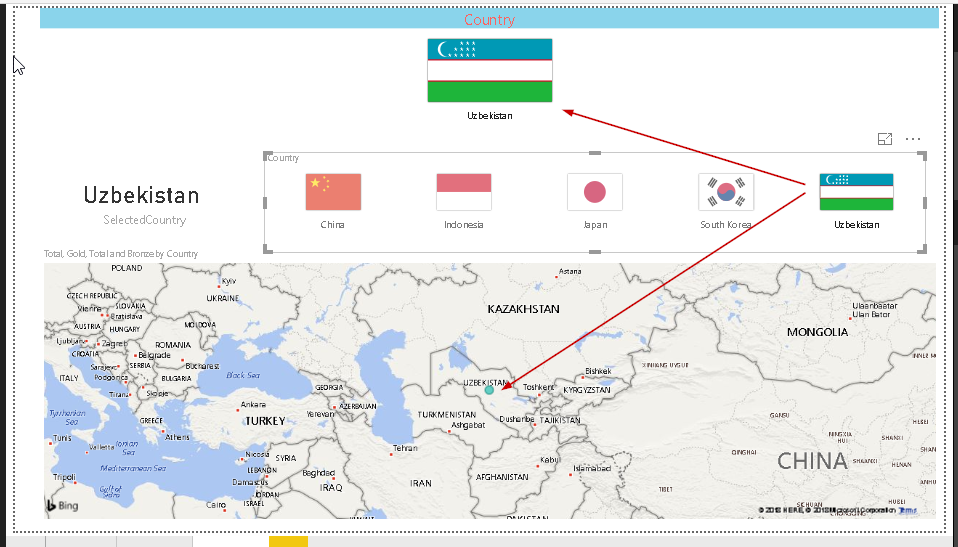
Now, this chart works in two ways. If we click on the country flag, in the top section, the new area also shows that country flag and map redirects to that particular country.
现在,此图表有两种工作方式。 如果单击国家标志,则在顶部区域中,新区域还将显示该国家标志,并将地图重定向到该特定国家。
Click on the blank area and it removes the filter on the county flag.
单击空白区域,它会删除县旗上的过滤器。
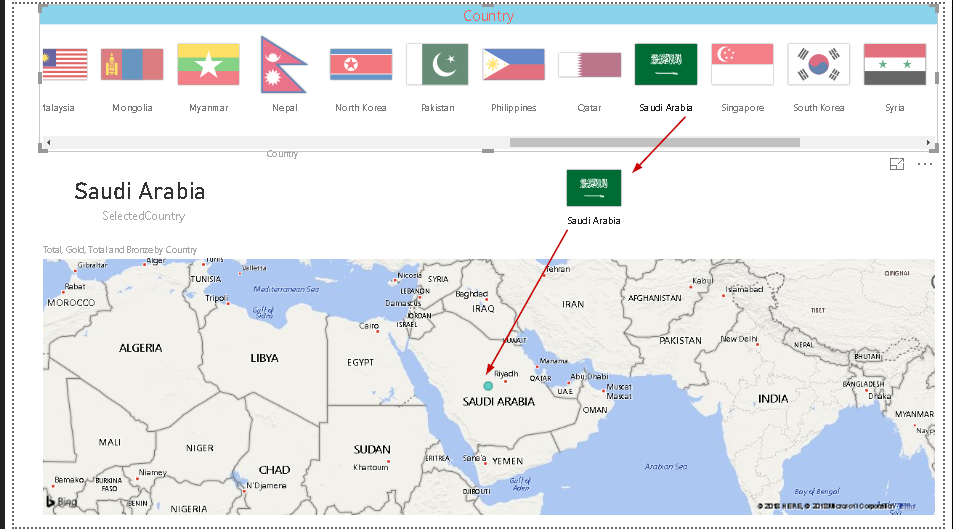
In another way, click on the flag from the top five country flag, and the top chart shows only that country flag instead of all countries.
以另一种方式,单击前五个国家/地区标志中的标志,并且顶部图表仅显示该国家/地区标志,而不显示所有国家/地区。
格式化启发世界国旗切片器 (Format Enlighten World Flag slicer )
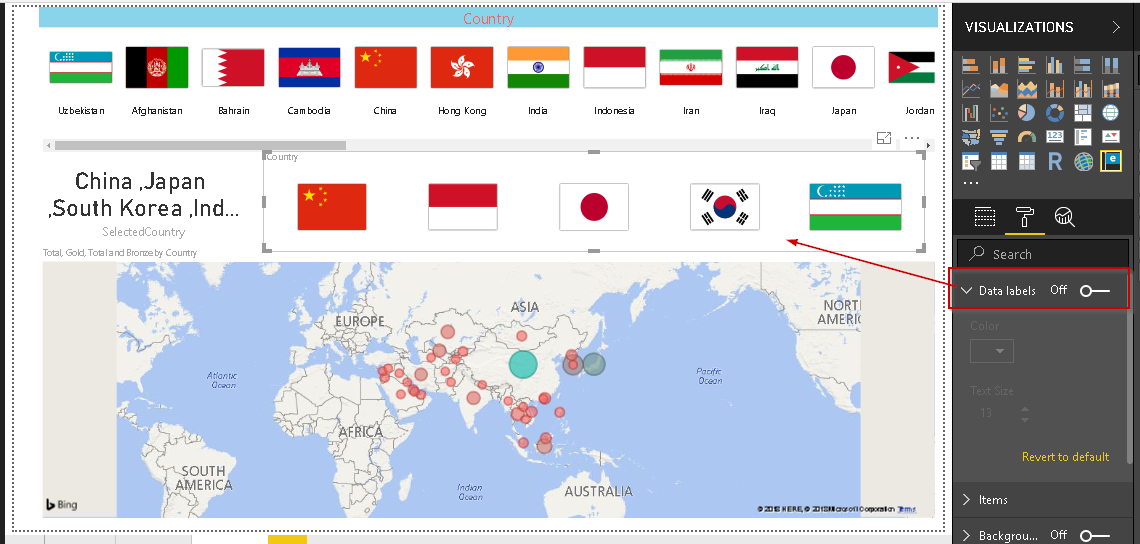
- Data labels: By default, ‘Data labels’ setting is ‘On’. It shows the country name below the flag. If we change this to ‘Off’, we cannot see the country name: 数据标签:默认情况下,“数据标签”设置为“开”。 它在标志下方显示国家名称。 如果将其更改为“关”,则看不到国家名称:
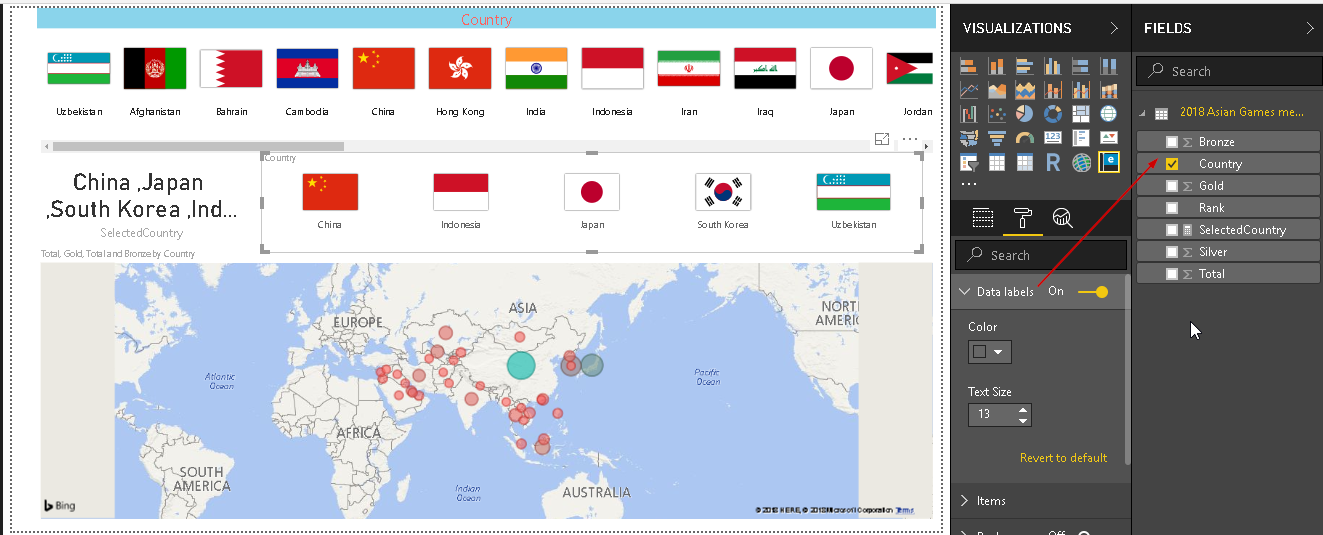
If we change data labels back to ‘On’, we can control the color and the font size for the countries name. By default, data labels show the country name.
如果我们将数据标签改回“开”,我们可以控制国家名称的颜色和字体大小。 默认情况下,数据标签显示国家名称。
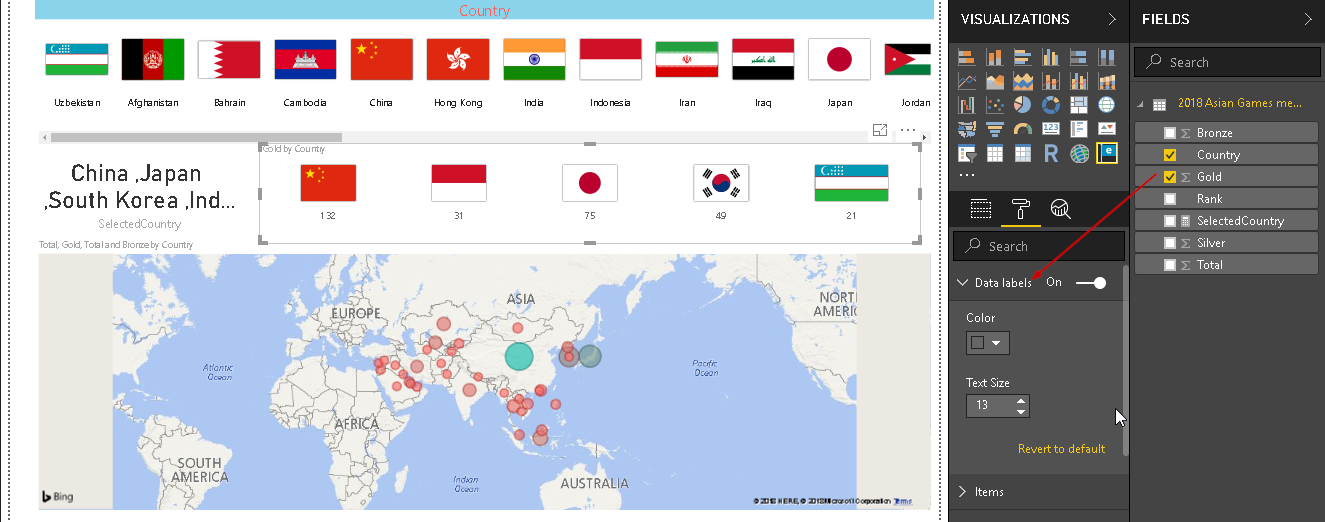
We can change it to show the value of another field also. For example, in below example, we can see the ‘Gold’ medals count below the flag names.
我们可以更改它以显示另一个字段的值。 例如,在下面的示例中,我们可以在标志名称下方看到“金牌”奖牌数。
Let us change it back to the country name and look out for the other formatting option.
让我们将其更改回国家名称,并注意其他格式设置选项。
- Orientation: By default, orientation is set to horizontal. 方向:默认情况下,方向设置为水平。
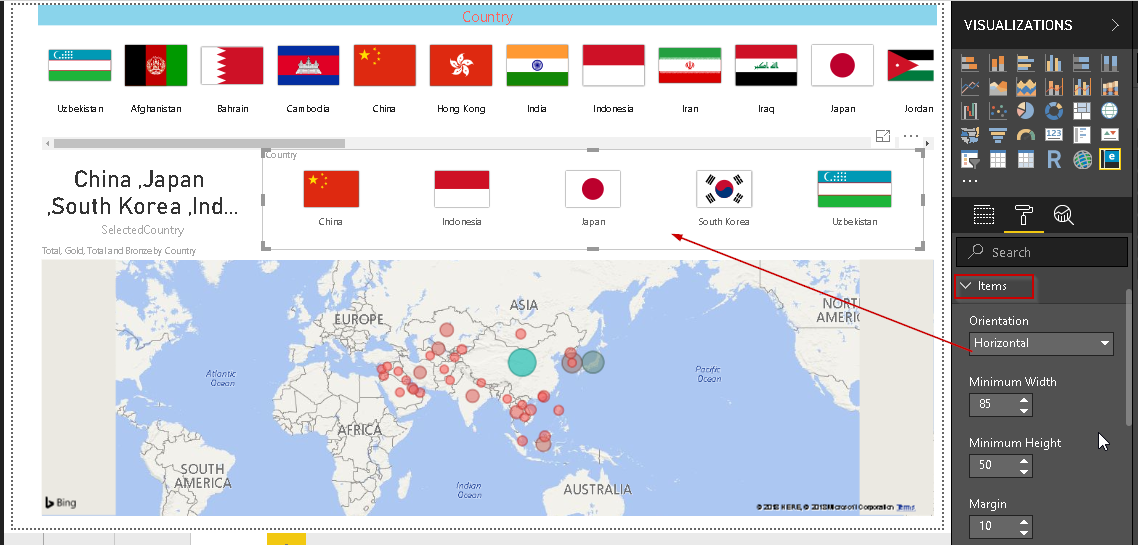
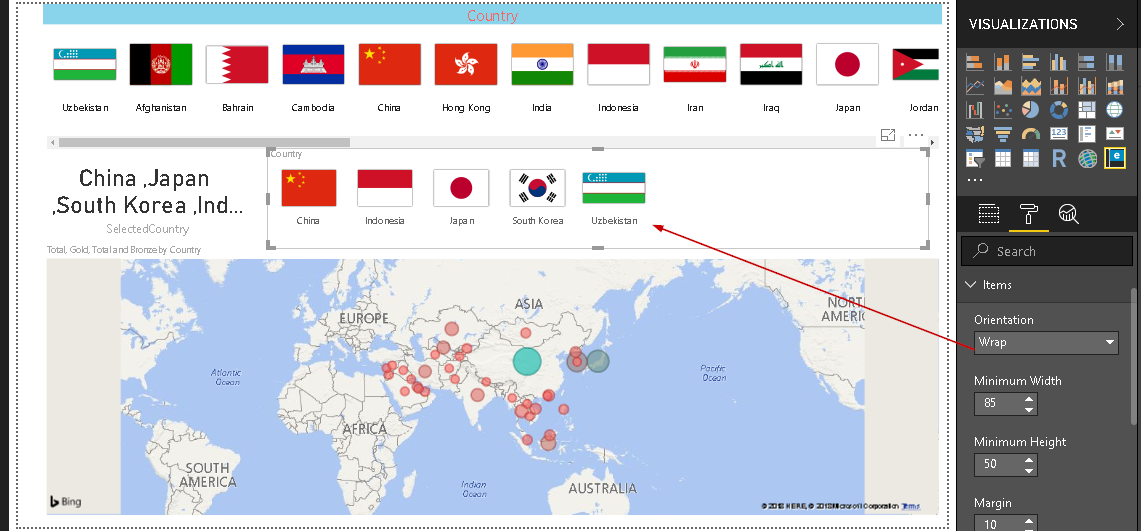
If we change it to ‘Wrap’ mode, the flag comes closer to each other as shown here.
如果我们将其更改为“环绕”模式,则标志会彼此靠近,如下所示。
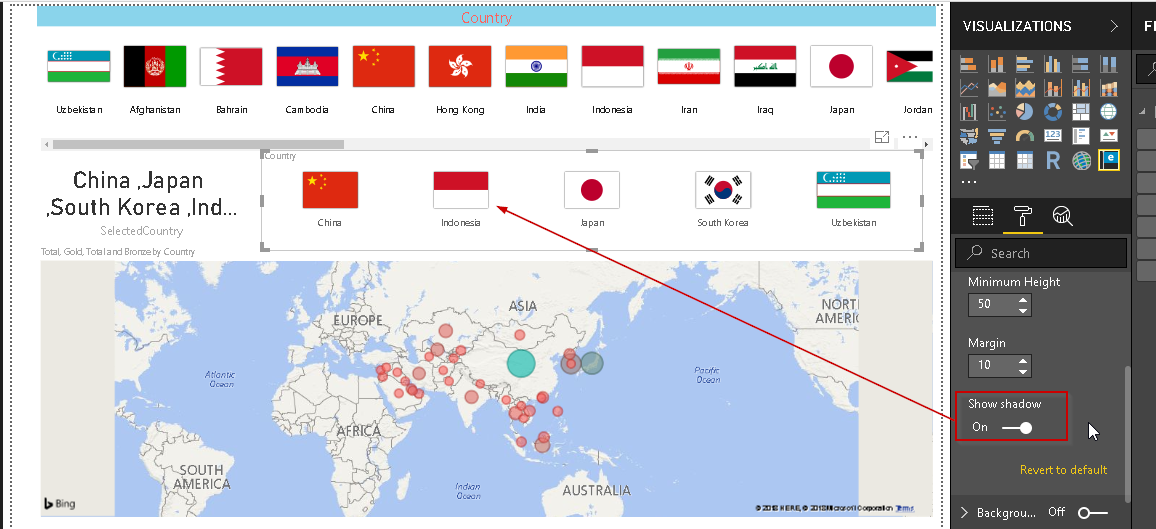
- Show Shadow: By default, the shadow section is ‘On’. It shows the border around the flag. 显示阴影:默认情况下,阴影部分为“开”。 它显示了标志周围的边框。
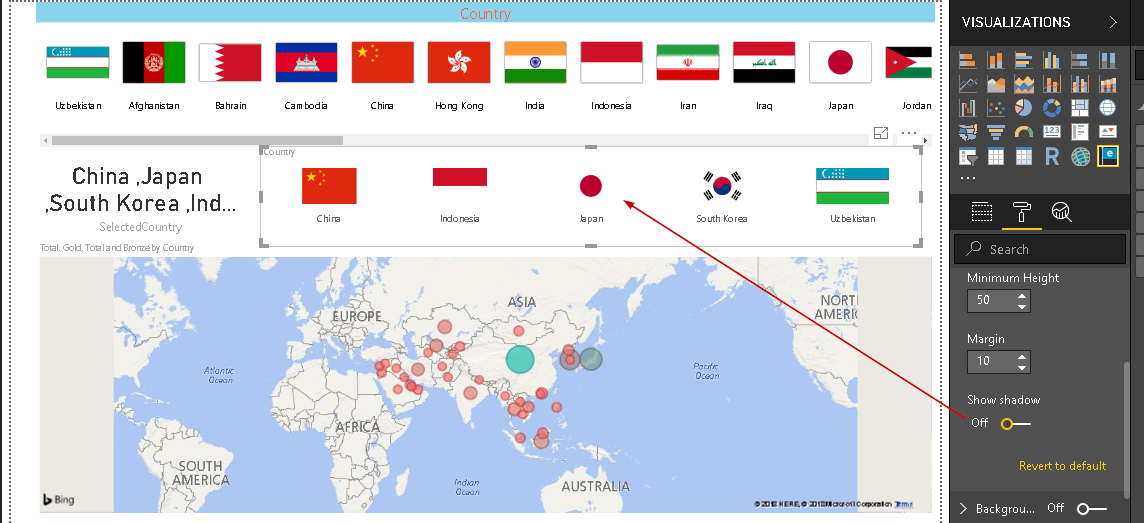
If we disable the show shadow, it does not show the border. We should not make this change. As you can see if we remove the border, the country flag looks inappropriate.
如果禁用显示阴影,则不会显示边框。 我们不应该进行此更改。 如您所见,如果我们删除边框,该国家标志似乎不合适。
结论 (Conclusion)
The Enlighten World Flag Slicer represents each county with its flag and provides ability to filter out the results for any particular country. You can explore this visual into Power BI Desktop. We will continue the series of exploring customized visuals in Power BI Desktop in future articles.
启蒙世界国旗切片器用国旗代表每个县,并能够过滤出任何特定国家/地区的结果。 您可以将此视觉效果探索到Power BI Desktop中。 在以后的文章中,我们将继续探索Power BI Desktop中的自定义视觉效果的系列。
目录 (Table of contents)
翻译自: https://www.sqlshack.com/enlighten-world-flag-slicer-in-power-bi-desktop/


 1829
1829


 被折叠的 条评论
为什么被折叠?
被折叠的 条评论
为什么被折叠?
 到【灌水乐园】发言


