


 本文介绍了如何使用Wireshark进行网络问题调试,重点探讨了TLS握手过程,包括Client Hello、Server Hello、证书、服务器密钥交换等阶段,以及可能出现的问题和解决方法。通过Wireshark,可以深入理解TLS协议,定位并解决加密通信中的故障。
wireshark tls
Sometimes in my darker moments I forget that not all programmers get to work with computer networks every day, like I do. This means that many of you don’t have a chance to experience some of the tools and debugging experiences that I do on a nearly daily basis. This is a real shame, because some of the tools available to programmers working with computer networks are some of the coolest available to any programmer.
有时候,在我更黑暗的时刻,我忘记了并非像我一样,并不是所有的程序员每天都可以使用计算机网络。 这意味着你们中的许多人没有机会体验我几乎每天都会做的一些工具和调试经验。 这实在令人遗憾,因为使用计算机网络的程序员可以使用的某些工具是任何程序员都可以使用的最酷的工具。
Today I’m going to dive into my go-to debugging tool for network problems: Wireshark. This may be the first in a series of posts where I demonstrate how I use Wireshark to investigate networks and to track down bugs in misbehaving implementations.
今天,我将深入研究针对网络问题的调试工具: Wireshark 。 这可能是系列文章中的第一篇,我将演示如何使用Wireshark调查网络并跟踪行为异常的错误。
Today, I’m going to talk about TLS, and Wireshark’s awesome functionality for trying to understand what happens when TLS goes wrong.
今天,我将讨论TLS,以及Wireshark强大的功能,可以尝试了解TLS出错时会发生什么。
无用的错误 (Unhelpful Errors)
Lots of us use tools that work with TLS on a regular basis, usually in the form of HTTPS URLs. If those tools work with OpenSSL, and you’ve ever seen them fail, you’ve likely seen one of OpenSSL’s cryptic error strings pop up in your face. These range from wildly overgeneral (“bad handshake”? What is bad about it?) to the accurate but unhelpful (“EOF in violation of protocol”, no duh). But OpenSSL rarely tells you what the actual problem was, usually because TLS has no good mechanism for communicating problems to the remote peer before terminating the handshake.
我们中的许多人会定期使用与TLS配合使用的工具,通常以HTTPS URL的形式。 如果这些工具可以与OpenSSL一起使用,并且您曾经见过它们失败了,那么您很可能已经看到了OpenSSL的一个隐式错误字符串之一。 这些范围很广,从泛滥(“糟糕的握手”?这有什么不好?)到准确但无济于事(“违反协议的EOF”,没有)。 但是OpenSSL很少告诉您实际的问题是什么,通常是因为TLS在终止握手之前没有将问题传达给远程对等方的良好机制。
For this reason, it becomes extremely helpful to see into a TLS handshake and understand what’s going on. It can help you spot problems and come up with ways to work around them. After a while you can get good enough at this that you can use Wireshark to discover bugs in servers that you don’t operate and cannot reach, and so are effectively a black box, purely by examining TLS handshakes (trust me, there are loads of servers that don’t correctly perform TLS handshakes).
因此,查看TLS握手并了解发生了什么非常有用。 它可以帮助您发现问题并提出解决问题的方法。 一段时间后,您将可以很好地做到这一点,从而可以使用Wireshark来发现无法运行且无法到达的服务器中的错误,因此实际上是黑匣子,仅通过检查TLS握手即可(相信我,这里有很多负载不能正确执行TLS握手的服务器)。
In this case, we’re going to look at a healthy TLS connection, and drill down to how it works. As we investigate the TLS protocol, we’ll also take a look at some places problems arise.
在这种情况下,我们将查看一个健康的TLS连接,并深入研究其工作方式。 在研究TLS协议时,我们还将研究出现问题的地方。
Let’s dive in!
让我们潜入吧!
入门 (Getting Started)
I’m going to use the Chrome web browser to investigate this. All the screenshots here are from Wireshark 2.0.1 on OS X El Capitan 10.11.3 Beta. I highly recommend using a Wireshark that’s at least version 2.0.0: the UI changed drastically for version 2 and is much cleaner and easier to work with.
我将使用Chrome网络浏览器对此进行调查。 这里的所有屏幕截图均来自OS X El Capitan 10.11.3 Beta上的Wireshark 2.0.1。 我强烈建议您使用版本至少为2.0.0的Wireshark:版本2的UI发生了巨大变化,并且更加简洁,易于使用。
We start by opening up Wireshark. This confronts us with a slightly intimidating white screen, but the things we’re most interested in are in the “Capture” section. Here we have two separate options: we can enter a capture filter, and we can select an interface to capture on.
我们首先打开Wireshark。 这给我们带来了一个令人生畏的白色屏幕,但是我们最感兴趣的是“捕获”部分。 在这里,我们有两个单独的选项:我们可以输入捕获过滤器,并且可以选择要捕获的接口。
Let’s talk briefly about capture filters. When you do a packet capture, most of the time you’ll be capturing on your computer’s primary network card. This is likely to include a lot of extraneous data from all of the stuff that’s going on in your computer. For this reason, when you’re debugging you’ll likely want to filter the traffic down to just the things you want.
让我们简短地谈谈捕获过滤器。 进行数据包捕获时,大多数情况下,您将在计算机的主网卡上进行捕获。 这可能包括计算机中正在运行的所有内容中的大量无关数据。 因此,在调试时,您可能希望将流量过滤为所需的内容。
Confusingly, Wireshark uses two filter languages. The one it puts in this box is the Berkley Packet Filter language, which is very simple. For debugging HTTPS connections, you can usually get away with using host <domain name> and port 443. In this case, as I’ll be investigating the connection between mkcert.org and my machine, I’ll use host mkcert.org and port 443.
令人困惑的是,Wireshark使用两种过滤器语言。 它放入此框中的一种语言是Berkley Packet Filter语言 ,它非常简单。 对于调试HTTPS连接,通常可以使用host <domain name> and port 443逃脱。 在这种情况下,由于我将研究mkcert.org和我的机器之间的连接,因此我将使用host mkcert.org and port 443 。
We fill that into the capture filter box, then select the interface we want to capture on. This can be tricky on machines with multiple networked interfaces, or when you have VPNs and other connections active, but in this case it’s relatively simple: I want my MacBook Pro’s wireless card, which is correctly identified as Wi-Fi: en0 by Wireshark. Select the interface by double-clicking, and you’ll get Wireshark’s capture interface:
我们将其填充到捕获过滤器框中,然后选择我们要捕获的接口。 在具有多个网络接口的计算机上,或者在您激活了VPN和其他连接的情况下,这可能会很棘手,但是在这种情况下,这相对简单:我想要MacBook Pro的无线网卡,该无线网卡被Wireshark正确标识为Wi-Fi: en0 。 双击选择接口,您将获得Wireshark的捕获接口:
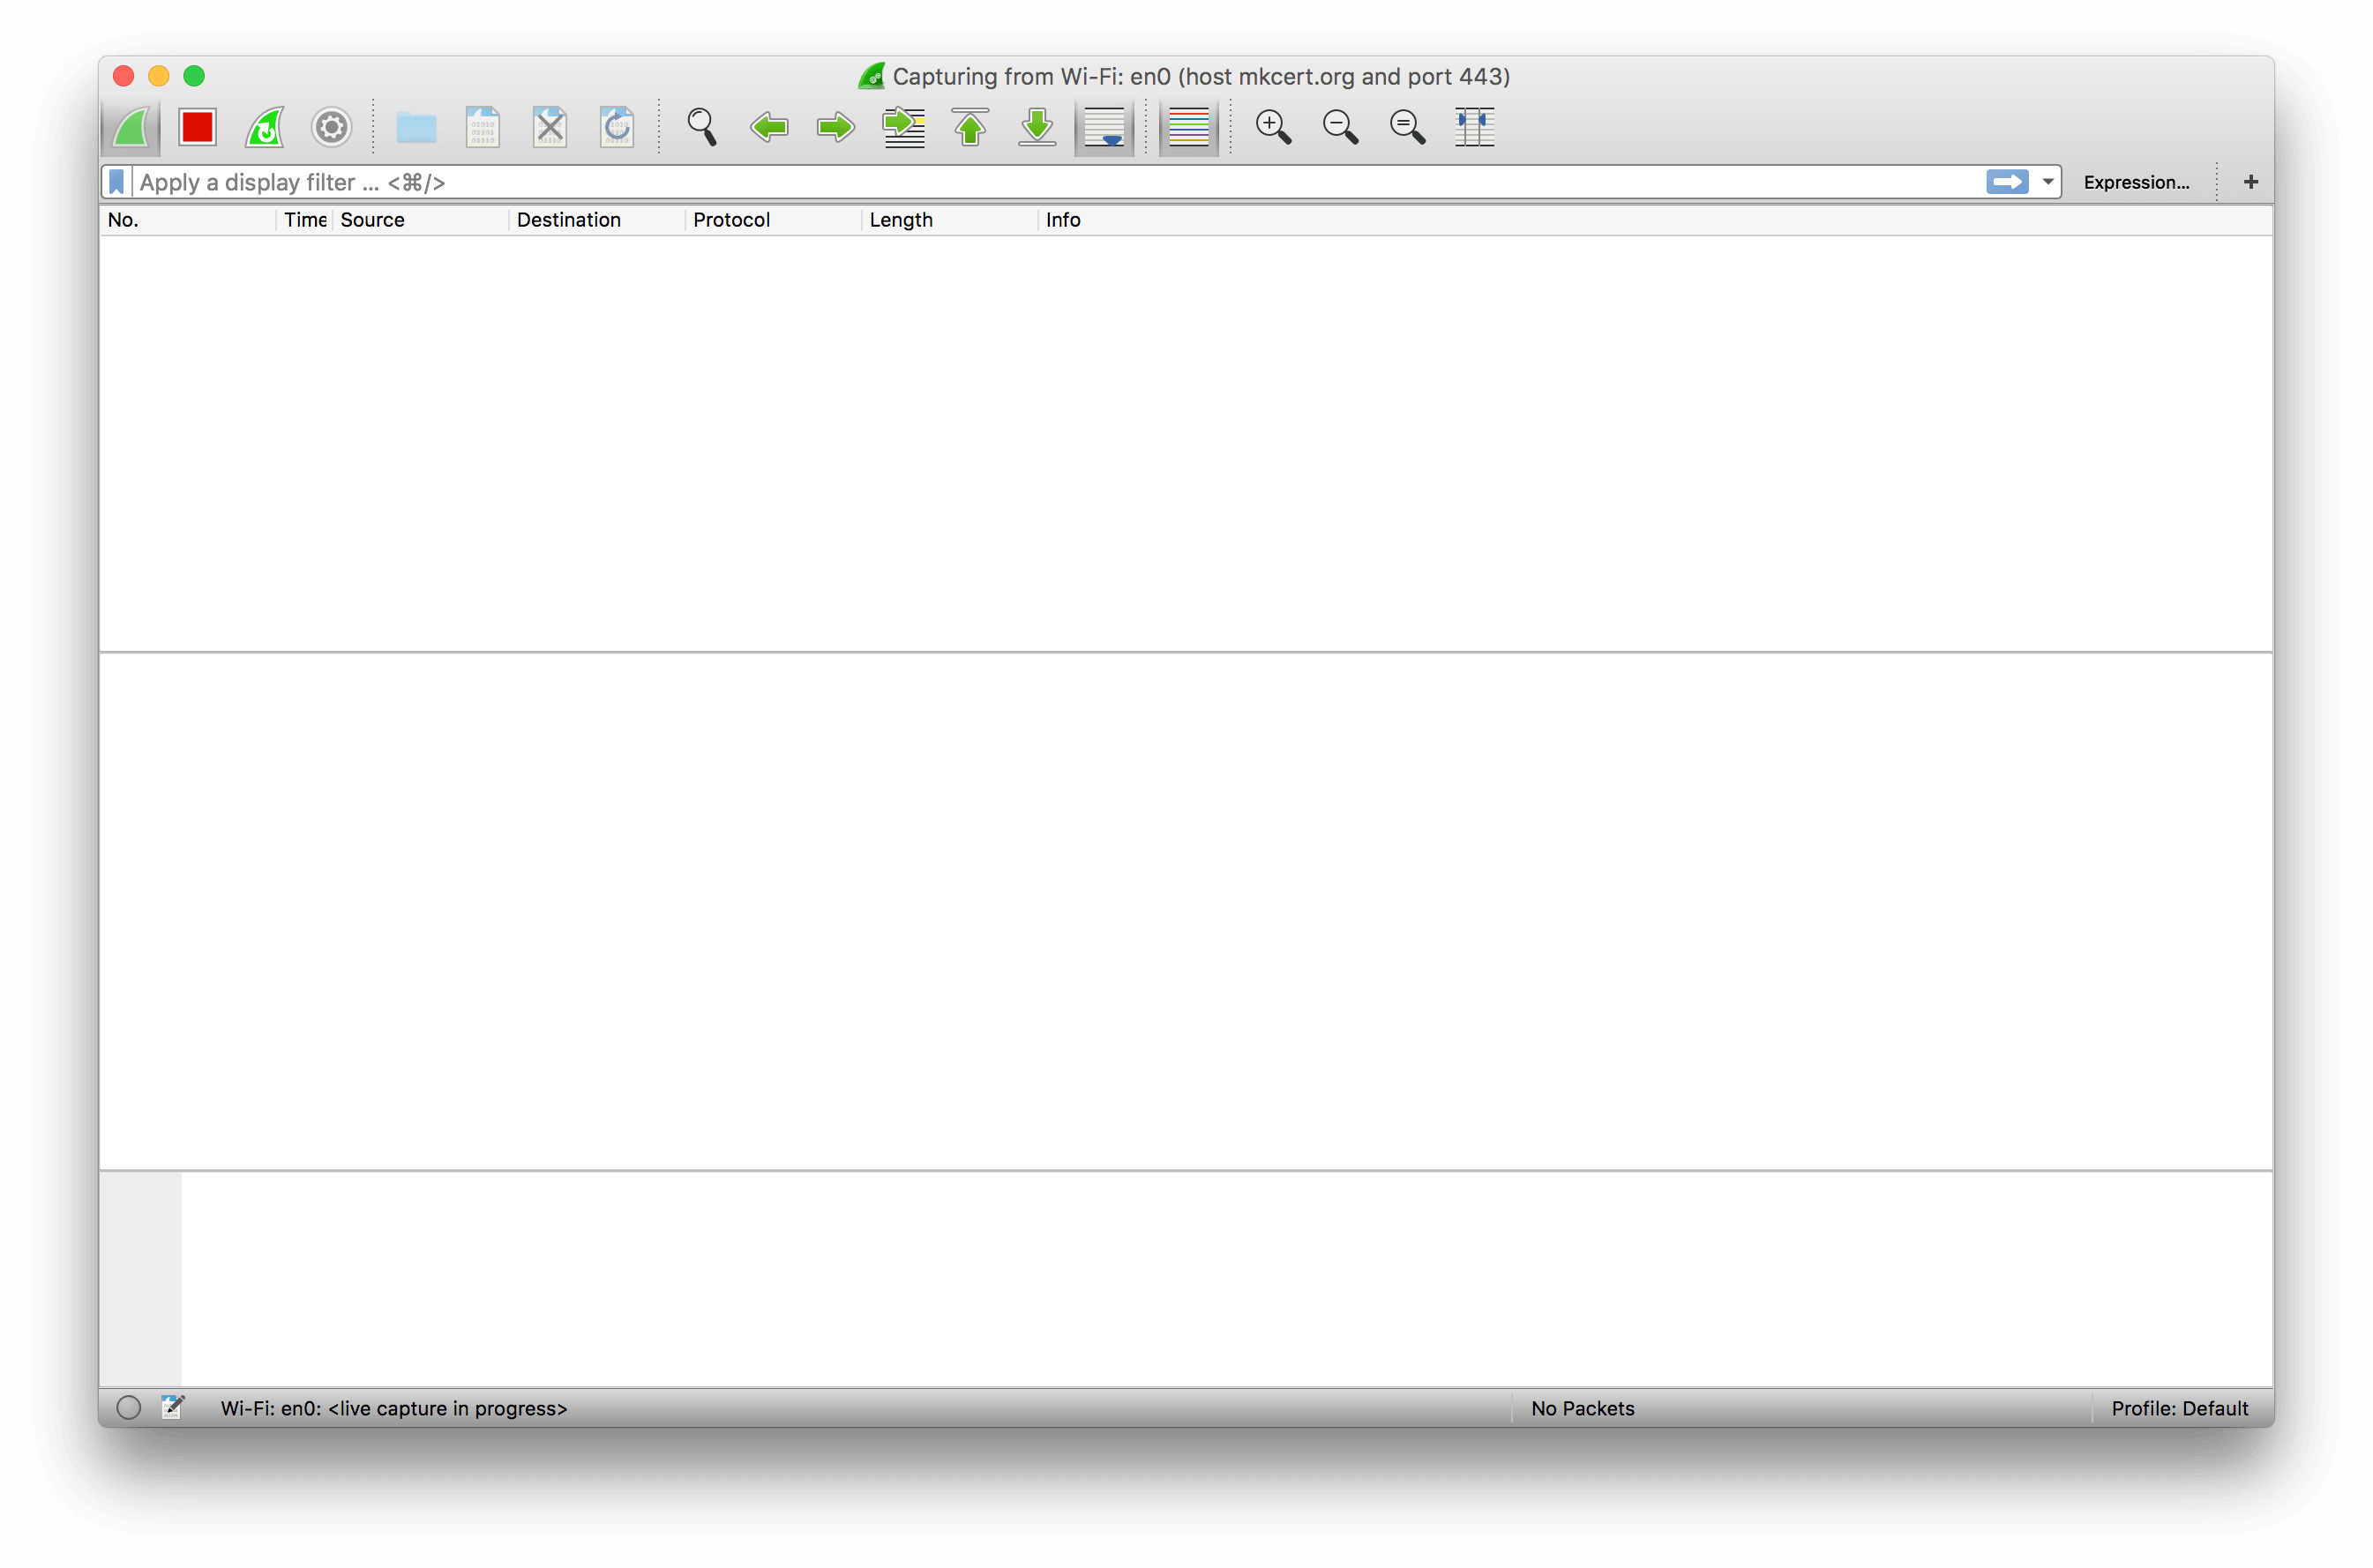
This screen looks intimidating, but it’s not that bad. Up at the top-left you have a few buttons for controlling the capture: specifically, for starting, stopping, and restarting it. These are useful: when you’re done capturing packets you should usually stop the capture, to avoid wasting resources by looking at every packet emitted by your machine!
 最低0.47元/天 解锁文章


 5255
5255

 被折叠的 条评论
为什么被折叠?
被折叠的 条评论
为什么被折叠?
 到【灌水乐园】发言


