


A picture says a thousand words, and with Python’s matplotlib library, it fortunately takes far less than a thousand words of code to create a production-quality graphic.
一幅图片说出一千个单词,而使用Python的matplotlib库,幸运的是,它只需不到一千个单词的代码即可创建出高质量的图形。
However, matplotlib is also a massive library, and getting a plot to look “just right” is often practiced on a trial-and-error basis. Using one-liners to generate basic plots in matplotlib is fairly simple, but skillfully commanding the remaining 98% of the library can be daunting.
但是,matplotlib还是一个庞大的库,通常在反复试验的基础上练习使图看起来“恰到好处”。 在matplotlib中使用单线生成基本图非常简单,但是熟练地命令库的其余98%可能会令人望而生畏。
This article is a beginner-to-intermediate-level walkthrough on matplotlib that mixes theory with example. While learning by example can be tremendously insightful, it helps to have even a surface-level understanding of the library’s inner workings and layout as well.
本文是matplotlib的初学者到中级的演练,它将理论与示例相结合。 虽然通过示例学习可以非常有洞察力,但是即使对图书馆的内部运作和布局也有了表面的了解,也有帮助。
Here’s what we’ll cover:
这是我们要介绍的内容:
- Pylab and pyplot: which is which?
- Key concepts of matplotlib’s design
- Understanding
plt.subplots() - Visualizing arrays with matplotlib
- Plotting with the pandas + matplotlib combination
- pylab和pyplot:哪个是?
- matplotlib设计的关键概念
- 了解
plt.subplots() - 使用matplotlib可视化数组
- 使用pandas + matplotlib组合进行绘图
Free Bonus: Click here to download 5 Python + Matplotlib examples with full source code that you can use as a basis for making your own plots and graphics.
免费奖金: 单击此处下载5个Python + Matplotlib示例,其中包含完整的源代码 ,您可以将其用作制作自己的图和图形的基础。
This article assumes the user knows a tiny bit of NumPy; we’ll mainly use the numpy.random module to generate “toy” data, drawing samples from different statistical distributions.
本文假定用户了解一点点NumPy。 我们将主要使用numpy.random模块生成“玩具”数据,从不同的统计分布中抽取样本。
If you don’t already have matplotlib installed, see here for a walkthrough before proceeding.
如果尚未安装matplotlib,请在继续操作之前查看此处的演练。
为什么Matplotlib会令人困惑? (Why Can Matplotlib Be Confusing?)
Learning matplotlib can be a frustrating process at times. The problem is not that matplotlib’s documentation is lacking (it’s extensive, actually). But, what can be challenging is that:
有时学习matplotlib可能是一个令人沮丧的过程。 问题不在于缺少matplotlib的文档(实际上,它是广泛的)。 但是,具有挑战性的是:
- The library itself is huge, at something like 200,000 total lines of code.
- Matplotlib is home to several different interfaces (ways of constructing a figure) and capable of interacting with a handful of different backends. (Backends deal with the process of how charts are actually rendered, not just structured internally.)
- While it is comprehensive, some of matplotlib’s own public documentation is seriously out-of-date. The library is still evolving, and many older examples floating around online may take 70% less lines of code in their modern version.
- 该库本身是巨大的,总共有200,000行代码。
- Matplotlib是几个不同接口 (构建图形的方式)的所在地,并且能够与少数不同的后端进行交互。 (后端处理的是图表的实际呈现过程,而不仅仅是内部结构。)
- 虽然内容全面,但是matplotlib自己的一些公共文档严重过时了 。 该库仍在不断发展,许多在网上发布的较旧的示例在其现代版本中可减少70%的代码行。
And so, before we get to any glitzy examples, it’s useful to grasp the core concepts of matplotlib’s design.
因此,在介绍任何浮华的示例之前,掌握matplotlib设计的核心概念很有用。
Pylab:它是什么,我应该使用它吗? (Pylab: What Is It, And Should I Use It?)
A bit of history: John D. Hunter, a neurobiologist, began developing matplotlib around 2003, originally inspired to emulate commands from Mathworks’ MATLAB software. John passed away tragically young at age 44, in 2012, and matplotlib is now a full-fledged community effort, developed and maintained by a host of others. (John talked about the evolution of matplotlib at the 2012 SciPy conference, which is worth a watch.)
一段历史:神经生物学家约翰·亨特(John D. Hunter)于2003年左右开始开发matplotlib,最初的灵感是模仿MathWorks的MATLAB软件中的命令。 John于2012年不幸去世,享年44岁,而matplotlib现在是由许多其他人开发和维护的成熟的社区活动。 (John在2012年SciPy会议上谈到了matplotlib的演变,值得关注。)
One relevant feature of MATLAB is its global style. The Python concept of importing is not heavily used in MATLAB, and most of MATLAB’s functions are readily available to the user at the top level.
MATLAB的一个相关功能是其全局样式 。 Python的导入概念并未在MATLAB中大量使用,并且顶层的用户可以轻松使用大多数MATLAB 函数 。
Knowing that matplotlib has its roots in MATLAB helps to explain why pylab exists. pylab is a module within the matplotlib library that was built to mimic MATLAB’s global style. It exists only to bring a number of functions and classes from both NumPy and matplotlib into the namespace, making for an easy transition for former MATLAB users who were not used to needing import statements. Ex-MATLAB converts (who are all fine people, I promise!) liked this functionality, because with from pylab import *, they could simply call plot() or array() directly, as they would in MATLAB.
知道matplotlib起源于MATLAB有助于解释为什么pylab存在。 pylab是matplotlib库中的一个模块,旨在模拟MATLAB的全局样式。 它的存在只是将NumPy和matplotlib中的许多函数和类引入了命名空间 ,从而为不习惯使用import语句的前MATLAB用户提供了轻松的过渡。 前MATLAB转换人员(我保证都是优秀的人!)喜欢此功能,因为使用from pylab import * ,它们可以直接调用plot()或array() ,就像在MATLAB中一样。
The issue here may be apparent to some Python users: using from pylab import * in a session or script is generally bad practice. Matplotlib now directly advises against this in its own tutorials:
对于某些Python用户而言,这里的问题可能很明显:在会话或脚本中使用from pylab import *通常是不好的做法。 Matplotlib现在在自己的教程中直接建议不要这样做:
[pylab] still exists for historical reasons, but it is highly advised not to use. It pollutes namespaces with functions that will shadow Python built-ins and can lead to hard-to-track bugs. To get IPython integration without imports the use of the
%matplotlibmagic is preferred. [source][pylab]由于历史原因仍然存在,但强烈建议不要使用。 它使用将掩盖Python内置函数并可能导致难以跟踪的错误的函数污染名称空间。 要获得不导入的IPython集成,首选使用
%matplotlib魔术。 [ 来源 ]
Internally, there are a ton of potentially conflicting imports being masked within the short pylab source. And in fact, using ipython --pylab (from the terminal/command line) or %pylab (from IPython/Jupyter tools) simply calls from pylab import * under-the-hood.
在内部,简短的pylab 源码中掩盖了大量潜在冲突的进口。 实际上,使用ipython --pylab (从终端/命令行)或%pylab (从IPython / Jupyter工具)只需from pylab import *调用。
The bottom line is that matplotlib has abandoned this convenience module and now explicitly recommends against using pylab, bringing things more in line with one of Python’s key notions–that explicit is better than implicit.
最重要的是, matplotlib放弃了此便利模块,现在明确建议不要使用pylab,使事情更符合Python的一个关键概念— 显式优于隐式 。
Without the need for pylab, we can usually get away with just one canonical import:
无需pylab,我们通常只需完成一次规范的导入即可:
 >>> >>>  import import matplotlib.pyplot matplotlib.pyplot as as plt
plt
Let’s also import NumPy while we’re at it, which we’ll use for generating data later on, and call np.random.seed() to make examples with (pseudo)random data reproducible:
让我们在导入NumPy的同时导入它,稍后将使用它来生成数据,并调用np.random.seed()来使(伪)随机数据的示例可重现:
Matplotlib对象层次结构 (The Matplotlib Object Hierarchy)
One important big-picture matplotlib concepts is that of its object hierarchy.
关于matplotlib的一个重要概念是其对象层次结构 。
If you’ve worked through any introductory matplotlib tutorial, you’ve probably called something like plt.plot([1, 2, 3]). This one-liner hides the fact that a plot is really a hierarchy of nested Python objects. A “hierarchy” here means that there is a tree-like structure of matplotlib objects underlying each plot.
如果您已经完成了matplotlib入门教程,则可能会调用诸如plt.plot([1, 2, 3]) 。 这种单线隐藏了这样一个事实,即图实际上是嵌套的Python对象的层次结构。 这里的“层次结构”意味着每个图下面都有matplotlib对象的树状结构。
A Figure object is the outermost container for a matplotlib graphic, which can contain multiple Axes objects. One source of confusion is from this naming: an Axes actually translates into what we think of as an individual plot or graph (rather than the plural of “axis”, as we might expect).
Figure对象是matplotlib图形的最外面的容器,其中可以包含多个Axes对象。 混淆的一个根源是这种命名方式: Axes实际上转化为我们认为的单个图或图(而不是我们可能期望的“轴”的复数)。
You can think of the Figure object as a box-like container holding one or more Axes (actual plots). Below the Axes in the hierarchy are smaller objects such as tick marks, individual lines, legends, and text boxes. Almost every “element” of a chart is its own manipulable Python object, all the way down to the ticks and labels:
您可以将Figure对象视为一个盒Axes器,其中包含一个或多个Axes (实际图)。 层次结构中的“ Axes下方是较小的对象,例如刻度线,单行,图例和文本框。 图表的几乎每个“元素”都是其自己的可操作的Python对象,一直到刻度和标签:
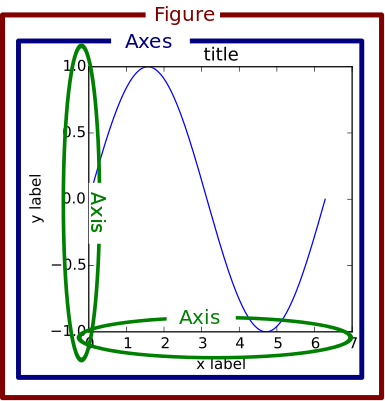
Here’s an illustration of this hierarchy in action. Don’t worry if you’re not completely familiar with this notation, which we’ll cover later on.
这是这种层次结构的示例。 如果您对这个符号不完全熟悉,请不要担心,我们将在稍后介绍。
 >>> >>>  figfig , , _ _ = = pltplt .. subplotssubplots ()
()
>>> >>>  typetype (( figfig )
)
<class 'matplotlib.figure.Figure'>
<class 'matplotlib.figure.Figure'>
Above we created two variables with plt.subplots(). The first is a top-level Figure object; the second is a “throwaway” variable that we don’t need just yet, denoted with an underscore. Using attribute notation, it is easy to traverse down the figure hierarchy and see the first tick of the y axis of the first Axes object:
上面我们用plt.subplots()创建了两个变量。 第一个是顶级Figure对象; 第二个是我们现在不需要的“丢弃”变量,用下划线表示。 使用属性表示法,可以很容易地遍历图形层次结构并查看第一个Axes对象的y轴的第一个刻度 :
Above, fig (a Figure class instance) has multiple Axes (a list, for which we take the first element). Each Axes has a yaxis and xaxis, each of which have a collection of “major ticks,” and we grab the first one.
上面的fig (一个Figure类实例)有多个Axes (一个列表,我们将其取为第一个元素)。 每个Axes有一个yaxis和xaxis ,每一个具有集“主刻度”,我们抢第一个。
Matplotlib presents this as a figure anatomy, rather than an explicit hierarchy:
Matplotlib将此表示为人物解剖,而不是明确的层次结构:
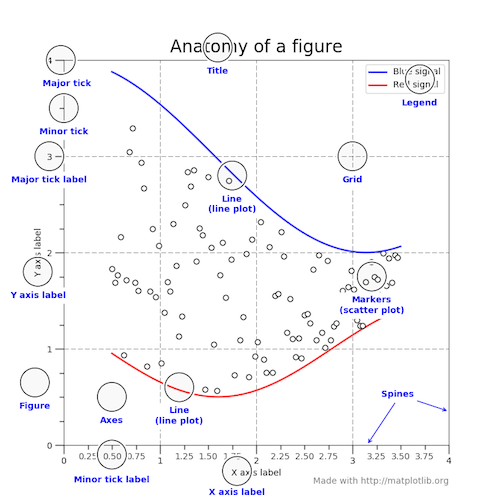
(In true matplotlib style, the figure above is created in the matplotlib docs here.)
(以真正的matplotlib样式,上图是在此处的matplotlib文档中创建的。)
有状态与无状态方法 (Stateful Versus Stateless Approaches)
Alright, we need one more chunk of theory before we can get around to the shiny visualizations–the difference between the stateful (a.k.a. state-based, state-machine) and stateless (a.k.a. object-oriented, OO) interfaces.
好了,我们需要进一步的理论知识,才能研究出闪亮的可视化效果– 有状态 (又名基于状态的状态机)与无状态 (又名面向对象OO)接口之间的区别。
Above, we used import matplotlib.pyplot as plt to import the pyplot module from matplotlib and name it plt.
上面,我们使用import matplotlib.pyplot as plt从matplotlib导入pyplot模块并将其命名为plt 。
Almost all functions from pyplot, such as plt.plot(), are implicitly either referring to an existing current Figure and current Axes, or creating them anew if none exist. Hidden in the matplotlib docs is this helpful snippet:
pyplot中的几乎所有函数(例如plt.plot()都隐式地引用现有的当前Figure和当前Axes,或者如果不存在则重新创建它们。 matplotlib文档中隐藏了以下有用的代码段:
[With pyplot], simple functions are used to add plot elements (lines, images, text, etc.) to the current axes in the current figure. [emphasis added]
[使用pyplot],简单的功能用于将绘图元素(线,图像,文本等)添加到当前图形中的当前轴 。 [重点添加]
Hardcore ex-MATLAB users may choose to word this by saying something like, “plt.plot() is a state-machine interface that implicitly tracks of the current figure!” In English, this means that:
铁杆前MATLAB用户可以选择这样说:“ plt.plot()是一个状态机接口,可以隐式跟踪当前图形!” 用英语,这意味着:
- The stateful interface makes its calls with
plt.plot()and other top-level pyplot functions. There is only ever one Figure or Axes that you’re manipulating at a given time, and you don’t need to explicitly refer to it. - Modifying the underlying objects directly is the object-oriented approach. We usually do this by calling methods of an
Axesobject, which is the object that represents a plot itself.
- 有状态接口使用
plt.plot()和其他顶级pyplot函数进行调用。 在给定的时间,您只需要操纵一个图形或轴,而无需显式引用它。 - 直接修改基础对象是面向对象的方法。 通常,我们通过调用
Axes对象的方法来执行此操作,该对象是表示图本身的对象。
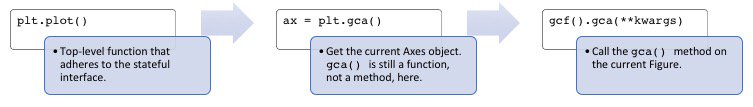
The flow of this process, at a high level, looks like this:
此过程的流程大致上如下所示:
Tying these together, most of the functions from pyplot also exist as methods of the matplotlib.axes.Axes class.
将它们捆绑在一起,pyplot中的大多数功能也作为matplotlib.axes.Axes类的方法存在。
This is easier to see by peaking under the hood; plt.plot() can be boiled down to five or so lines of code:
通过在引擎盖下达到顶峰更容易看到它。 plt.plot()可以简化为plt.plot()五行代码:
 # matplotlib/pyplot.py
# matplotlib/pyplot.py
>>> >>>  def def plotplot (( ** argsargs , , **** kwargskwargs ):
):
...     ...     """An abridged version of plt.plot()."""
"""An abridged version of plt.plot()."""
...     ...     ax ax = = pltplt .. gcagca ()
()
...     ...     return return axax .. plotplot (( ** argsargs , , **** kwargskwargs )

)

>>> >>>  def def gcagca (( **** kwargskwargs ):
):
...     ...     """Get the current Axes of the current Figure."""
"""Get the current Axes of the current Figure."""
...     ...     return return pltplt .. gcfgcf ()() .. gcagca (( **** kwargskwargs )
)
That is, calling plt.plot() is just a convenient way to get the current Axes of the current Figure and then call its plot() method. This is what is meant by the assertion that the stateful interface always “implicitly tracks” the plot that it wants to reference.
也就是说,调用plt.plot()只是获取当前图形的当前轴,然后调用其plot()方法的便捷方法。 这就是有状态接口始终“隐式跟踪”它要引用的绘图的主张。
pyplot is home to a batch of functions which are really just wrappers around matplotlib’s object-oriented interfac
 最低0.47元/天 解锁文章


 264
264


 被折叠的 条评论
为什么被折叠?
被折叠的 条评论
为什么被折叠?
 到【灌水乐园】发言


