


python水平柱状图排序
Many times while plotting a figure, we have to compare different functions simultaneously. Then we do have the option to plot in a single figure but this is helpful only for a limited number of functions. If there are a greater number of functions, then plotting in the same figure turns out to be messy. Therefore, matplotlib provides a feature of subploting in which we can plot more than one plot in one figure with more than one graph. Subplotting in the horizontal axis is similar to vertical subplotting and is often used for y-axis comparison. We can plot many plots in series and the following are some examples for illustrations.
绘制图形很多时候,我们必须同时比较不同的功能。 然后,我们确实可以选择绘制单个图形,但这仅对有限数量的功能有用。 如果有更多的功能,则在同一图中绘制会变得很混乱。 因此,matplotlib提供了细分功能,其中我们可以在一个图形中绘制多个图形,并在多个图形中绘制图形。 水平轴上的子绘图类似于垂直子图中的绘图,通常用于y轴比较。 我们可以串联绘制许多图,以下是一些示例说明。

Syntax:
句法:
#plotting in a one figure
plt.figure()

#leftmost
plt.subplot(1, 3, 1)
plt.plot(x1, y1, 'yo')
plt.title('SubPlot Example')

#middle
plt.subplot(1, 3, 2)
plt.plot(x2, y2, 'go')
plt.xlabel('time (s)')
plt.ylabel('Undamped')

#rightmost figure
plt.subplot(1, 3, 3)
plt.plot(x2, y2, 'ro')
plt.xlabel('time (s)')
plt.ylabel('Undamped')

plt.show()

Note: Both the graphs are independent, as the following figure(1) adds grid to one graph and the other remains the same and furthermore in figure(2), both have grid.
注意:两个图都是独立的,因为下图(1)将网格添加到一个图,另一个图保持不变,此外在图(2)中,两个图都具有网格。
水平子图的Python代码 (Python code for horizontal subplot)
# Data Visualization using Python
# Horizontal Subplot
import numpy as np
import matplotlib.pyplot as plt
x1 = np.linspace(0.0, 2.0)
x2 = np.linspace(0.0, 1.0)
y1 = np.sin(2 * np.pi * x1) * np.exp(-x1)
y2 = np.cos(2 * np.pi * x2)
y3 = np.sin(2 * np.pi * x2)
# Example 1 : Default Subplot
plt.figure()
# Leftmost
plt.subplot(1, 3, 1)
plt.plot(x1, y1, 'yo')
plt.title('Leftmost')
plt.ylabel('Damped')
plt.xlabel('time (s)')
# middle
plt.subplot(1, 3, 2)
plt.plot(x2, y2, 'go')
plt.xlabel('time (s)')
plt.title('Middle')
# Rightmost
plt.subplot(1, 3, 3)
plt.plot(x2, y3, 'ro')
plt.xlabel('time (s)')
plt.title('Rightmost')
plt.show()
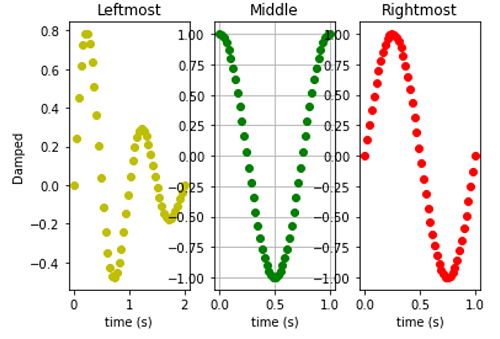
# Example 2 : Applying Grid to middle subplot
plt.figure()
# Leftmost
plt.subplot(1, 3, 1)
plt.plot(x1, y1, 'yo')
plt.title('Leftmost')
plt.ylabel('Damped')
plt.xlabel('time (s)')
# middle
plt.subplot(1, 3, 2)
plt.plot(x2, y2, 'go')
plt.xlabel('time (s)')
plt.title('Middle')
plt.grid()
# Rightmost
plt.subplot(1, 3, 3)
plt.plot(x2, y3, 'ro')
plt.xlabel('time (s)')
plt.title('Rightmost')
plt.show()
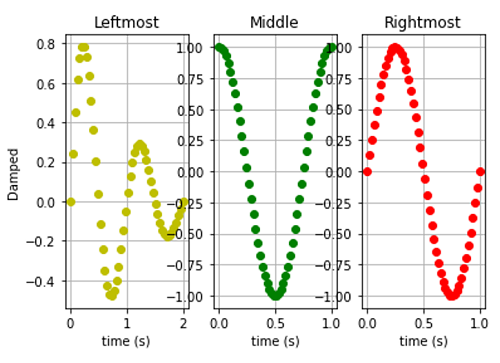
# Example 3 : Applying Grid to All
plt.figure()
# Leftmost
plt.subplot(1, 3, 1)
plt.plot(x1, y1, 'yo')
plt.title('Leftmost')
plt.ylabel('Damped')
plt.xlabel('time (s)')
plt.grid()
# middle
plt.subplot(1, 3, 2)
plt.plot(x2, y2, 'go')
plt.xlabel('time (s)')
plt.title('Middle')
plt.grid()
# Rightmost
plt.subplot(1, 3, 3)
plt.plot(x2, y3, 'ro')
plt.xlabel('time (s)')
plt.title('Rightmost')
plt.grid()
plt.show()
Output:
输出:
Output is as figure
翻译自: https://www.includehelp.com/python/horizontal-subplot.aspx
python水平柱状图排序


 639
639

 被折叠的 条评论
为什么被折叠?
被折叠的 条评论
为什么被折叠?
 到【灌水乐园】发言


