


 本文深入探讨Seaborn Distplot,一种用于展示数据分布的工具。介绍了如何创建Distplot,添加轴标签,结合Kernel Density Estimate和Rug Plot进行数据可视化,以及自定义颜色和风格。Seaborn Distplot结合Matplotlib,提供了强大的数据可视化功能。
seaborn
Hey, folks! In this article, we will be focusing on Seaborn Distplot in detail.
嘿伙计! 在本文中,我们将重点关注Seaborn Distplot 。
什么是Seaborn Distplot? (What is a Seaborn Distplot?)
A Distplot or distribution plot, depicts the variation in the data distribution. Seaborn Distplot represents the overall distribution of continuous data variables.
一个Distplot或分布图,描绘了在数据分布的变化。 Seaborn Distplot代表连续数据变量的整体分布。
The Seaborn module along with the Matplotlib module is used to depict the distplot with different variations in it. The Distplot depicts the data by a histogram and a line in combination to it.
Seaborn模块与Matplotlib模块一起用于描述具有不同变体的distplot。 Distplot通过直方图和与其组合的线来描述数据。
创建海底Distplot (Creating a Seaborn Distplot)
Python Seaborn module contains various functions to plot the data and depict the data variations. The seaborn.distplot() function is used to plot the distplot. The distplot represents the univariate distribution of data i.e. data distribution of a variable against the density distribution.
Python Seaborn模块包含各种功能,可以绘制数据并描述数据变化。 seaborn.distplot() function用于绘制distplot。 分布图表示数据的单变量分布,即变量相对于密度分布的数据分布。
Syntax:
句法:
seaborn.distplot()
The seaborn.distplot() function accepts the data variable as an argument and returns the plot with the density distribution.
seaborn.distplot()函数接受数据变量作为参数,并返回具有密度分布的图。
Example 1:
范例1:
import numpy as np
import seaborn as sn
import matplotlib.pyplot as plt
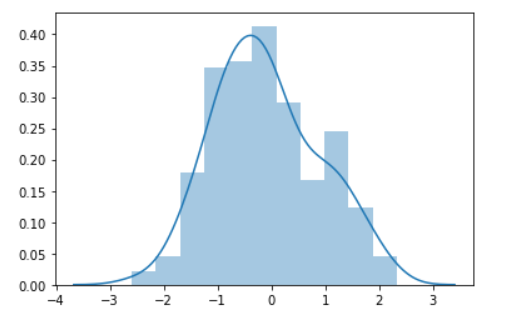
data = np.random.randn(200)
res = sn.distplot(data)
plt.show()
We have used the numpy.random.randn() function to generate random data values. Further, the pyplot.show() function is used show the plot.
我们使用了numpy.random.randn() function来生成随机数据值。 此外,使用pyplot.show() function显示图。
Output:
输出:
Example 2:
范例2:
import numpy as np
import seaborn as sn
import matplotlib.pyplot as plt
import pandas as pd
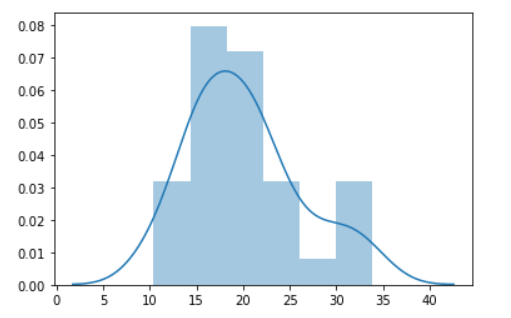
data_set = pd.read_csv("C:/mtcars.csv")
data = pd.DataFrame(data_set['mpg'])
res = sn.distplot(data)
plt.show()
The pandas.read_csv() function loads the dataset into the Python environment.
pandas.read_csv() function将数据集加载到Python环境中。
Output:
输出:
将标签添加到DistPlot的轴 (Adding labels to the axis of DistPlot)
The Seaborn Distplot can be provided with labels of the axis by converting the data values into a Pandas Series using the below syntax:
通过使用以下语法将数据值转换为Pandas系列,可以为Seaborn Distplot提供轴的标签:
Syntax:
句法:
pandas.Series(data,name='name')
seaborn.distplot()
Pandas Series contains a parameter ‘name‘ to set the label of the data axis.
Pandas Series包含一个参数“ name ”,用于设置数据轴的标签。
Example:
例:
import numpy as np
import seaborn as sn
import matplotlib.pyplot as plt
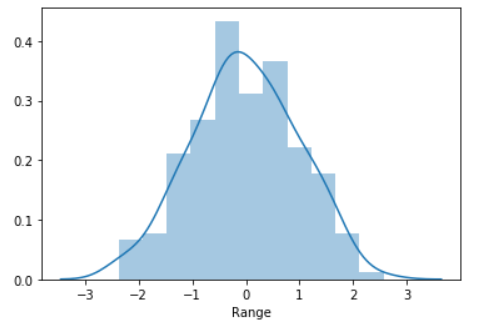
data = np.random.randn(200)
res = pd.Series(data,name="Range")
plot = sn.distplot(res)
plt.show()
Output:
输出:
Seaborn DistPlot和内核密度估计图 (Seaborn DistPlot along with Kernel Density Estimate Plot)
The Seaborn Distplot can also be clubbed along with the Kernel Density Estimate Plot to estimate the probability of distribution of continuous variables across various data values.
也可以将Seaborn Distplot与内核密度估计图合并在一起,以估计连续变量在各种数据值上的分布概率。
Syntax:
句法:
seaborn.distplot(data,kde=True)
The kde parameter is set to True to enable the Kernel Density Plot along with the distplot.
kde参数设置为True以启用内核密度图和distplot。
Example:
例:
import numpy as np
import seaborn as sn
import matplotlib.pyplot as plt
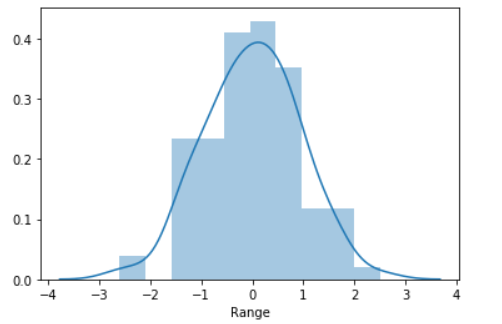
data = np.random.randn(100)
res = pd.Series(data,name="Range")
plot = sn.distplot(res,kde=True)
plt.show()
Output:
输出:
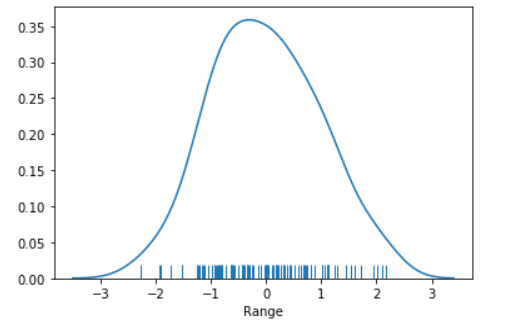
使用Seaborn DistPlot和Rug Plot可视化数据 (Visualizing the data with Seaborn DistPlot along with Rug Plot)
We can map the Seaborn Distplot along with Rug Plot to depict the distribution of data against bins with respect to the univariate data variable. The Rug Plot describes visualizes distribution of data in the form of bins.
我们可以将Seaborn Distplot与Rug Plot一起映射,以描述关于单变量数据变量的bin数据分布。 地毯图描述了以箱形式可视化数据分布。
Syntax:
句法:
seaborn.distplot(data, rug=True, hist=False)
The ‘rug‘ parameter needs to be set to True to enable the rug plot distribution.
需要将“ rug ”参数设置为“ True以启用地毯图分布。
Example:
例:
import numpy as np
import seaborn as sn
import matplotlib.pyplot as plt

data = np.random.randn(100)
res = pd.Series(data,name="Range")
plot = sn.distplot(res,rug=True,hist=False)
plt.show()
Output:
输出:
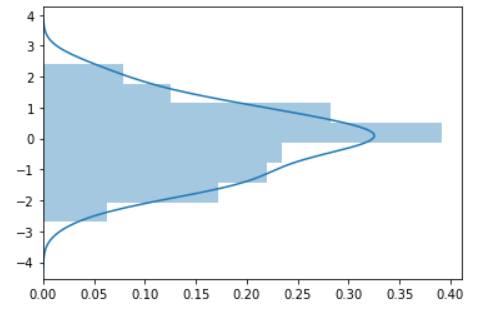
沿垂直轴绘制Seaborn Distplot (Plotting Seaborn Distplot along vertical axis)
The entire Distplot can be plotted on the y axis using the below syntax:
可以使用以下语法在y轴上绘制整个Distplot:
Syntax:
句法:
seaborn.distplot(data,vertical=True)
The ‘vertical‘ parameter needs to be set to True to plot the distplot on the y-axis.
需要将“ vertical ”参数设置为True才能在y轴上绘制distplot。
Example:
例:
import numpy as np
import seaborn as sn
import matplotlib.pyplot as plt

data = np.random.randn(100)

plot = sn.distplot(data,vertical=True)

plt.show()
Output:
输出:
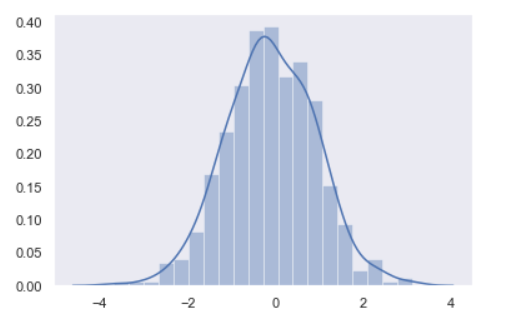
使用seaborn.set()函数设置其他样式 (Setting a different style using seaborn.set() function)
Seaborn has a number of in-built functions to add extra background features to the plots. The seaborn.set() function is used to set different background to the distribution plots.
Seaborn具有许多内置功能,可以为绘图添加额外的背景功能。 seaborn.set() function用于为分布图设置不同的背景。
Syntax:
句法:
seaborn.set(style)
Example:
范例 :
import numpy as np
import seaborn as sn
import matplotlib.pyplot as plt
sn.set(style='dark',)
data = np.random.randn(500)

plot = sn.distplot(data)

plt.show()
Output:
输出:
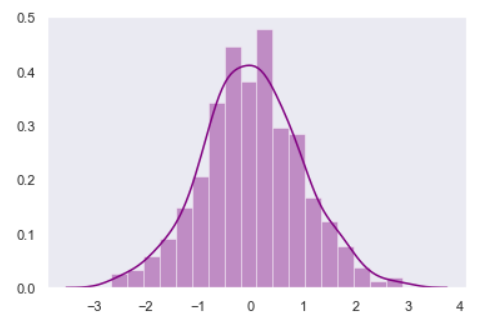
将自定义颜色设置为Seaborn DistPlot (Setting Custom color to Seaborn DistPlot)
We can set different colors to the distplot to add to the visualization of the data using the ‘color‘ parameter of the seaborn.distplot() function.
我们可以使用seaborn.distplot()函数的' color '参数为distplot设置不同的颜色,以增加数据的可视化效果。
Syntax:
句法:
seaborn.distplot(data, color='color')
Example:
例:
import numpy as np
import seaborn as sn
import matplotlib.pyplot as plt

sn.set(style='dark',)
data = np.random.randn(500)
plot = sn.distplot(data,color='purple')

plt.show()
Output:
输出:
结论 (Conclusion)
Thus, Seaborn Module along with Matplotlib module helps in the data visualization and depicts the distribution of data.
因此,Seaborn模块与Matplotlib模块一起有助于数据的可视化并描述数据的分布。
I strongly recommend all the readers to read the Python Matplotlib Module to understand the basics of Data Visualization.
我强烈建议所有读者阅读Python Matplotlib模块,以了解数据可视化的基础。
参考资料 (References)
seaborn


 8631
8631

 被折叠的 条评论
为什么被折叠?
被折叠的 条评论
为什么被折叠?
 到【灌水乐园】发言


