


 本文详细介绍了Python的Pandas库,包括安装、数据结构、DataFrame的使用,如导入CSV数据、检查数据、排序、切片、过滤、重命名列以及数据整理。Pandas提供强大的数据处理功能,如合并、分组和串联,适用于数据科学和数据分析。此外,还讨论了如何通过字典创建DataFrame以及如何选择、添加和删除列。
Python Pandas模块 (Python Pandas Module)
- Pandas is an open source library in Python. It provides ready to use high-performance data structures and data analysis tools. Pandas是Python中的开源库。 它提供了随时可用的高性能数据结构和数据分析工具。
- Pandas module runs on top of NumPy and it is popularly used for data science and data analytics. Pandas模块在NumPy之上运行,并且广泛用于数据科学和数据分析。
- NumPy is a low-level data structure that supports multi-dimensional arrays and a wide range of mathematical array operations. Pandas has a higher-level interface. It also provides streamlined alignment of tabular data and powerful time series functionality. NumPy是一种低级数据结构,它支持多维数组和广泛的数学数组运算。 熊猫具有更高级别的界面。 它还提供了表格数据的简化对齐和强大的时间序列功能。
- DataFrame is the key data structure in Pandas. It allows us to store and manipulate tabular data as a 2-D data structure. DataFrame是Pandas中的关键数据结构。 它允许我们以2D数据结构形式存储和处理表格数据。
- Pandas provides a rich feature-set on the DataFrame. For example, data alignment, data statistics, slicing, grouping, merging, concatenating data, etc. 熊猫在DataFrame上提供了丰富的功能集。 例如,数据对齐,数据统计, 切片 ,分组,合并,串联数据等。
熊猫安装和入门 (Installing and Getting Started with Pandas)
You need to have Python 2.7 and above to install Pandas module.
您需要安装Python 2.7及更高版本才能安装Pandas模块。
If you are using conda, then you can install it using below command.
如果您使用的是conda ,则可以使用以下命令进行安装。
conda install pandasIf you are using PIP, then run the below command to install pandas module.
如果您使用的是PIP ,请运行以下命令来安装pandas模块。
pip3.7 install pandas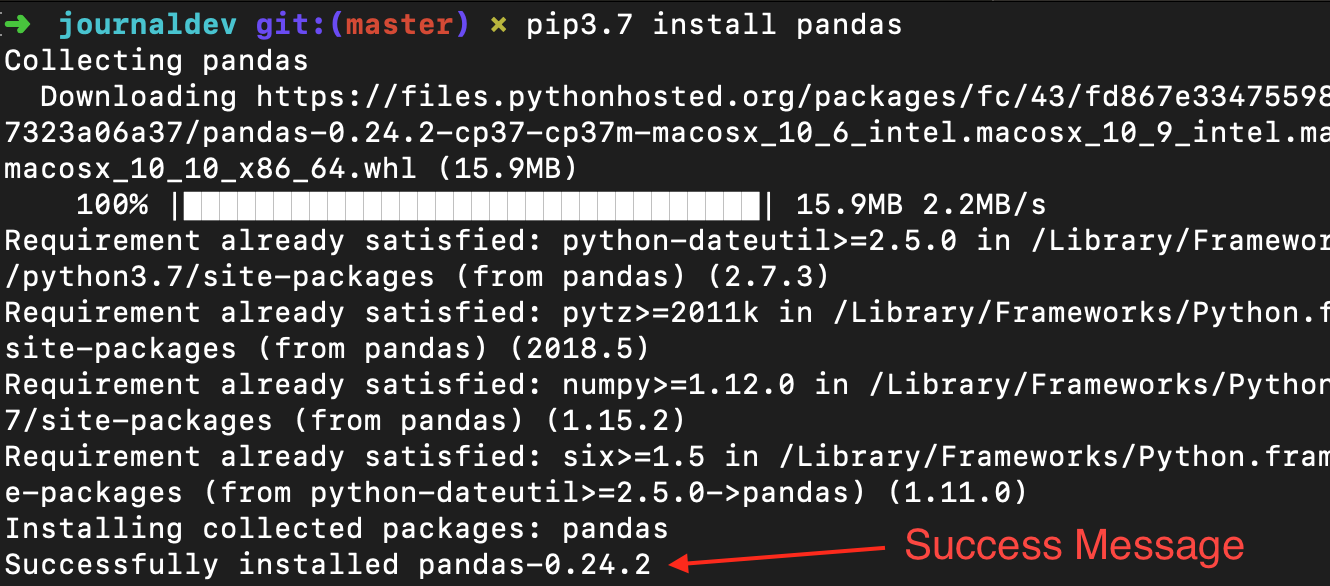
Python Install Pandas Module
Python安装熊猫模块
To import Pandas and NumPy in your Python script, add the below piece of code:
要在您的Python脚本中导入Pandas和NumPy,请添加以下代码:
import pandas as pd
import numpy as np
As Pandas is dependent on the NumPy library, we need to import this dependency.
由于Pandas依赖于NumPy库,因此我们需要导入此依赖关系。
熊猫模块中的数据结构 (Data Structures in Pandas module)
There are 3 data structures provided by the Pandas module, which are as follows:
Pandas模块提供了3种数据结构,如下所示:
- Series: It is a 1-D size-immutable array like structure having homogeneous data. 系列 :它是一维大小不变的数组,具有均匀的数据结构。
- DataFrames: It is a 2-D size-mutable tabular structure with heterogeneously typed columns. DataFrames :这是一个二维大小可变的表格结构,具有异构类型的列。
- Panel: It is a 3-D, size-mutable array. 面板 :这是一个3D,大小可变的数组。
熊猫数据框 (Pandas DataFrame)
DataFrame is the most important and widely used data structure and is a standard way to store data.
DataFrame是最重要且使用最广泛的数据结构,是存储数据的标准方法。
DataFrame has data aligned in rows and columns like the SQL table or a spreadsheet database.
DataFrame的数据按行和列对齐,例如SQL表或电子表格数据库。
We can either hard code data into a DataFrame or import a CSV file, tsv file, Excel file, SQL table, etc.
我们既可以将数据硬编码到DataFrame中,也可以导入CSV文件,tsv文件,Excel文件,SQL表等。
We can use the below constructor for creating a DataFrame object.
我们可以使用下面的构造函数创建一个DataFrame对象。
pandas.DataFrame(data, index, columns, dtype, copy)Below is a short description of the parameters:
以下是参数的简短说明:
- data – create a DataFrame object from the input data. It can be list, dict, series, Numpy ndarrays or even, any other DataFrame. 数据 –根据输入数据创建一个DataFrame对象。 它可以是列表,字典,系列,Numpy ndarray甚至其他任何DataFrame。
- index – has the row labels 索引 –具有行标签
- columns – used to create column labels 列 –用于创建列标签
- dtype – used to specify the data type of each column, optional parameter dtype –用于指定每列的数据类型,可选参数
- copy – used for copying data, if any 复制 –用于复制数据(如果有)
There are many ways to create a DataFrame. We can create DataFrame object from Dictionaries or list of dictionaries. We can also create it from a list of tuples, CSV, Excel file, etc.
有多种创建DataFrame的方法。 我们可以从字典或字典列表中创建DataFrame对象。 我们还可以从元组,CSV,Excel文件等的列表中创建它。
Let’s run a simple code to create a DataFrame from the list of dictionaries.
让我们运行一个简单的代码,从字典列表中创建一个DataFrame。
import pandas as pd
import numpy as np
df = pd.DataFrame({
    "State": ['Andhra Pradesh', 'Maharashtra', 'Karnataka', 'Kerala', 'Tamil Nadu'],
    "Capital": ['Hyderabad', 'Mumbai', 'Bengaluru', 'Trivandrum', 'Chennai'],
    "Literacy %": [89, 77, 82, 97,85],
    "Avg High Temp(c)": [33, 30, 29, 31, 32 ]
})
print(df)
Output:
输出:
The first step is to create a dictionary. The second step is to pass the dictionary as an argument in the DataFrame() method. The final step is to print the DataFrame.
第一步是创建字典。 第二步是将字典作为参数传递给DataFrame()方法。 最后一步是打印DataFrame。
As you see, the DataFrame can be compared to a table having heterogeneous value. Also, the size of the DataFrame can be modified.
如您所见,可以将DataFrame与具有异构值的表进行比较。 另外,可以修改DataFrame的大小。
We have supplied the data in the form of the map and the keys of the map are considered by Pandas as the row labels.
The index is displayed in the leftmost column and has the row labels. The column header and data are displayed in a tabular fashion.
索引显示在最左侧的列中,并具有行标签。 列标题和数据以表格形式显示。
It is also possible to create indexed DataFrames. This can be done by configuring the index parameter in the DataFrame() method.
也可以创建索引的DataFrame。 这可以通过在DataFrame()方法中配置index参数来完成。
将数据从CSV导入到DataFrame (Importing data from CSV to DataFrame)
We can also create a DataFrame by importing a CSV file. A CSV file is a text file with one record of data per line. The values within the record are separated using the “comma” character.
我们还可以通过导入CSV文件来创建DataFrame。 CSV文件是一个文本文件,每行有一个数据记录。 记录中的值使用“逗号”分隔。
Pandas provides a useful method, named read_csv() to read the contents of the CSV file into a DataFrame.
Pandas提供了一种名为read_csv()的有用方法,可将CSV文件的内容读取到DataFrame中。
For example, we can create a file named ‘cities.csv’ containing details of Indian cities. The CSV file is stored in the same directory that contains Python scripts. This file can be imported using:
例如,我们可以创建一个名为“ cities.csv”的文件,其中包含印度城市的详细信息。 CSV文件存储在包含Python脚本的目录中。 可以使用以下命令导入该文件:
import pandas as pd
data =  pd.read_csv('cities.csv')
print(data)
.
Our aim is to load data and analyze it to draw conclusions. So, we can use any convenient method to load the data. In this tutorial, we are hard-coding the data of the DataFrame.
。
我们的目标是加载数据并进行分析以得出结论。 因此,我们可以使用任何方便的方法来加载数据。 在本教程中,我们将对DataFrame的数据进行硬编码。
在DataFrame中检查数据 (Inspecting data in DataFrame)
Running the DataFrame using its name displays the entire table. In real-time, the datasets to analyze will have thousands of rows. For analyzing data, we need to inspect data from huge volumes of datasets. Pandas provide many useful functions to inspect only the data we need. We can use df.head(n) to get the first n rows or df.tail(n) to print the last n rows. For example, the below code prints the first 2 rows and last 1 row from the DataFrame.
使用其名称运行DataFrame将显示整个表。 实时地,要分析的数据集将具有数千行。 为了分析数据,我们需要检查来自大量数据集的数据。 熊猫提供了许多有用的功能,可以仅检查我们需要的数据。 我们可以使用df.head(n)获取前n行,或者使用df.tail(n)打印后n行。 例如,下面的代码打印DataFrame的前2行和后1行。
print(df.head(2))Output:
输出:
print(df.tail(1))Output:
输出:
Similarly, print(df.dtypes) prints the data types.
同样, print(df.dtypes)打印数据类型。
Output:
输出:
print(df.index) prints index.
print(df.index)打印索引。
Output:
输出:
print(df.columns) prints the columns of the DataFrame.
print(df.columns)打印print(df.columns)的列。
Output:
输出:
print(df.values) displays the table values.
print(df.values)显示表值。
Output:
输出:
1.获取记录的统计摘要 (1. Getting Statistical summary of records)
We can get statistical summary (count, mean, standard deviation, min, max etc.) of the data using df.describe() function. Now, let’s use this function, to display the statistical summary of “Literacy %” column. To do this, we may add the below piece of code:
我们可以使用df.describe()函数获得数据的统计摘要(计数,均值,标准差,最小值,最大值等)。 现在,让我们使用此功能来显示“识字率%”列的统计摘要。 为此,我们可以添加以下代码:
print(df['Literacy %'].describe())Output:
输出:
The df.describe() function displays the statistical summary, along with the data type.
df.describe()函数显示统计摘要以及数据类型。
2.排序记录 (2. Sorting records)
We can sort records by any column using df.sort_values() function. For example, let’s sort the “Literacy %” column in descending order.
我们可以使用df.sort_values()函数按任何列对记录进行排序。 例如,让我们按降序对“识字率%”列进行排序。
print(df.sort_values('Literacy %', ascending=False))Output:
输出:
3.切片记录 (3. Slicing records)
It is possible to extract data of a particular column, by using the column name. For example, to extract the ‘Capital’ column, we use:
通过使用列名,可以提取特定列的数据。 例如,要提取“资本”列,我们使用:
df['Capital']or
要么
(df.Capital)Output:
输出:
It is also possible to slice multiple columns. This is done by enclosing multiple column names enclosed in 2 square brackets, with the column names separated using commas. The following code slices the ‘State’ and ‘Capital’ columns of the DataFrame.
也可以切片多列。 这是通过将多个列名称括在2个方括号中来完成的,列名称之间用逗号分隔。 以下代码对DataFrame的“状态”和“资本”列进行了切片。
print(df[['State', 'Capital']])Output:
输出:
It is also possible to slice rows. Multiple rows can be selected using “:” operator. The below code returns the first 3 rows.
也可以切片行。 可以使用“:”运算符选择多行。 下面的代码返回前3行。
df[0:3]Output:
输出:
An interesting feature of Pandas library is to select data based on its row and column labels using iloc[0] function.
熊猫库的一个有趣功能是使用iloc[0]函数根据行和列标签选择数据。
Many times, we may need only few columns to analyze. We can also can select by index using loc['index_one']).
很多时候,我们可能只需要很少的列即可进行分析。 我们还可以使用loc['index_one'])通过索引进行选择。
For example, to select the second row, we can use df.iloc[1,:] .
例如,要选择第二行,我们可以使用df.iloc[1,:] 。
Let’s say, we need to select second element of the second column. This can be done by using df.iloc[1,1] function. In this example, the function df.iloc[1,1] displays “Mumbai” as output.
假设我们需要选择第二列的第二个元素。 这可以通过使用df.iloc[1,1]函数来完成。 在此示例中,函数df.iloc[1,1]显示“孟买”作为输出。
4.过滤数据 (4. Filtering data)
It is also possible to filter on column values. For example, below code filters the columns having Literacy% above 90%.
也可以根据列值进行过滤。 例如,以下代码过滤识字率高于90%的列。
print(df[df['Literacy %']>90])Any comparison operator can be used to filter, based on a condition.
可以使用任何比较运算符根据条件进行过滤。
Output:
输出:
Another way to filter data is using the isin. Following is the code to filter only 2 states ‘Karnataka’ and ‘Tamil Nadu’.
过滤数据的另一种方法是使用isin 。 以下是仅过滤2个州“ Karnataka”和“ Tamil Nadu”的代码。
print(df[df['State'].isin(['Karnataka', 'Tamil Nadu'])])Output:
输出:
5.重命名列 (5. Rename column)
It is possible to use the df.rename() function to rename a column. The function takes the old column name and new column name as arguments. For example, let’s rename the column ‘Literacy %’ to ‘Literacy percentage’.
可以使用df.rename()函数来重命名列。 该函数将旧列名和新列名作为参数。 例如,让我们将“扫盲百分比”列重命名为“扫盲百分比”。
df.rename(columns = {'Literacy %':'Literacy percentage'}, inplace=True)
print(df.head())
The argument `inplace=True` makes the changes to the DataFrame.
参数`inplace = True`对DataFrame进行更改。
Output:
输出:
6.数据整理 (6. Data Wrangling)
Data Science involves the processing of data so that the data can work well with the data algorithms. Data Wrangling is the process of processing data, like merging, grouping and concatenating.
数据科学涉及数据的处理,以便数据可以与数据算法很好地配合使用。 数据整理是处理数据的过程,例如合并,分组和串联。
The Pandas library provides useful functions like merge(), groupby() and concat() to support Data Wrangling tasks.
Pandas库提供了有用的功能,如merge() , groupby()和concat()以支持数据整理任务。
Let’s create 2 DataFrames and show the Data Wrangling functions to understand it better.
让我们创建2个DataFrame,并显示Data Wrangling函数以更好地理解它。
import pandas as pd

d = {
    'Employee_id': ['1', '2', '3', '4', '5'],
    'Employee_name': ['Akshar', 'Jones', 'Kate', 'Mike', 'Tina']
}
df1 = pd.DataFrame(d, columns=['Employee_id', 'Employee_name'])
print(df1)
Output:
输出:
Let’s create the second DataFrame using the below code:
让我们使用以下代码创建第二个DataFrame:
import pandas as pd

data = {
    'Employee_id': ['4', '5', '6', '7', '8'],
    'Employee_name': ['Meera', 'Tia', 'Varsha', 'Williams', 'Ziva']
}
df2 = pd.DataFrame(data, columns=['Employee_id', 'Employee_name'])
print(df2)
Output:
输出:
一个。 合并中 (a. Merging)
Now, let’s merge the 2 DataFrames we created, along the values of ‘Employee_id’ using the merge() function:
现在,让我们使用merge()函数merge()创建的两个DataFrame与'Employee_id'的值merge() :
print(pd.merge(df1, df2, on='Employee_id'))Output:
输出:
We can see that merge() function returns the rows from both the DataFrames having the same column value, that was used while merging.
我们可以看到merge()函数从合并时使用的具有相同列值的两个DataFrames中返回行。
b。 分组 (b. Grouping)
Grouping is a process of collecting data into different categories. For example, in the below example, the “Employee_Name” field has the name “Meera” two times. So, let’s group it by “Employee_name” column.
分组是将数据收集到不同类别的过程。 例如,在下面的示例中,“ Employee_Name”字段的名称两次为“ Meera”。 因此,让我们按“ Employee_name”列对其进行分组。
import pandas as pd
import numpy as np

data = {
    'Employee_id': ['4', '5', '6', '7', '8'],
    'Employee_name': ['Meera', 'Meera', 'Varsha', 'Williams', 'Ziva']
}
df2 = pd.DataFrame(data)

group = df2.groupby('Employee_name')
print(group.get_group('Meera'))
The ‘Employee_name’ field having value ‘Meera’ is grouped by the column “Employee_name”. The sample output is as below:
值“ Meera”的“ Employee_name”字段按“ Employee_name”列分组。 示例输出如下:
Output:
输出:
C。 级联 (c. Concatenating)
Concatenating data involves to add one set of data to other. Pandas provides a function named concat() to concatenate DataFrames. For example, let’s concatenate the DataFrames df1 and df2 , using :
串联数据涉及将一组数据添加到另一组。 Pandas提供了一个名为concat()的函数来连接DataFrame。 例如,让我们使用以下命令将DataFrames df1和df2连接起来:
print(pd.concat([df1, df2]))Output:
输出:
通过传递Series的Dict创建一个DataFrame (Create a DataFrame by passing Dict of Series)
To create a Series, we can use the pd.Series() method and pass an array to it. Let’s create a simple Series as follows:
要创建一个Series,我们可以使用pd.Series()方法并将一个数组传递给它。 让我们创建一个简单的Series,如下所示:
series_sample = pd.Series([100, 200, 300, 400])
print(series_sample)
Output:
输出:
We have created a Series. You can see that 2 columns are displayed. The first column contains the index values starting from 0. The second column contains the elements passed as series.
我们创建了一个系列。 您会看到显示了两列。 第一列包含从0开始的索引值。第二列包含作为系列传递的元素。
It is possible to create a DataFrame by passing a dictionary of `Series`. Let’s create a DataFrame that is formed by uniting and passing the indexes of the series.
可以通过传递“系列”的字典来创建DataFrame。 让我们创建一个通过组合并传递该系列的索引而形成的DataFrame。
Example
例
d = {'Matches played' : pd.Series([400, 300, 200], index=['Sachin', 'Kohli', 'Raina']),
'Position' : pd.Series([1, 2, 3, 4], index=['Sachin', 'Kohli', 'Raina', 'Dravid'])}
df = pd.DataFrame(d)
print(df)
Sample output
样品输出
For series one, as we have not specified label ‘d’, NaN is returned.
对于第一个系列,由于未指定标签'd',因此返回NaN。
列选择,添加,删除 (Column Selection, Addition, Deletion)
It is possible to select a specific column from the DataFrame. For example, to display only the first column, we can re-write the above code as:
可以从DataFrame中选择特定的列。 例如,仅显示第一列,我们可以将以上代码重写为:
d = {'Matches played' : pd.Series([400, 300, 200], index=['Sachin', 'Kohli', 'Raina']),
 'Position' : pd.Series([1, 2, 3, 4], index=['Sachin', 'Kohli', 'Raina', 'Dravid'])}
df = pd.DataFrame(d)
print(df['Matches played'])
The above code prints only the “Matches played” column of the DataFrame.
上面的代码仅打印DataFrame的“已玩的比赛”列。
Output
输出量
It is also possible to add columns to an existing DataFrame. For example, the below code adds a new column named “Runrate” to the above DataFrame.
也可以将列添加到现有DataFrame中。 例如,下面的代码将一个名为“ Runrate”的新列添加到上面的DataFrame中。
d = {'Matches played' : pd.Series([400, 300, 200], index=['Sachin', 'Kohli', 'Raina']),
 'Position' : pd.Series([1, 2, 3, 4], index=['Sachin', 'Kohli', 'Raina', 'Dravid'])}
df = pd.DataFrame(d)
df['Runrate']=pd.Series([80, 70, 60, 50], index=['Sachin', 'Kohli', 'Raina', 'Dravid'])
print(df)
Output:
输出:
We can delete columns using the `delete` and `pop` functions. For example to delete the ‘Matches played’ column in the above example, we can do it by either of the below 2 ways:
我们可以使用`delete`和`pop`函数删除列。 例如,要删除上面示例中的“参加比赛”列,我们可以通过以下两种方式之一进行:
del df['Matches played']or
要么
df.pop('Matches played')Output:
输出:
结论 (Conclusion)
In this tutorial, we had a brief introduction to the Python Pandas library. We also did hands-on examples to unleash the power of the Pandas library used in the field of data science. We also went through the different Data Structures in the Python library.
在本教程中,我们简要介绍了Python Pandas库。 我们还亲身实践了一些实例,以释放数据科学领域中使用的Pandas库的功能。 我们还介绍了Python库中的不同数据结构。
Reference: Pandas Official Website
参考: 熊猫官方网站
翻译自: https://www.journaldev.com/29055/python-pandas-module-tutorial


 255
255

 被折叠的 条评论
为什么被折叠?
被折叠的 条评论
为什么被折叠?
 到【灌水乐园】发言


