


arduino小车
这篇文章描述了如何将Android智能手机连接到Ubidots,以便智能手机读取从Arduino发送的数据。 在上一篇文章中,我们探讨了如何将Arduino连接到Ubidots,以便具有温度和湿度传感器的Arduino板将数据发送到Ubidots 。 在本文中,我们将开发一个使用Ubidots服务的Android应用程序,以获取Arduino发送的信息。
此外,Android应用程序不仅可以读取数据,还可以使用图表显示数据。 为此,该应用程序使用MPAndroidChart库,这是一个开放源代码库,用于在Android中创建图表。
要开发android应用,必须:
- 处理HTTP连接以向Ubidots服务器发出REST请求
- 处理JSON格式以读取数据
- 使用MPAndroidChart根据检索到的数据创建图表
此外, Android应用程序将使用Material设计。最终结果如下所示:
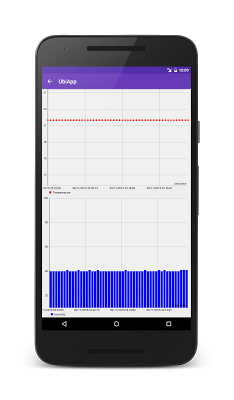

Ubidots Android客户端
即使Ubidots提供了一个客户端来处理REST请求,它也不令我满意,所以我更愿意基于OkHttp库开发一个自定义客户端。 处理HTTP请求的类称为UbidotsClient 。
客户端使用身份验证令牌对应用进行身份验证以交换数据和变量ID,以选择要读取的变量。 如果您还记得的话,我们在上一篇文章中谈到了这两个项目。
HTTP客户端非常简单:
OkHttpClient client = new OkHttpClient();
Request req = new Request.Builder().addHeader("X-Auth-Token", apiKey)
          .url("http://things.ubidots.com/api/v1.6/variables/" + varId + "/values")
          .build();

client.newCall(req).enqueue(new Callback() {
     @Override
     public void onFailure(Request request, IOException e) {
        Log.d("Chart", "Network error");
        e.printStackTrace();
     }

     @Override
     public void onResponse(Response response) throws IOException {
       // Here we handle the response
     }
}
在第2行, Android应用将身份验证令牌添加到HTTP请求标头中。
在第3行,应用程序调用了Ubidots提供的服务,并传递了我们要读取值的变量id。
最后,在第5行,应用程序发出HTTP请求并等待响应。 OkHTTP客户端的一个有趣方面是,它在一个单独的线程中处理请求,因此我们不必担心ANR问题。
在JSON中解析Ubidots响应
当android应用使用REST作为Ubidots服务调用远程服务时,它会得到一个JSON响应,该响应必须进行解析,以便可以提取信息。
Ubidots响应非常简单,它是由JSON数组组成的,每个项目都包含两个值:变量值本身和时间戳。
考虑到此信息,JSON解析非常简单:在onResponse中,或者换句话说,当响应可用时,应用程序解析JSON:
@Override
public void onResponse(Response response) throws IOException {
    String body = response.body().string();
    Log.d("Chart", body);

    try {
        JSONObject jObj = new JSONObject(body);
        JSONArray jRes = jObj.getJSONArray("results");
        for (int i=0; i < jRes.length(); i++) {
            JSONObject obj = jRes.getJSONObject(i);
            Value val = new Value();
            val.timestamp = obj.getLong("timestamp");
            val.value  = (float) obj.getDouble("value");
            results.add(val);
        }

        listener.onDataReady(results);

    }
    catch(JSONException jse) {
        jse.printStackTrace();
    }

} body包含作为字符串的JSON响应。 在第7到14行,应用程序解析JSON数组并创建一个简单的类,其中包含已解析的每个元素的值和时间戳:
protected static class Value {
    float value;
    long timestamp;
}
最后,在第17行,解析器将结果通知给主类,以便绘制图表。
Android中带有MPAndroidChart的图表
一旦数据可用,Android应用程序即可绘制图表。 为此,我们使用MPAndroidChart。 第一步是在成绩文件中添加依赖项
dependencies {
    compile fileTree(dir: 'libs', include: ['*.jar'])
    testCompile 'junit:junit:4.12'
    compile 'com.android.support:appcompat-v7:23.1.1'
    compile 'com.github.PhilJay:MPAndroidChart:v2.1.6'
    compile 'com.android.support:support-v4:23.1.1'
    compile 'com.squareup.okhttp:okhttp:2.6.0'
}
为此,我们使用一个保存图表的android片段。 布局非常简单,可用的屏幕分为两个区域:一个保存温度图表,另一个保存湿度图表。 布局如下图所示:
<LinearLayout xmlns:android="http://schemas.android.com/apk/res/android"
    xmlns:tools="http://schemas.android.com/tools"
    android:layout_width="match_parent"
    android:layout_height="match_parent"
    tools:context="com.survivingwithandroid.ubiapp.ChartFragment"
    android:orientation="vertical">

    <com.github.mikephil.charting.charts.LineChart
        android:id="@+id/chartTemp"
        android:layout_width="match_parent"
        android:layout_height="0dp"
        android:layout_weight="1"/>

    <com.github.mikephil.charting.charts.BarChart
        android:id="@+id/chartPress"
        android:layout_width="match_parent"
        android:layout_height="0dp"
        android:layout_weight="1"/>
</LinearLayout>
在调用Ubidots客户端之前,应用程序将初始化图表属性:
private void initChartTemp(LineChart chart) {
    chart.setTouchEnabled(true);
    chart.setDrawGridBackground(true);
    chart.getAxisRight().setEnabled(false);
    chart.setDrawGridBackground(true);

    YAxis leftAxis = chart.getAxisLeft();
    leftAxis.setAxisMaxValue(30F);
    leftAxis.setAxisMinValue(10F);
    leftAxis.setStartAtZero(false);
    leftAxis.setAxisLineWidth(2);
    leftAxis.setDrawGridLines(true);

    // X-Axis
    XAxis xAxis = chart.getXAxis();
    xAxis.resetLabelsToSkip();
    xAxis.setPosition(XAxis.XAxisPosition.BOTTOM);
    xAxis.setDrawGridLines(true);
}
在7-12行,应用程序设置Y轴,设置最小和最大范围保险库,而在15-18行,应用程序配置X轴
现在,Android应用程序已准备好调用Ubidots客户端,如上所示:
( new UbidotsClient() ).handleUbidots(tempVarId, API_KEY, new UbidotsClient.UbiListener() {
            @Override
            public void onDataReady(List result) {
                Log.d("Chart", "======== On data Ready ===========");
                List entries = new ArrayList();
                List labels = new ArrayList();
                for (int i=0; i < result.size(); i++) {

                    Entry be = new Entry(result.get(i).value, i);
                    entries.add(be);
                    Log.d("Chart", be.toString());
                    // Convert timestamp to date
                    Date d = new Date(result.get(i).timestamp);
                    // Create Labels
                    labels.add(sdf.format(d));
                }

                LineDataSet lse = new LineDataSet(entries, "Tempearature");

                lse.setDrawHighlightIndicators(false);
                lse.setDrawValues(false);
                lse.setColor(Color.RED);
                lse.setCircleColor(Color.RED);
                lse.setLineWidth(1f);
                lse.setCircleSize(3f);
                lse.setDrawCircleHole(false);
                lse.setFillAlpha(65);
                lse.setFillColor(Color.RED);

                LineData ld = new LineData(labels, lse);

                tempChart.setData(ld);
                Handler handler = new Handler(ChartFragment.this.getActivity().getMainLooper());
                handler.post(new Runnable() {
                    @Override
                    public void run() {
                        tempChart.invalidate();
                    }
                });

            }
}); 在此代码段中,应用程序创建了LineDataSet ,用于绘制值。 相同的步骤适用于绘制湿度图。
在本文的最后,您学习了如何使用Android应用程序从Ubidots检索数据,以及如何使用Arduino通过DHT11传感器发送的值使用MPAndroidChart绘制图表。
arduino小车


 1585
1585

 被折叠的 条评论
为什么被折叠?
被折叠的 条评论
为什么被折叠?
 到【灌水乐园】发言


