


grafana 安装&启动
grafana官网下载安装:https://grafana.com/grafana/download
百度云地址:
链接:https://pan.baidu.com/s/1SwZkX_IRNxLPak7pqNR0JQ
提取码:0000
安装
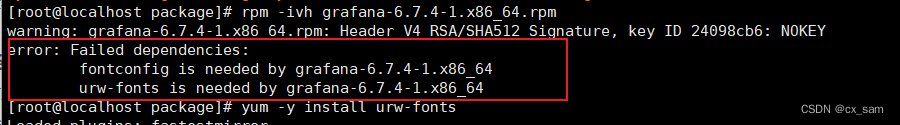
输入命令:rpm -ivh grafana-6.7.4-1.x86_64.rpm
ps: 如安装显示需要依赖,使用 yum安装
键入: yum install -y urw-fonts
** 启动**
启动服务键入: service grafana-server start / systemctl start grafana-server
查看状态键入: service grafana-server status / systemctl status grafana-server
后台程序重新加载键入: systemctl daemon-reload
开机启用键入:systemctl enable grafana-server
访问&登录:http://ip:3000 user:admin password: admin
redis_exporter 安装
安装
Github下载地址: https://github.com/oliver006/redis_exporter/releases
百度云链接:https://pan.baidu.com/s/1AnRGSdUA9s_GKRi2zfv_dQ
提取码:0000
解压键入: tar -xzvf package -C route
启动
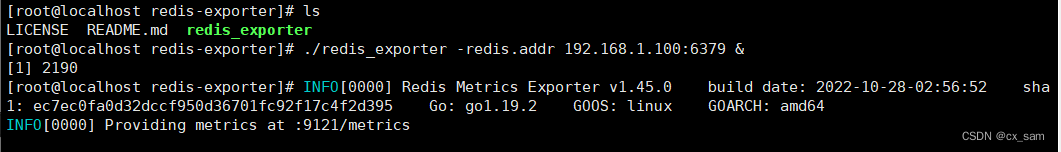
以守进程的方式启动键入:./redis_exporter -redis.addr 192.168.1.100:6379 &
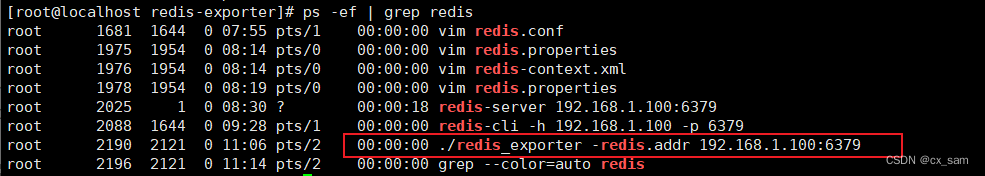
检测:ps -ef | grep redis
mysqld_exporter 安装
** 下载**
下载地址:https://prometheus.io/download/
链接:https://pan.baidu.com/s/1hxypJdrdQBeTq1CenwqncQ
提取码:0000
解压
tar -xzvf packge -C /other
1.创建配置文件
touch my.cnf 文件
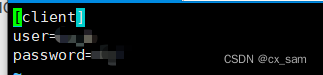
2.编辑文件,在文件内配置数据库信息
[client]
user=xxx
password=xxx
3.启动服务
./mysqld_exporter --config.my-cnf=./my.cnf &

linux node_exporter 安装
** 下载**
下载地址:https://prometheus.io/download/
链接:https://pan.baidu.com/s/1ibCYM6zJGZCMjZNDkfUwmw
提取码:0000
解压
tar -xzvf packge -C /other
启动
./node_exporter
给rc.local执行的权限
sudo chmod +x /etc/rc.local
启用服务
sudo systemctl enable rc-local.service
开启服务
sudo systemctl start rc-local.service
查看服务状态
sudo systemctl status rc-local.service
Prometheus
安装
官网下载:https://prometheus.io/docs/introduction/overview/
百度云链接:https://pan.baidu.com/s/1y6EjhqnV1uBUzvQdPAB7Tw
提取码:0000
配置
编辑文件键入:vim prometheus.yml
添加配置:
- job_name: ‘job name’
static_configs:- targets: [‘xxx.xxx.xxx.xxx:xxxx’]
启动
键入: ./prometheus &
常用模板 :redis 763 mysql 7362 linux 10180


 407
407


 被折叠的 条评论
为什么被折叠?
被折叠的 条评论
为什么被折叠?
 到【灌水乐园】发言


