


首先需要写一个爬虫将双色球开奖数据抓下来,找到了这个网站
http://datachart.500.com/ssq/
默认只显示最近30期的中奖号码

找到网站的所有中奖号码接口,
http://datachart.500.com/ssq/history/newinc/history.php?start=00001&end=18081
用浏览器打开是这个样子的
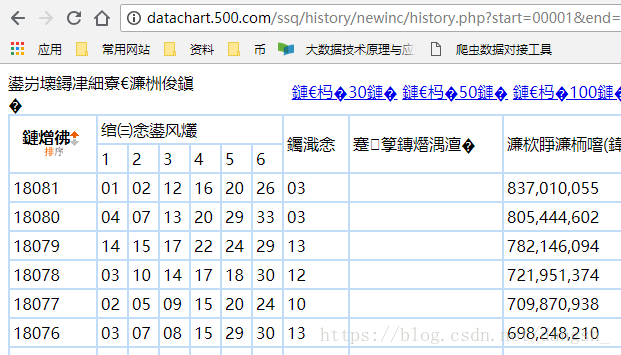
中文乱码了,不过无所谓,我们只需要数字
接下来开始获取这些数据,代码如下
import requests
from lxml import etree
url = "http://datachart.500.com/ssq/history/newinc/history.php?start=00001&end=18081"
response = requests.get(url)
response = response.text
selector = etree.HTML(response)
for i in selector.xpath('//tr[@class="t_tr1"]'):
datetime = i.xpath('td/text()')[0]
red = i.xpath('td/text()')[1:7]
blue = i.xpath('td/text()')[7]
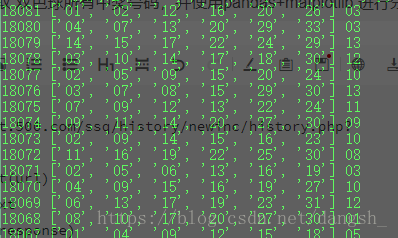
print(datetime,red,blue)效果如下,成功获取到了中奖号码
接下来用到pandas进行数据分析,统计每一个号码出现的次数
我们首先将红球中奖号码和篮球中奖号码分别放入两个数组中,并且将它们转化为Series,代码如下
import requests
from lxml import etree
import matplotlib.pyplot as plt
from pandas import Series

url = "http://datachart.500.com/ssq/history/newinc/history.php?start=00001&end=18081"
response = requests.get(url)
response = response.text
selector = etree.HTML(response)
reds = []
blues = []
for i in selector.xpath('//tr[@class="t_tr1"]'):
    datetime = i.xpath('td/text()')[0]
    red = i.xpath('td/text()')[1:7]
    blue = i.xpath('td/text()')[7]
    for i in red:
        reds.append(i)
    blues.append(blue)

s_blues = Series(blues)
s_blues = s_blues.value_counts()
s_reds = Series(reds)
s_reds = s_reds.value_counts()
print(s_blues)
打印蓝色球测试,结果如下
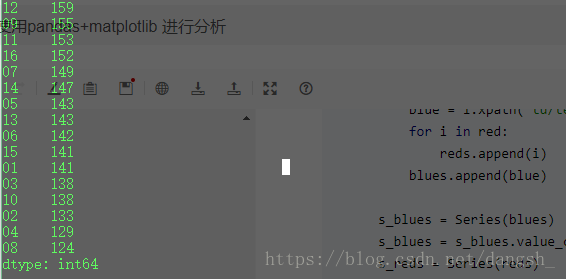
左边是蓝球的号码,右边是出现的次数,红色球也同理,但是这样看起来还不够直观,我们使用matplotlib进行绘图
只需要这样一段代码
import matplotlib.pyplot as plt
labels = s_blues.index.tolist()
sizes = s_blues.values.tolist()
rect = plt.bar(range(len(sizes)) , sizes , tick_label = labels)
plt.show()
效果如下
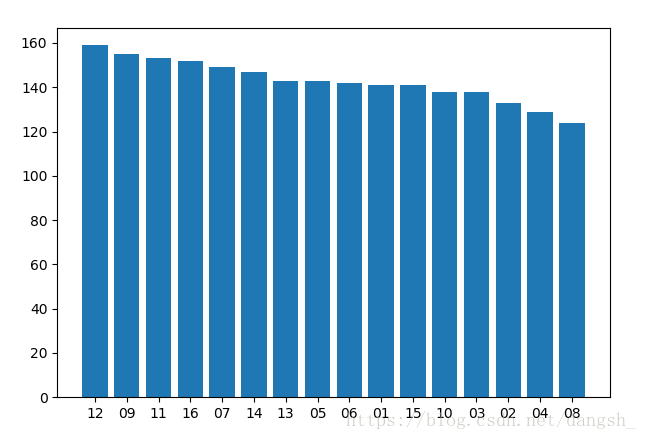
这样就可以很直观的看出哪个号码出现的频率最高了,但是这样无法显示准确的出现次数,我们需要加一个方法来让它显示。
def autolabel(rects):
    for rect in rects:
        height = rect.get_height()
        plt.text(rect.get_x(), 1.02*height, "%s" % height)


labels = s_blues.index.tolist()
sizes = s_blues.values.tolist()
rect = plt.bar(range(len(sizes)) , sizes , tick_label = labels)
autolabel(rect)
plt.show()
效果如下图
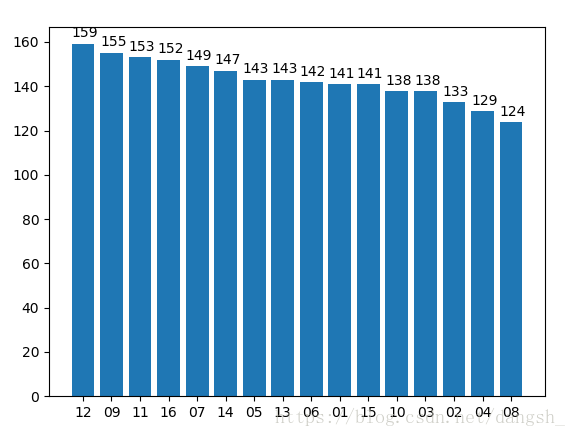
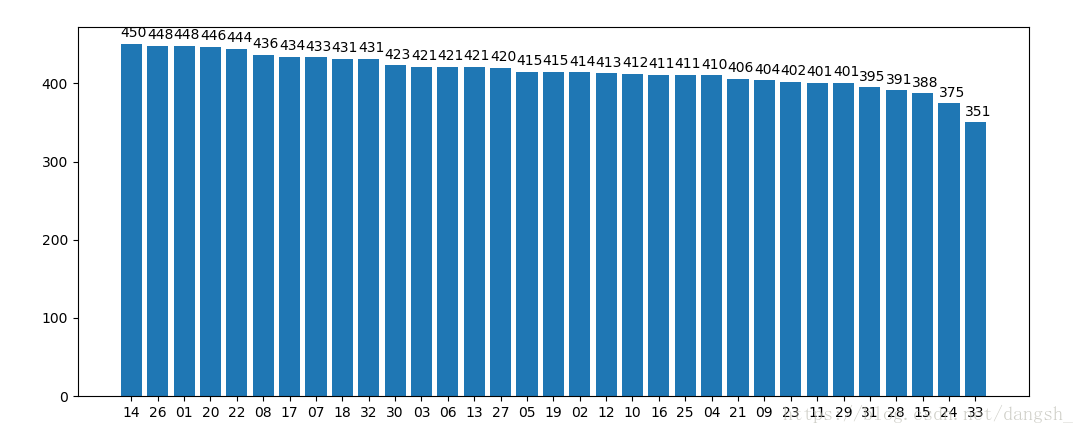
这样就更加清晰了。红球的图如下,方法类似就不做赘述
总之,最后的结果是
中奖率最高的几个号码是
01 08 14 20 22 26 + 12
仅供参考,如果有人中奖请记得联系我。
完整的代码如下
import requests
from lxml import etree
import matplotlib.pyplot as plt
from pandas import Series

url = "http://datachart.500.com/ssq/history/newinc/history.php?start=00001&end=18081"
response = requests.get(url)
response = response.text
selector = etree.HTML(response)
reds = []
blues = []
for i in selector.xpath('//tr[@class="t_tr1"]'):
    datetime = i.xpath('td/text()')[0]
    red = i.xpath('td/text()')[1:7]
    blue = i.xpath('td/text()')[7]
    for i in red:
        reds.append(i)
    blues.append(blue)

s_blues = Series(blues)
s_blues = s_blues.value_counts()
s_reds = Series(reds)
s_reds = s_reds.value_counts()

def autolabel(rects):
    for rect in rects:
        height = rect.get_height()
        plt.text(rect.get_x(), 1.02*height, "%s" % height)


labels = s_blues.index.tolist()
sizes = s_blues.values.tolist()
rect = plt.bar(range(len(sizes)) , sizes , tick_label = labels)
autolabel(rect)
plt.show()

labels2 = s_reds.index.tolist()
sizes2 = s_reds.values.tolist()
rect2 = plt.bar(range(len(sizes2)), sizes2 , tick_label = labels2)
autolabel(rect2)
plt.show()
github地址是
https://github.com/dangsh/hive/blob/master/newSpider/lottery/double.py
对爬虫感兴趣的朋友可以看一下我的其它文章或者github上的hive项目~希望对你们有所帮助


 3万+
3万+

 被折叠的 条评论
为什么被折叠?
被折叠的 条评论
为什么被折叠?
 到【灌水乐园】发言


