


目录
首先我们要先对Matlab这款软件的画图功能给予肯定,画图功能太强大了,所以其也被广泛的应用到绘制图形,Matlab的画图功能有以下几个优点:
- 简单易用:提供了简洁的绘图接口
- 多样性:支持绘制各种类型的图形
- 灵活性:提供了丰富的图形参数和功能
- 交互性:可以通过鼠标交互式的探索和操作图形
- 高质量输出:绘制的图形具有较高的质量
来,我们开整!!!
1.plot()函数
语法1:
plot(x,y)%创建y中数据对x中对应值的二维线图- 要绘制由线段连接的一组坐标,请将x和y指定为相同长度的向量
- 要将同一组坐标上绘制多组坐标,请将x或y中的至少一个指定为矩阵
>> x=0:pi/10:2*pi;
>> y=sin(x);
>> plot(x,y)
语法2:
plot(y)%绘制y对一组隐式x的坐标- 如果y是向量,则x的坐标范围从1到length(y)
- 如果y是矩阵,则对于y中的每个列,图中包含一个对应的行
plot(cos(0:pi/20:2*pi))
语法三:
plot(y,Linespec)%使用隐式x的坐标绘制y,并指定线型、标记和颜色>> x=0:pi/10:2*pi;
>> y=sin(x);
>> plot(y,'or:')
2. hold(添加新绘图是否保留旧绘图)
hold on: 添加新绘图时保留旧绘图,新绘图基于坐标区的 ColorOrder 和 LineStyleOrder 属性使用后续的颜色和线型。
hold off(默认): 将保留状态设置为off,添加新绘图时,不会保留旧绘图,新添加到坐标区中的绘图清除现有绘图并重置所有的坐标区属性
我们现在单画一个图示例:
>> plot(y,'or:');
>> plot(cos(0:pi/20:2*pi))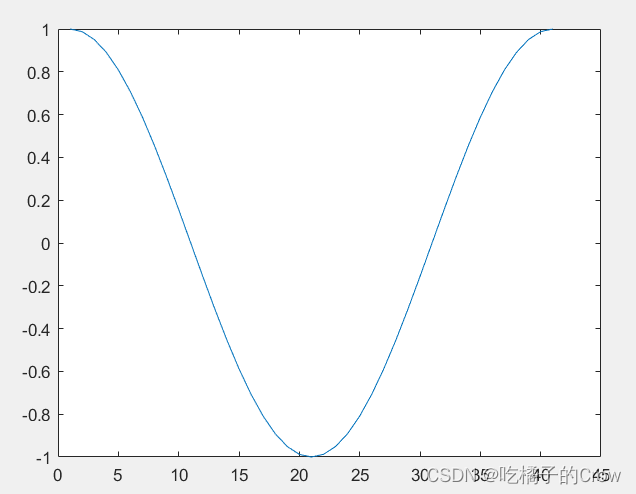
因为我们这个时候hold还是处于默认关闭状态,所以我们不能将两个图在一张画布上进行呈现,当我们打开后
>> hold on我们再运行上述代码,就会发现已经可以按照我们的预期呈现出来了
>> plot(y,'or:');
>> plot(cos(0:pi/20:2*pi))
3. Plot Style
使用str中定义的格式绘制每个向量对(x,y)
3.1 线型

3.2 标记

3.3 颜色

4. legend()
在我们画图中的过程中,因为一块画布上我们 需要画很多个图形,那么怎么识别哪个图形是哪个函数的呢?legend()函数就完美解决了这个问题
>> x=0:0.5:4*pi;
y=sin(x); h=cos(x); w=1./(1+exp(-x));
g=(1/(2*pi*2)^0.5).*exp((-1.*(x-2*pi).^2)./(2*2^2));
plot(x,y,'bd-',x,h,'gp:',x,w,'ro-',x,g,'c^-');
当我们加上legend()之后:
legend('sin(x)','cos(x)','Sigmoid','Gauss function');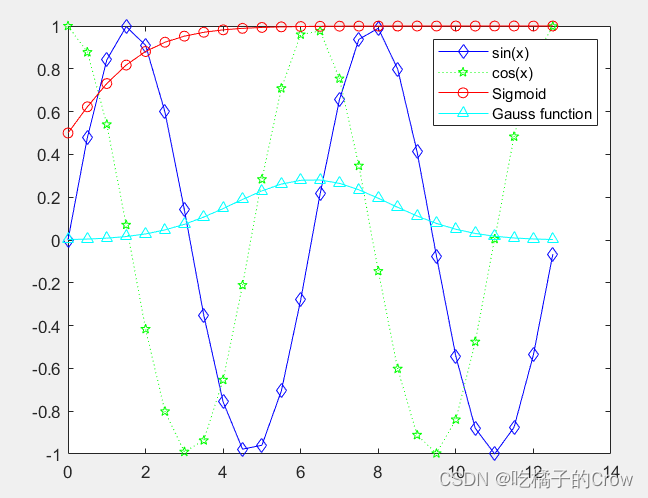
5.X 、Y and Title?
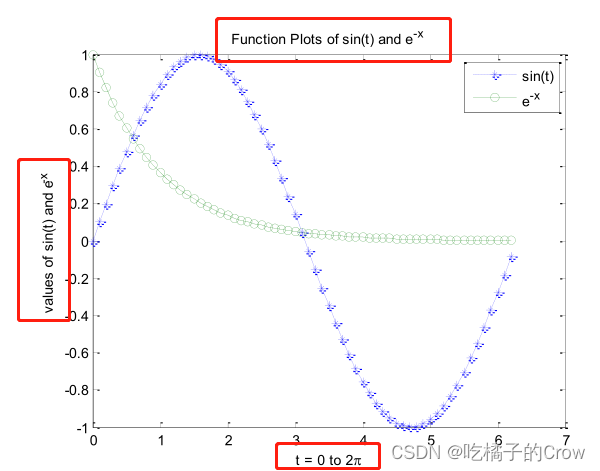
在画图中x轴、y轴和图名我们应该怎么去设置呢?
title()%标题
xlabel()%x坐标
ylabel()%y坐标
zlabel()%z坐标
x = 0:0.1:2*pi; y1 = sin(x); y2 = exp(-x);
plot(x, y1, '--*', x, y2, ':o');
xlabel('t = 0 to 2\pi');%2π=2\pi
ylabel('values of sin(t) and e^{-x}')%e^-x =e^{-x}
title('Function Plots of sin(t) and e^{-x}');
legend('sin(t)','e^{-x}');
6. Text()和annotation()
文本与数学表达式使用的是LaTex,它是一种专业的排版系统,其优点是:
- 专业的排版质量:LaTeX以其卓越的排版能力而闻名,通过使用LaTeX,用户可以创建高质量、格式美观的文档,自动处理字体样式、大小、段落布局、数学公式、引用等排版细节。
- 数学公式排版:LaTeX是科学和数学排版的首选工具,在排版复杂的数学公式和符号方面有着出色的表现。它提供了丰富的数学环境和符号库,使输入和排版数学公式更加容易。
- 逻辑结构化:LaTeX允许将文档轻松划分为章节,自动生成目录和页眉/页脚,便于管理大型文档。另外,结构化的章节划分可以提高文档的可读性和可维护性。
- 版本控制和协作:LaTeX文档本质上是纯文本文件,可与版本控制系统(如Git)集成,进行版本管理和协作编辑。这对于团队协作和多作者文档编写非常有用。
- 跨平台兼容性:基于TeX的LaTeX几乎可以在所有操作系统上运行,包括Windows、Mac和Linux。这使得轻易在不同操作系统上协作或分享LaTeX文档成为可能。
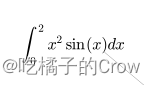
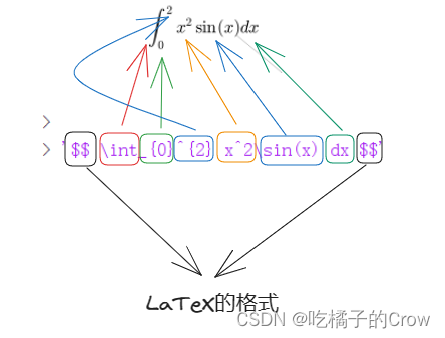
我们如果利用LaTeX去生成这么一个定积分式子?
x = linspace(0,3); y = x.^2.*sin(x); plot(x,y);
line([2,2],[0,2^2*sin(2)]);
str = '$$ \int_{0}^{2} x^2\sin(x) dx $$';
text(0.25,2.5,str,'Interpreter','latex');%(0.25,2.5)文本出现的位置
annotation('arrow','X',[0.32,0.5],'Y',[0.6,0.4]);%[0.32,0.5]x坐标从整个图形32%的地方到50%的地方(左->右) [0.6,0.4]y坐标从60%的地方到40%的地方(上->下)
7.line(创建基本线条)
7.1 基本语法
语法1:
line(x,y) line(x,y) 使用向量 x 和 y 中的数据在当前坐标区中绘制线条。如果 x 和 y 中有一个是矩阵或两者都是矩阵,则 line 将绘制多个线条。与 plot 函数不同,line 会向当前坐标区添加线条,而不删除其他图形对象或重置坐标区属性
- 使用向量数据绘制线条
%以向量的形式创建x、y,然后绘制y对x的图
x = linspace(0,10);
y = sin(x);
line(x,y)
- 使用矩阵数据绘制多个线条
%通过将 x 和 y 指定为矩阵来绘制两个线条。使用 line 绘制 y 的列对 x 的列的单独线条。
x = linspace(0,10)';
y = [sin(x) cos(x)];
line(x,y)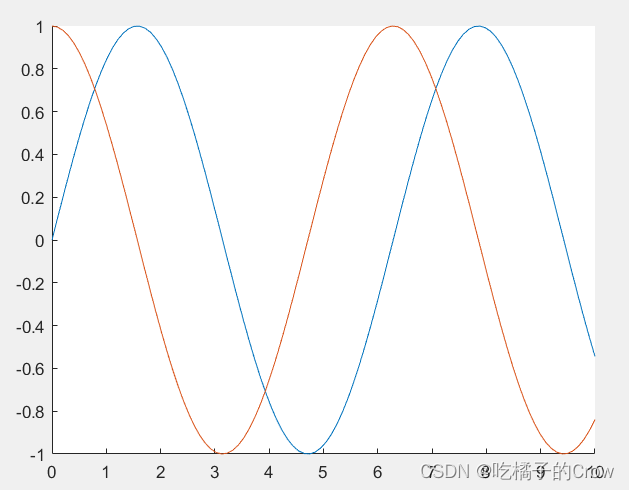
语法2:
line(x,y,z) 在三维坐标中绘制线条。%通过指定 x、y 和 z 的值,在三维坐标中绘制线条。使用 view(3) 将坐标区更改为三维视图。
t = linspace(0,10*pi,200);
x = sin(t);
y = cos(t);
z = t;
line(x,y,z)
view(3)
7.2 指定线条属性
我们想给绘制的线段加点颜色以及形状应该怎么操作?
在点 (1,2) 和 (9,12) 之间绘制一条红色虚线。将
Color和LineStyle属性设置为名称-值对组。
x = [1 9];
y = [2 12];
line(x,y,'Color','red','LineStyle','--')
7.3 更改线条属性
x = [3 2];
y = [15 12];
pl = line(x,y);
pl.Color = 'green';
pl.LineStyle = '--';
8.图像属性
图形对象(万物皆可对象),图形是由许多物体组成的

我们可以直接在图形界面进行查看:
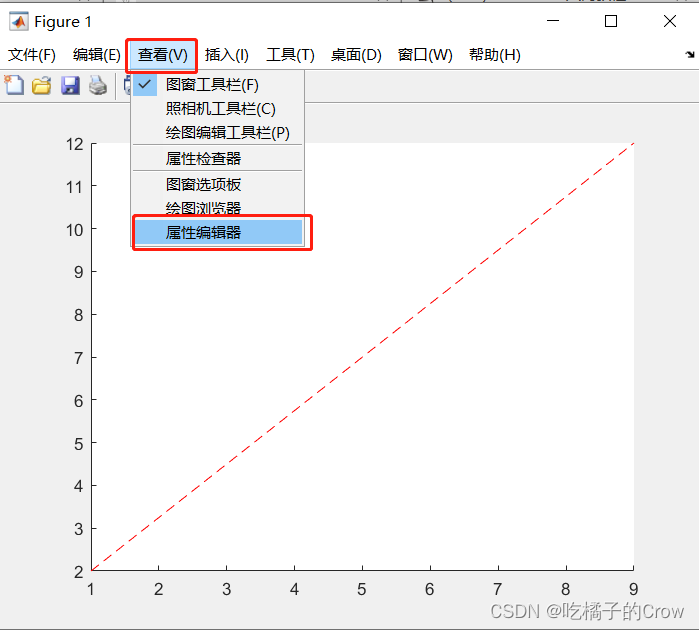
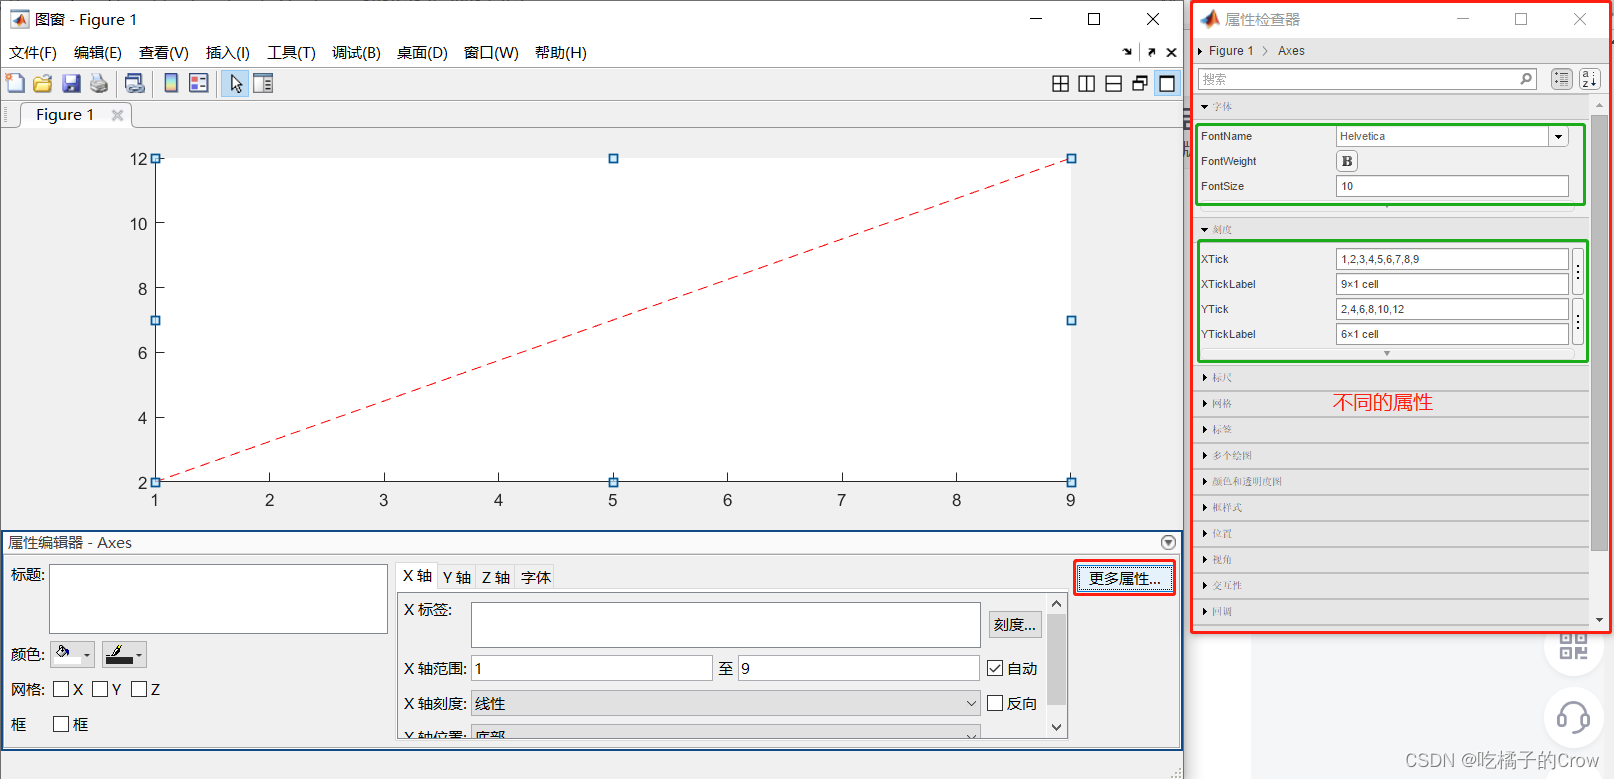
一个图像有这么多属性,我们如何去修改其属性,使得图像变得更加具有观赏性呢?
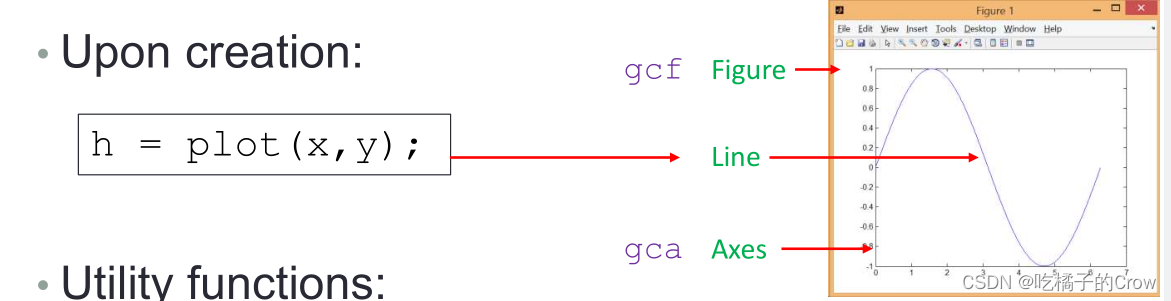
gca:ax = gca 返回当前图窗中的当前坐标区(或独立可视化)。使用 ax 获取和设置当前坐标区的属性。如果当前图窗中没有坐标区或图,则 gca 会创建一个笛卡尔坐标区对象。
gcf:fig = gcfgcf 将创建一个图窗并返回其句柄。可以使用图窗句柄查询和修改图窗的属性。
8.1 获取对象属性
获取图形对象的属性:get()
>> x = linspace(0, 2*pi, 1000);
y = sin(x); h = plot(x,y);
获得h的属性:
>> get(h)
    AlignVertexCenters: 'off'
            Annotation: [1×1 matlab.graphics.eventdata.Annotation]
          BeingDeleted: 'off'
            BusyAction: 'queue'
         ButtonDownFcn: ''
              Children: [0×0 GraphicsPlaceholder]
              Clipping: 'on'
                 Color: [0 0.4470 0.7410]
             ColorMode: 'auto'
             CreateFcn: ''
       DataTipTemplate: [1×1 matlab.graphics.datatip.DataTipTemplate]
             DeleteFcn: ''
           DisplayName: ''
      HandleVisibility: 'on'
               HitTest: 'on'
         Interruptible: 'on'
              LineJoin: 'round'
             LineStyle: '-'
         LineStyleMode: 'auto'
             LineWidth: 0.5000
                Marker: 'none'
       MarkerEdgeColor: 'auto'
       MarkerFaceColor: 'none'
         MarkerIndices: [1×1000 uint64]
            MarkerMode: 'auto'
            MarkerSize: 6
                Parent: [1×1 Axes]
         PickableParts: 'visible'
              Selected: 'off'
    SelectionHighlight: 'on'
                   Tag: ''
                  Type: 'line'
         UIContextMenu: [0×0 GraphicsPlaceholder]
              UserData: []
               Visible: 'on'
                 XData: [1×1000 double]
             XDataMode: 'manual'
           XDataSource: ''
                 YData: [1×1000 double]
           YDataSource: ''
                 ZData: [1×0 double]
           ZDataSource: ''
获得坐标轴的属性:
>> get(gca)
                       ALim: [0 1]
                   ALimMode: 'auto'
     ActivePositionProperty: 'outerposition'
                 AlphaScale: 'linear'
                   Alphamap: [1×64 double]
          AmbientLightColor: [1 1 1]
               BeingDeleted: 'off'
                        Box: 'on'
                   BoxStyle: 'back'
                 BusyAction: 'queue'
              ButtonDownFcn: ''
                       CLim: [0 1]
                   CLimMode: 'auto'
             CameraPosition: [3.5000 0 17.3205]
         CameraPositionMode: 'auto'
               CameraTarget: [3.5000 0 0]
           CameraTargetMode: 'auto'
             CameraUpVector: [0 1 0]
         CameraUpVectorMode: 'auto'
            CameraViewAngle: 6.6086
        CameraViewAngleMode: 'auto'
                   Children: [1×1 Line]
                   Clipping: 'on'
              ClippingStyle: '3dbox'
                      Color: [1 1 1]
                 ColorOrder: [7×3 double]
            ColorOrderIndex: 2
                 ColorScale: 'linear'
                   Colormap: [256×3 double]
                  CreateFcn: ''
               CurrentPoint: [2×3 double]
            DataAspectRatio: [3.5000 1 1]
        DataAspectRatioMode: 'auto'
                  DeleteFcn: ''
                  FontAngle: 'normal'
                   FontName: 'Helvetica'
                   FontSize: 10
               FontSizeMode: 'auto'
              FontSmoothing: 'on'
                  FontUnits: 'points'
                 FontWeight: 'normal'
                  GridAlpha: 0.1500
              GridAlphaMode: 'auto'
                  GridColor: [0.1500 0.1500 0.1500]
              GridColorMode: 'auto'
              GridLineStyle: '-'
           HandleVisibility: 'on'
                    HitTest: 'on'
               Interactions: [1×1 matlab.graphics.interaction.interface.DefaultAxesInteractionSet]
              Interruptible: 'on'
    LabelFontSizeMultiplier: 1.1000
                      Layer: 'bottom'
                     Layout: [0×0 matlab.ui.layout.LayoutOptions]
                     Legend: [0×0 GraphicsPlaceholder]
             LineStyleOrder: '-'
        LineStyleOrderIndex: 1
                  LineWidth: 0.5000
             MinorGridAlpha: 0.2500
         MinorGridAlphaMode: 'auto'
             MinorGridColor: [0.1000 0.1000 0.1000]
         MinorGridColorMode: 'auto'
         MinorGridLineStyle: ':'
                   NextPlot: 'replace'
              OuterPosition: [0 0 1 1]
                     Parent: [1×1 Figure]
              PickableParts: 'visible'
         PlotBoxAspectRatio: [1 0.7882 0.7882]
     PlotBoxAspectRatioMode: 'auto'
                   Position: [0.1300 0.1100 0.7750 0.8150]
                 Projection: 'orthographic'
                   Selected: 'off'
         SelectionHighlight: 'on'
                 SortMethod: 'childorder'
                        Tag: ''
                    TickDir: 'in'
                TickDirMode: 'auto'
       TickLabelInterpreter: 'tex'
                 TickLength: [0.0100 0.0250]
                 TightInset: [0.0510 0.0527 0.0071 0.0200]
                      Title: [1×1 Text]
    TitleFontSizeMultiplier: 1.1000
            TitleFontWeight: 'normal'
                    Toolbar: [1×1 AxesToolbar]
                       Type: 'axes'
              UIContextMenu: [0×0 GraphicsPlaceholder]
                      Units: 'normalized'
                   UserData: []
                       View: [0 90]
                    Visible: 'on'
                      XAxis: [1×1 NumericRuler]
              XAxisLocation: 'bottom'
                     XColor: [0.1500 0.1500 0.1500]
                 XColorMode: 'auto'
                       XDir: 'normal'
                      XGrid: 'off'
                     XLabel: [1×1 Text]
                       XLim: [0 7]
                   XLimMode: 'auto'
                 XMinorGrid: 'off'
                 XMinorTick: 'off'
                     XScale: 'linear'
                      XTick: [0 1 2 3 4 5 6 7]
                 XTickLabel: {8×1 cell}
             XTickLabelMode: 'auto'
         XTickLabelRotation: 0
                  XTickMode: 'auto'
                      YAxis: [1×1 NumericRuler]
              YAxisLocation: 'left'
                     YColor: [0.1500 0.1500 0.1500]
                 YColorMode: 'auto'
                       YDir: 'normal'
                      YGrid: 'off'
                     YLabel: [1×1 Text]
                       YLim: [-1 1]
                   YLimMode: 'auto'
                 YMinorGrid: 'off'
                 YMinorTick: 'off'
                     YScale: 'linear'
                      YTick: [-1 -0.8000 -0.6000 -0.4000 -0.2000 0 0.2000 0.4000 0.6000 0.8000 1]
                 YTickLabel: {11×1 cell}
             YTickLabelMode: 'auto'
         YTickLabelRotation: 0
                  YTickMode: 'auto'
                      ZAxis: [1×1 NumericRuler]
                     ZColor: [0.1500 0.1500 0.1500]
                 ZColorMode: 'auto'
                       ZDir: 'normal'
                      ZGrid: 'off'
                     ZLabel: [1×1 Text]
                       ZLim: [-1 1]
                   ZLimMode: 'auto'
                 ZMinorGrid: 'off'
                 ZMinorTick: 'off'
                     ZScale: 'linear'
                      ZTick: [-1 0 1]
                 ZTickLabel: ''
             ZTickLabelMode: 'auto'
         ZTickLabelRotation: 0
                  ZTickMode: 'auto'
获得当前图窗的属性:
>> get(gcf)
                 Alphamap: [1×64 double]
             BeingDeleted: 'off'
               BusyAction: 'queue'
            ButtonDownFcn: ''
                 Children: [1×1 Axes]
                 Clipping: 'on'
          CloseRequestFcn: 'closereq'
                    Color: [0.9400 0.9400 0.9400]
                 Colormap: [256×3 double]
                CreateFcn: ''
              CurrentAxes: [1×1 Axes]
         CurrentCharacter: ''
            CurrentObject: [0×0 GraphicsPlaceholder]
             CurrentPoint: [0 0]
                DeleteFcn: ''
             DockControls: 'on'
                 FileName: ''
        GraphicsSmoothing: 'on'
         HandleVisibility: 'on'
            InnerPosition: [851.4000 158.6000 560 420]
            IntegerHandle: 'on'
            Interruptible: 'on'
           InvertHardcopy: 'on'
              KeyPressFcn: ''
            KeyReleaseFcn: ''
                  MenuBar: 'figure'
                     Name: ''
                 NextPlot: 'add'
                   Number: 1
              NumberTitle: 'on'
            OuterPosition: [844.2000 151.4000 574.4000 508.8000]
         PaperOrientation: 'portrait'
            PaperPosition: [3.0917 9.2937 14.8167 11.1125]
        PaperPositionMode: 'auto'
                PaperSize: [21.0000 29.7000]
                PaperType: 'A4'
               PaperUnits: 'centimeters'
                   Parent: [1×1 Root]
                  Pointer: 'arrow'
        PointerShapeCData: [16×16 double]
      PointerShapeHotSpot: [1 1]
                 Position: [851.4000 158.6000 560 420]
                 Renderer: 'opengl'
             RendererMode: 'auto'
                   Resize: 'on'
               Scrollable: 'off'
            SelectionType: 'normal'
           SizeChangedFcn: ''
                      Tag: ''
                  ToolBar: 'auto'
                     Type: 'figure'
            UIContextMenu: [0×0 GraphicsPlaceholder]
                    Units: 'pixels'
                 UserData: []
                  Visible: 'on'
      WindowButtonDownFcn: ''
    WindowButtonMotionFcn: ''
        WindowButtonUpFcn: ''
        WindowKeyPressFcn: ''
      WindowKeyReleaseFcn: ''
     WindowScrollWheelFcn: ''
              WindowState: 'minimized'
              WindowStyle: 'normal'
8.2 修改属性
8.2.1 修改轴的限制
修改图像的属性:set()
x = linspace(0, 2*pi, 1000);
y = sin(x); h = plot(x,y);

我们现在需要对坐标轴属性进行修改
set(gca, 'XLim', [0, 2*pi]);
set(gca, 'YLim', [-1.2, 1.2]);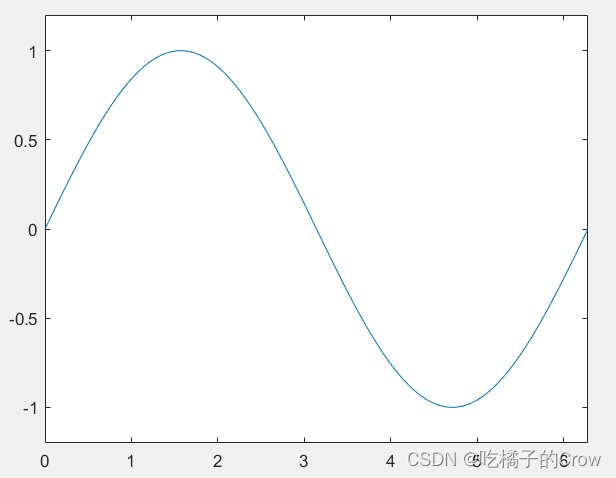
我们已经发现坐标轴已经有了明显的变化
8.2.2 设置轴的字体和刻度
set(gca, 'FontSize', 25);
>> set(gca, 'XTick', 0:pi/2:2*pi);
set(gca, 'XTickLabel', 0:90:360);
8.2.3 修改线条格式以及宽度
>> set(h, 'LineStyle', '-.',...
'LineWidth', 7.0, 'Color', 'g');
我们还可以使用这种方式进行替换:
plot(x,y, '-.g',...
'LineWidth', 7.0);
如果我们想删除这个图像怎么操作?
delete(h)
这样是不是和你想的一样呢?
8.3 标记规范
x=rand(20,1); set(gca, 'FontSize', 18);
plot(x,'-md','LineWidth', 2, 'MarkerEdgeColor', 'k',...
'MarkerFaceColor', 'g', 'MarkerSize', 10);
xlim([1, 20]);
9.图像共存
9.1figure
>> x = -10:0.1:10;
y1 = x.^2 - 8;
y2 = exp(x);
%创建两张画布
figure, plot(x,y1);
figure, plot(x,y2);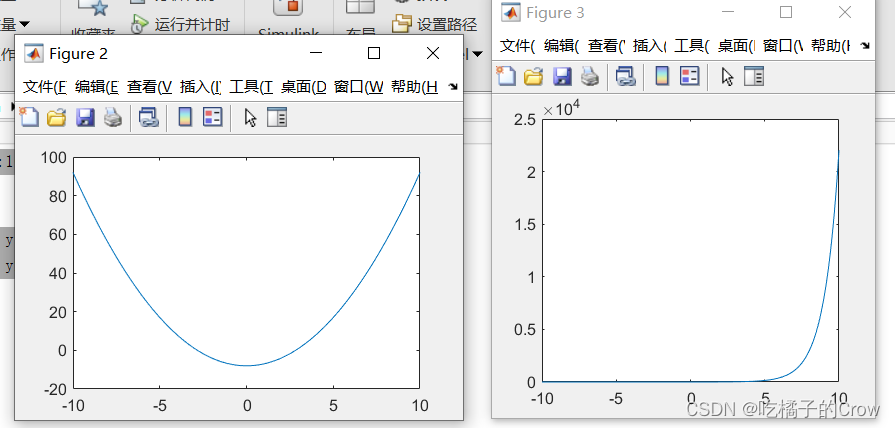
图像的位置和尺寸:
figure('Position', [left, bottom, width, height]);
示例:
>> figure('Position',[200,300,500,500])
9.2 subplot
那我们可不可以在一张画布中分出几块区域分别进行存储:
subplot(m, n,1);
示例:
>> subplot(2, 2,1);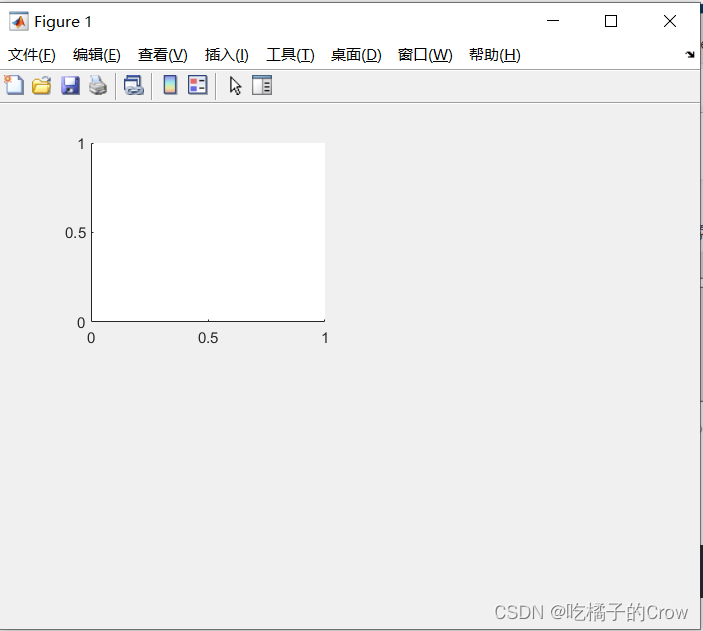
>> t = 0:0.1:2*pi; x = 3*cos(t); y = sin(t);
subplot(2, 2, 1); plot(x, y); axis normal%还原默认行为
subplot(2, 2, 2); plot(x, y); axis square%使用相同长度的坐标轴线,相应调整数据单位之间的增量
subplot(2, 2, 3); plot(x, y); axis equal%沿每个坐标轴使用相同的数据单位长度
subplot(2, 2, 4); plot(x, y); axis equal tight%将坐标轴范围设置为等同数据范围,使轴框紧密围绕数据
9.3 控制网格、框和轴
| grid on/off | 使网格可见或不可见 |
| box on/off | 使盒子可见或者不可见 |
| axis on/off | 使坐标轴可见或不可见 |
| axis normal | 自动调整轴的长宽和数据单位的相对缩放 |
| axis square | 使当前坐标区域为正方形 |
| axis equal | 设置高宽比,使数据单元在每个方向上都是相同的 |
| axis equal tight | 将轴限制设置为数据的范围 |
| axis image | 图框紧紧地围绕着数据 |
| axis ij | 将坐标系统的原点放在左上角 |
| axis xy | 把原点放在左下角 |
>> box off
grid on%网格
>> axis off%使得坐标轴不可见
10. 将数据保存在文件中


10.1print()
但是我们一般保存文件的时候用的最多的还是print()函数
print('picture','-dpng')
- 语法1:
print(filename,formattype) 使用指定的文件格式将当前图窗保存到文件中,例如 print('BarPlot','-dpng')。如果该文件不包括扩展名,则 print 会附加适用的扩展名。
- 语法2:
print(filename,formattype,formatoptions)%指定可用于某些格式的其他选项。- 语法3:
print('-clipboard',clipboardformat)使用 clipboardformat 指定的格式将当前图窗复制到剪贴板。您可以将复制的图窗粘贴到其他应用程序中
- 语法4:
print(resolution,___)使用指定的分辨率。将分辨率指定为字符向量或字符串,其中包含以 -r 开头的整数值,例如 '-r200'。此选项可与先前语法中的任何输入参数一起使用。


 3113
3113

 被折叠的 条评论
为什么被折叠?
被折叠的 条评论
为什么被折叠?
 到【灌水乐园】发言


