Continuous Wavelet Transform(连续小波变换)
下面的小例子是使用obspy内置例程(基于[Kristekova2006].)的连续小波变换。
import numpy as np

import matplotlib.pyplot as plt


import obspy

from obspy.imaging.cm import obspy_sequential

from obspy.signal.tf_misfit import cwt


st = obspy.read()

tr = st[0]

npts = tr.stats.npts

dt = tr.stats.delta

t = np.linspace(0, dt * npts, npts)

f_min = 1

f_max = 50


scalogram = cwt(tr.data, dt, 8, f_min, f_max)


fig = plt.figure()

ax = fig.add_subplot(111)


x, y = np.meshgrid(

    t,

    np.logspace(np.log10(f_min), np.log10(f_max), scalogram.shape[0]))


ax.pcolormesh(x, y, np.abs(scalogram), cmap=obspy_sequential)

ax.set_xlabel("Time after %s [s]" % tr.stats.starttime)

ax.set_ylabel("Frequency [Hz]")

ax.set_yscale('log')

ax.set_ylim(f_min, f_max)

plt.show()
下面的小脚本使用mlpy包对2008年Yasur记录到的次声数据进行连续小波变换。关于小波的更多信息参考Wikipedia(其中的omega0因子这里记作sigma)。
import numpy as np

import matplotlib.pyplot as plt


import mlpy


import obspy

from obspy.imaging.cm import obspy_sequential


tr = obspy.read("https://examples.obspy.org/a02i.2008.240.mseed")[0]


omega0 = 8

wavelet_fct = "morlet"

scales = mlpy.wavelet.autoscales(N=len(tr.data), dt=tr.stats.delta, dj=0.05,

                                 wf=wavelet_fct, p=omega0)

spec = mlpy.wavelet.cwt(tr.data, dt=tr.stats.delta, scales=scales,

                        wf=wavelet_fct, p=omega0)

# approximate scales through frequencies

freq = (omega0 + np.sqrt(2.0 + omega0 ** 2)) / (4 * np.pi * scales[1:])


fig = plt.figure()

ax1 = fig.add_axes([0.1, 0.75, 0.7, 0.2])

ax2 = fig.add_axes([0.1, 0.1, 0.7, 0.60], sharex=ax1)

ax3 = fig.add_axes([0.83, 0.1, 0.03, 0.6])


t = np.arange(tr.stats.npts) / tr.stats.sampling_rate

ax1.plot(t, tr.data, 'k')


img = ax2.imshow(np.abs(spec), extent=[t[0], t[-1], freq[-1], freq[0]],

                 aspect='auto', interpolation='nearest', cmap=obspy_sequential)

# Hackish way to overlay a logarithmic scale over a linearly scaled image.

twin_ax = ax2.twinx()

twin_ax.set_yscale('log')

twin_ax.set_xlim(t[0], t[-1])

twin_ax.set_ylim(freq[-1], freq[0])

ax2.tick_params(which='both', labelleft=False, left=False)

twin_ax.tick_params(which='both', labelleft=True, left=True, labelright=False)


fig.colorbar(img, cax=ax3)


plt.show()
Time Frequency Misfit(时频失配)
tf_misfit模块提供了几种基于[Kristekova2006] 和 [Kristekova2009]的时频错位函数。这里几个例子展示了如何使用其包含的绘制工具。
import numpy as np


from obspy.signal.tf_misfit import plot_tfr


# general constants

tmax = 6.

dt = 0.01

npts = int(tmax / dt + 1)

t = np.linspace(0., tmax, npts)


fmin = .5

fmax = 10


# constants for the signal

A1 = 4.

t1 = 2.

f1 = 2.

phi1 = 0.


# generate the signal

H1 = (np.sign(t - t1) + 1) / 2

st1 = A1 * (t - t1) * np.exp(-2 * (t - t1))

st1 *= np.cos(2. * np.pi * f1 * (t - t1) + phi1 * np.pi) * H1


plot_tfr(st1, dt=dt, fmin=fmin, fmax=fmax)
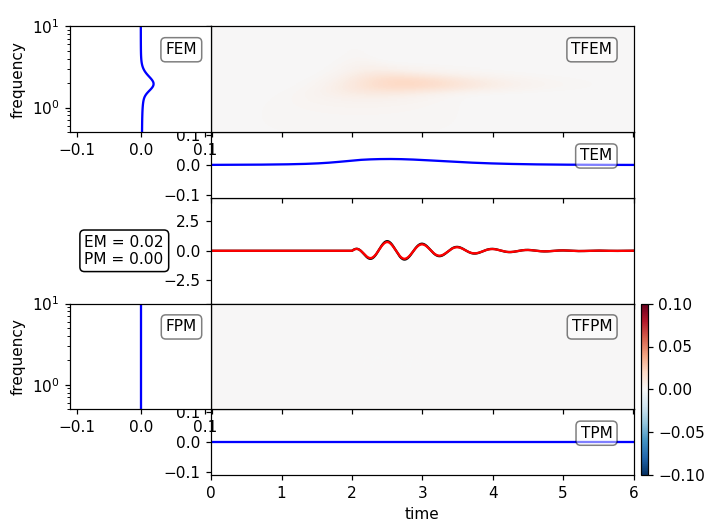
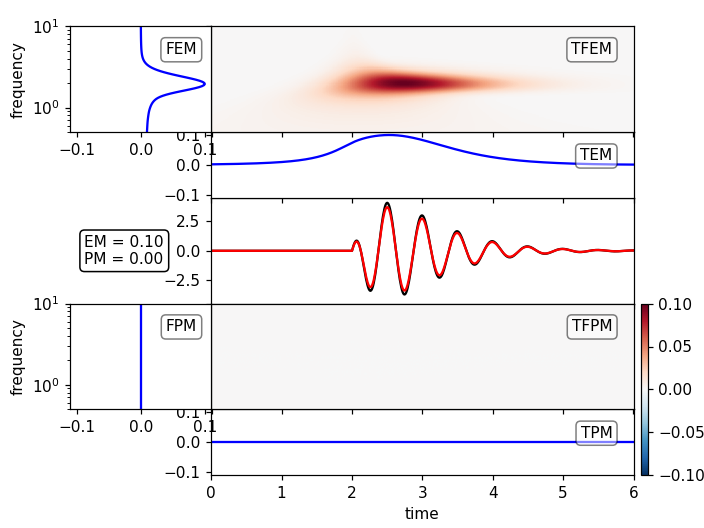
时频失配适用于信号的小差异,接着上面的例子:
from scipy.signal import hilbert

from obspy.signal.tf_misfit import plot_tf_misfits


# amplitude and phase error

phase_shift = 0.1

amp_fac = 1.1


# reference signal

st2 = st1.copy()


# generate analytical signal (hilbert transform) and add phase shift

st1p = hilbert(st1)

st1p = np.real(np.abs(st1p) * \

        np.exp((np.angle(st1p) + phase_shift * np.pi) * 1j))


# signal with amplitude error

st1a = st1 * amp_fac


plot_tf_misfits(st1a, st2, dt=dt, fmin=fmin, fmax=fmax, show=False)

plot_tf_misfits(st1p, st2, dt=dt, fmin=fmin, fmax=fmax, show=False)


plt.show()

时频失配适合于信号间的较大差异,接上面的例子:
from obspy.signal.tf_misfit import plot_tf_gofs


# amplitude and phase error

phase_shift = 0.8

amp_fac = 3.


# generate analytical signal (hilbert transform) and add phase shift

st1p = hilbert(st1)

st1p = np.real(np.abs(st1p) * \

        np.exp((np.angle(st1p) + phase_shift * np.pi) * 1j))


# signal with amplitude error

st1a = st1 * amp_fac


plot_tf_gofs(st1a, st2, dt=dt, fmin=fmin, fmax=fmax, show=False)

plot_tf_gofs(st1p, st2, dt=dt, fmin=fmin, fmax=fmax, show=False)


plt.show()

对于多组件数据和不匹配的全局归一化,坐标轴应相应地缩放。接上面的例子:
# amplitude error

amp_fac = 1.1


# reference signals

st2_1 = st1.copy()

st2_2 = st1.copy() * 5.

st2 = np.c_[st2_1, st2_2].T


# signals with amplitude error

st1a = st2 * amp_fac


plot_tf_misfits(st1a, st2, dt=dt, fmin=fmin, fmax=fmax)

局部归一化可以解决最大振幅波超出频率和时间的范围的问题,但是可能会在没有能量的区域中产生人为的影响。在该分析示例中,针对的是信号发生前的高频。为此需要手动设置限制:
# amplitude and phase error

amp_fac = 1.1


ste = 0.001 * A1 * np.exp(- (10 * (t - 2. * t1)) ** 2) \


# reference signal

st2 = st1.copy()


# signal with amplitude error + small additional pulse aftert 4 seconds

st1a = st1 * amp_fac + ste


plot_tf_misfits(st1a, st2, dt=dt, fmin=fmin, fmax=fmax, show=False)

plot_tf_misfits(st1a, st2, dt=dt, fmin=fmin, fmax=fmax, norm='local',

              clim=0.15, show=False)


plt.show()


 4576
4576

 被折叠的 条评论
为什么被折叠?


