


可视化管理dashboard中推荐指数:***
一、请参考Ceph集群搭建系列(一):Ceph 集群搭建 搭建一个集群
二、设置Ceph及配置mgr
1. 添加mgr
ceph-deploy mgr create ubuntu-sebre
ceph mgr module enable dashboard
查看状态
$ ceph -s
  cluster:
    id:     832e67c7-e0c8-45b1-b841-2f5df0d0dbe6
    health: HEALTH_WARN
            application not enabled on 1 pool(s)
            mon ubuntu-sebre is low on available space

  services:
    mon: 1 daemons, quorum ubuntu-sebre
    mgr: ubuntu-sebre(active)
    osd: 4 osds: 4 up, 4 in

  data:
    pools:   1 pools, 256 pgs
    objects: 9.71k objects, 37.9GiB
    usage:   41.9GiB used, 28.1GiB / 70GiB avail
    pgs:     256 active+clean
2. 更新配置文件来开启监控模块
在/etc/ceph/ceph.conf中添加
[mgr]
mgr modules = dashboard
3. 设置dashboard的ip和端口
ceph config-key put mgr/dashboard/server_addr 10.110.141.30
ceph config-key put mgr/dashboard/server_port 7000
这个从代码上看应该是可以支持配置文件方式的设置,目前还没看到具体的文档,先按这个设置即可,默认的端口是7000
4. 重启mgr服务
systemctl restart ceph-mgr@ubuntu-sebre5. 检查端口
|
三、访问luminous版本内置的dashboard
一共有四个大栏,Cluster health, Cluster(server\osds\configuration), Block(Mirroring\iSCSI\Pools), Filesystems()
1.HEALTH主页面
包括了集群的状态(ceph -s的可视版本)和 集群log

2.Cluster栏
Servers

OSDs

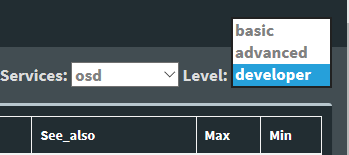
Configuration:
这里可以查看所有的配置,用户可以在右侧下拉框选择子section及config level

level:
3.Block栏的pool

4.Filesystem栏
由于我这里没有创建filesystem,显示not found
四、总结
从部署方便性来说,这个部署还是非常的方便的,而且走的是ceph原生接口,ceph通过增加一个mgr模块,可以把一些管理的功能独立出来,从而让mon自己做最重要的一些事情
目前的监控功能还比较少,主要是监控功能,未来应该会慢慢增加更多的功能,从产品角度来看,一个原生的UI监控使得ceph整个模块更加的完整了
参考:
/usr/lib64/ceph/mgr/dashboard/README.rst
ceph luminous 新功能之内置dashboard,推荐看武汉-运维-磨渣的博客blog


 4389
4389


 被折叠的 条评论
为什么被折叠?
被折叠的 条评论
为什么被折叠?
 到【灌水乐园】发言


