


折线图拐点改成空心圆
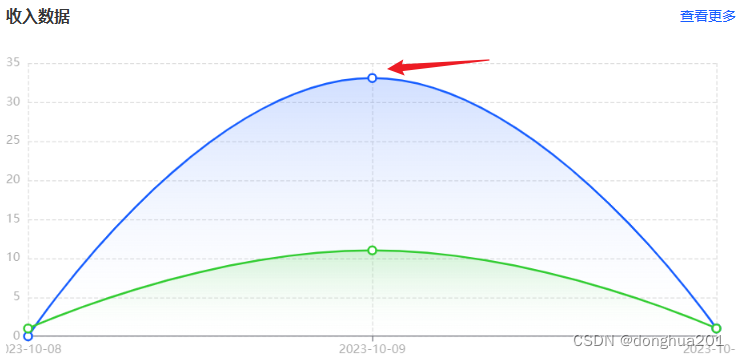
option -> series ->symbol属性设置为emptyCircle。注意series数组的每一行数据都要改symbol属性。
拐点为实心圆:symbol: 'circle'
拐点为空心圆:symbol: 'emptyCircle'
去掉拐点:symbol: 'none'
 const dataSet = {
    xAxis: {
    },
    yAxis: {
    },
    series: [
      {
        name: '本月',
        data: outArray,
        type: 'line',
        smooth: true,
        showSymbol: true,
        /* 修改symbol属性 */
        symbol: 'emptyCircle',
        symbolSize: 8,
        itemStyle: {
          normal: {
            borderColor,
            borderWidth: 1,
          },
        },
        areaStyle: {
          normal: {
            opacity: 0.1,
          },
        },
      },
      {
        name: '上月',
        data: inArray,
        type: 'line',
        smooth: true,
        showSymbol: true,
        /* 修改symbol属性 */
        symbol: 'emptyCircle',
        symbolSize: 8,
        itemStyle: {
          normal: {
            borderColor,
            borderWidth: 1,
          },
        },
        areaStyle: {
          normal: {
            opacity: 0.1,
          },
        },
      },
    ],
  };
自定义文本标签内容
改变标签内的文字样式(底框还是原生的颜色和样式)
非自定义formatter函数下,变量a、b、c在不同图表类型下代表数据含义为:
折线(区域)图、柱状(条形)图: a(系列名称),b(类目值),c(数值), d(无)
散点图(气泡)图 : a(系列名称),b(数据名称),c(数值数组), d(无)
饼图、雷达图 : a(系列名称),b(数据项名称),c(数值), d(百分比)
series: [
  {
    name: '交易方式',
    type: 'pie',
    radius: ['68%', '100%'],
    avoidLabelOverlap: true,
    selectedMode: true,
    hoverAnimation: true,
    silent: true,
    itemStyle: {
      borderColor: '#666',
      borderWidth: 1,
    },
    label: {
      // 这里是文本块的样式设置:
      show: true,
      position: 'center',
      // 1、非自定义formatter函数
      // 注意,换行仍是使用 '\n'。
      // formatter: ['{name|{b}占比}', '{value|{d}%}'].join('\n'),
      // rich 里是文本片段的样式设置:
      // rich: {
      //     value: {
      //       color: '#569333',
      //       fontSize: 28,
      //       fontWeight: 'normal',
      //       lineHeight: 46,
      //     },
      //     name: {
      //       color: '#909399',
      //       fontSize: 12,
      //       lineHeight: 14,
      //     },
      //   },

      // 2、自定义formatter函数
      formatter: (params) =>{ return `{a|交易笔数}\n\n{b|${params.bizTypeCount}}`},
      // rich 里是文本片段的样式设置:通过a,b指定对应的文字样式
      rich: {
        a: {
          fontSize: 14,
          lineHeight: 22,
          color: '#363636',
        },
        b: {
          fontSize: 20,
          fontWeight: 700,
          color: '#363636',
        },
      },
    },
    labelLine: {
      show: false,
    },
    data: [
      {
        value: 1048,
        name: '线上',
      },
      { value: radius * 7, name: '门店' },
    ],
  },
],
改变整个标签内容的样式
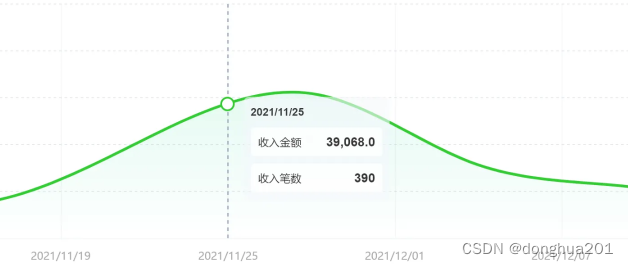
const options = {
  // 折线颜色
  color: ['#32CC32'],
  tooltip: {
    trigger: 'axis',
    // 提示框的底框背景色
    backgroundColor: 'rgba(244, 247, 252, 0.6)',
    // backgroundColor: 'red',
    borderWidth: 0,
    extraCssText: 'box-shadow:none;',
    formatter: (param) => {
      let { date, amount, count } = param[0].data;

      let dateStr = `<div style="font-weight:700;font-size:12px;color:#363636;">${date}</div>`;
      let amountStr = `<div style="
        display:flex;justify-content:space-between;
        background-color:rgba(255,255,255,0.8);width:176px;padding:8px;margin:10px 0;border-radius: 4px;color:#363636;><span style="font-size: 12px;">收入金额</span>
        <span style="font-size: 14px;font-weight:700;">${amount}</span>
</div>`;
      let countStr = `<div style="
display:flex;justify-content:space-between;
background-color:rgba(255,255,255,0.8);width:176px;padding:8px;border-radius: 4px;color:#363636;>
<span style="font-size: 12px;">收入笔数</span>
<span style="font-size: 14px;font-weight:700;">${count}</span>
</div>`;

      return '<div>' + dateStr + amountStr + countStr + '</div>';
    },
  },
  grid: {
    left: '0',
    right: '20px',
    top: '20px',
    bottom: '10px',
    containLabel: true,
  },
  legend: {
    show: false,
    left: 'center',
    bottom: '0',
    orient: 'horizontal', // legend 横向布局。
    data: ['收入金额'],
    textStyle: {
      fontSize: 12,
      color: placeholderColor,
    },
  },
  xAxis: {
    type: 'category',
    data: timeArray,
    boundaryGap: false,
    axisLabel: {
      color: placeholderColor,
    },
    splitLine: {
      show: true,
      lineStyle: {
        color: '#E5E8EF',
        type: 'solid',
      },
    },
    // x轴的刻度线
    axisLine: {
      lineStyle: {
        width: 1,
        color: '#E5E8EF',
      },
    },
  },
  yAxis: {
    type: 'value',
    axisLabel: {
      color: placeholderColor,
    },
    splitLine: {
      lineStyle: {
        color: '#E5E8EF',
        type: 'dashed',
      },
    },
    // y轴的刻度线
    axisLine: {
      lineStyle: {
        width: 1,
        color: '#E5E8EF',
      },
    },
  },
  series: [
    {
      name: '收入金额',
      data: outArray,
      type: 'line',
      smooth: true,
      showSymbol: true,
      symbol: 'emptyCircle',
      symbolSize: 8,
      itemStyle: {
        normal: {
          borderColor,
          borderWidth: 1,
        },
      },
      // 折线渐变色阴影
      areaStyle: {
        opacity: 0.2,
        color: {
          type: 'linear',
          x: 0,
          y: 0,
          x2: 0,
          y2: 1,
          colorStops: [
            {
              offset: 0,
              color: '#32CC32',
            },
            {
              offset: 1,
              color: 'rgba(255,255,255,0.9)',
            },
          ],
        },
      },
    },
  ],
};


 3610
3610


 被折叠的 条评论
为什么被折叠?
被折叠的 条评论
为什么被折叠?
 到【灌水乐园】发言


