


Day06-Prometheus监控全解
1. Prometheus概述
- Prometheus普罗米修斯
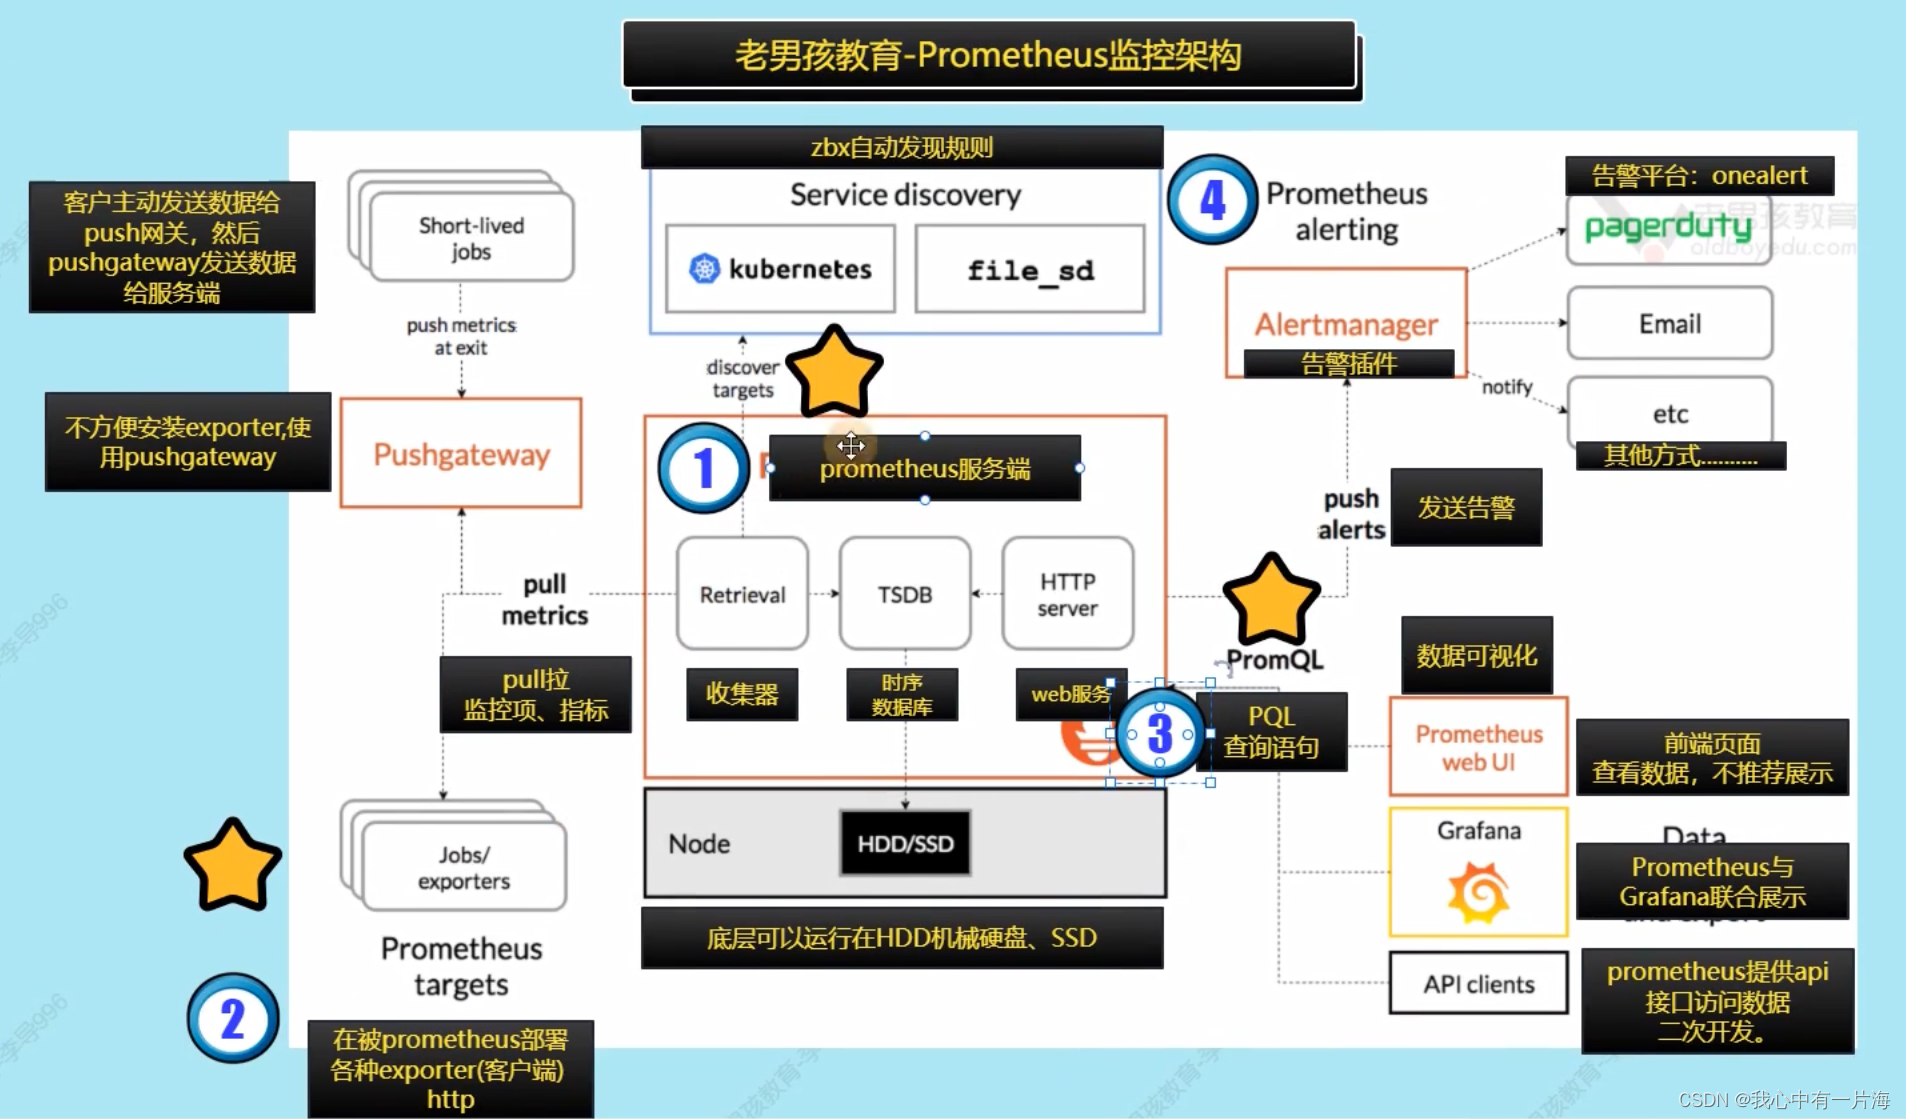
- Prometheus监控架构。使用Golang语言实现。使用简单,学习门槛较高。
- Prometheus一般与Grafana配合。
- Prometheus监控架构
2. Prometheus vs Zabbix
| 指标 | Prometheus | Zabbix |
|---|---|---|
| 语言 | Golang(Go) | PHP,C,GO |
| 部署 | 二进制,解压即用. | yum,编译,数据库,php依赖 |
| 是否容易掌握 | 门槛较高 | 容易使用 |
| 监控方式 | 通过各种exporter,监控一般都是基于http | 各种模板,客户端,自定义监控,各种协议 |
| 应用场景 | 监控服务,容器,k8s。 | 监控系统底层,硬件,系统,网络。 |
3. Prometheus极速上手指南
| 角色 | 主机名 | ip |
|---|---|---|
| prometheus服务端 | m04-prometheus prom.oldboylinux.cn | 10.0.0.64/172.16.1.64 |
| grafana | m03-grafana gra.oldboylinux.cn | 10.0.0.63/172.16.1.63 |
| docker01 | docker01 docker01.oldboylinux.cn | 10.0.0.81/172.16.1.81 |
cat >>/etc/hosts<<EOF
172.16.1.64 m04-prometheus prom.oldboylinux.cn
172.16.1.63 m03-grafana gra.oldboylinux.cn
172.16.1.81 docker01 docker01.oldboylinux.cn
EOF
| 部署流程 | 详细说明 | 备注 |
|---|---|---|
| 时间同步 | 所有节点时间同步 | |
| 下载prometheus | 下载,解压,配置 | |
| 启动prometheus | 启动 | |
| 访问webui | 访问前端页面 |
3.1 时间同步
- 检查
#1. sync time lidao996
*/2 * * * * /sbin/ntpdate ntp1.aliyun.com &>/dev/null
3.2 部署
[root@m04-prometheus ~]# mkdir -p /app/tools
[root@m04-prometheus ~]# tar xf /server/tools/prometheus-2.33.3.linux-amd64.tar.gz -C /app/tools/
[root@m04-prometheus tools]# ln -s /app/tools/prometheus-2.33.3.linux-amd64/ /app/tools/prometheus
| 目录说明 | |
|---|---|
| prometheus | prometheus服务端的命令 |
| prometheus.yml | 配置文件。 |
- 检查版本
root@m04-prometheus prometheus]# /app/tools/prometheus/prometheus --version
prometheus, version 2.33.3 (branch: HEAD, revision: 56e14463bccfbb6a8facfb663fed5e0ca9f8b387)
  build user:       root@4ee34e4f7340
  build date:       20220211-20:48:21
  go version:       go1.17.7
  platform:         linux/amd64
3.3 启动
cd /app/tools/prometheus
./prometheus   #前台启动。

[root@m04-prometheus ~]# ps -ef|grep prome
root       1710   1543  0 09:56 pts/0    00:00:00 ./prometheus
root       1723   1686  0 09:56 pts/1    00:00:00 grep --color=auto prome
[root@m04-prometheus ~]# ss -lntup|grep prome
tcp    LISTEN     0      16384  [::]:9090               [::]:*                   users:(("prometheus",pid=1710,fd=7))
3.4 访问
10.0.0.64   prom.oldboylinux.cn

http://prom.oldboylinux.cn:9090/
- 浏览器访问显示
3.5 Prometheus监控架构

- 注意事项,prometheus默认读取当前目录下面的prometheus.yml配置文件。
- 后台启动
nohup /app/tools/prometheus/prometheus &>>/var/log/prometheus/prometheus.log &
- systemctl管理
#创建Prometheus日志目录,测试前台启动命令
[root@m04-prometheus prometheus]# mkdir -p /var/log/prometheus
[root@m04-prometheus prometheus]# /app/tools/prometheus/prometheus --config.file=/app/tools/prometheus/prometheus.yml &>>/var/log/prometheus/prom.log

# 书写systemctl配置文件
[root@m04-prometheus prometheus]# cat /usr/lib/systemd/system/prometheus.service
[Unit]
Description=Prometheus Server
After=network.target

[Service]
Type=simple
ExecStart=/app/tools/prometheus/prometheus --config.file=/app/tools/prometheus/prometheus.yml
KillMode=process


[Install]
WantedBy=multi-user.target

# 重新加载配置文件及启动关闭测试
[root@m04-prometheus prometheus]# systemctl daemon-reload
[root@m04-prometheus prometheus]# systemctl enable --now prometheus.service
- 配置页面
- 简单过滤
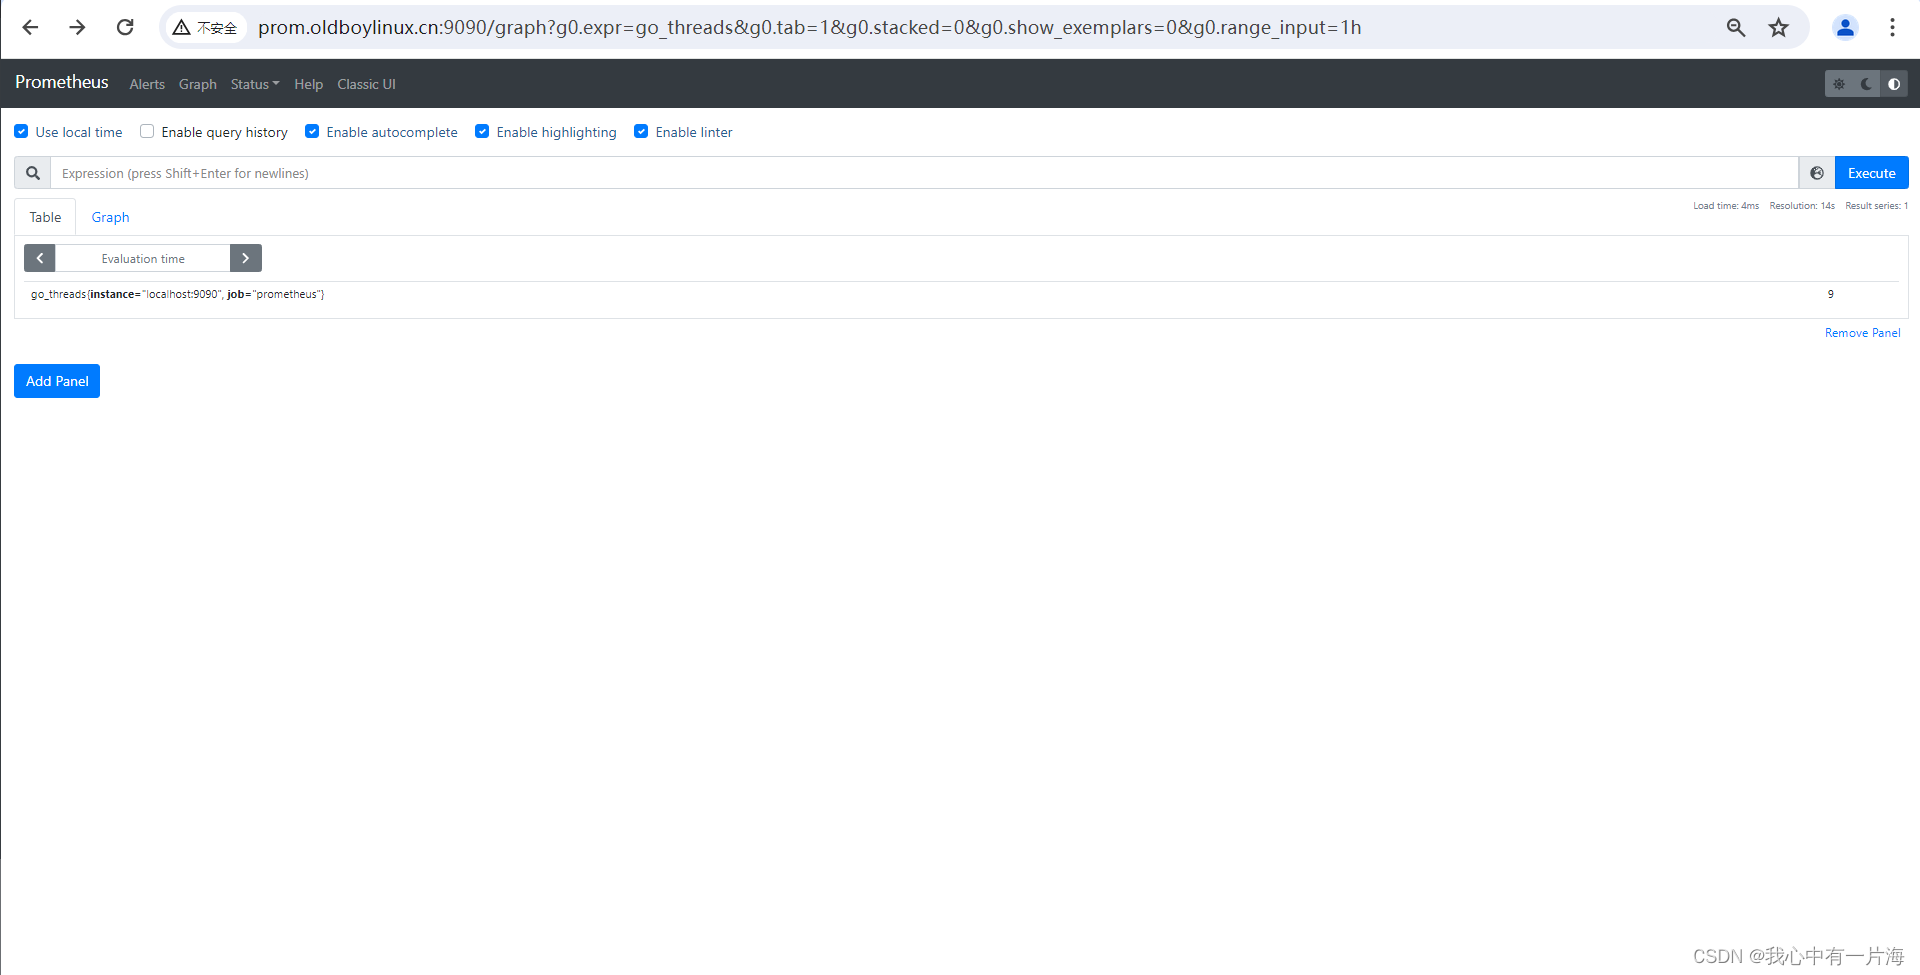
- 查看数据
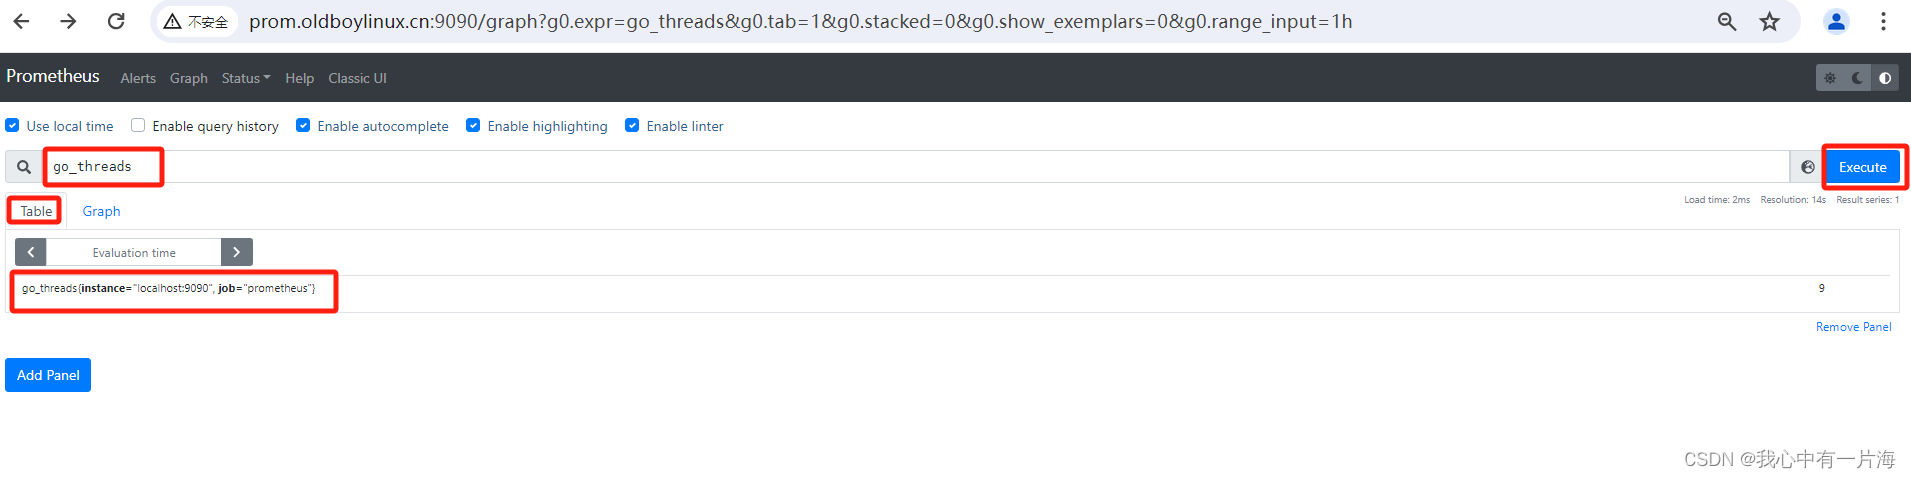
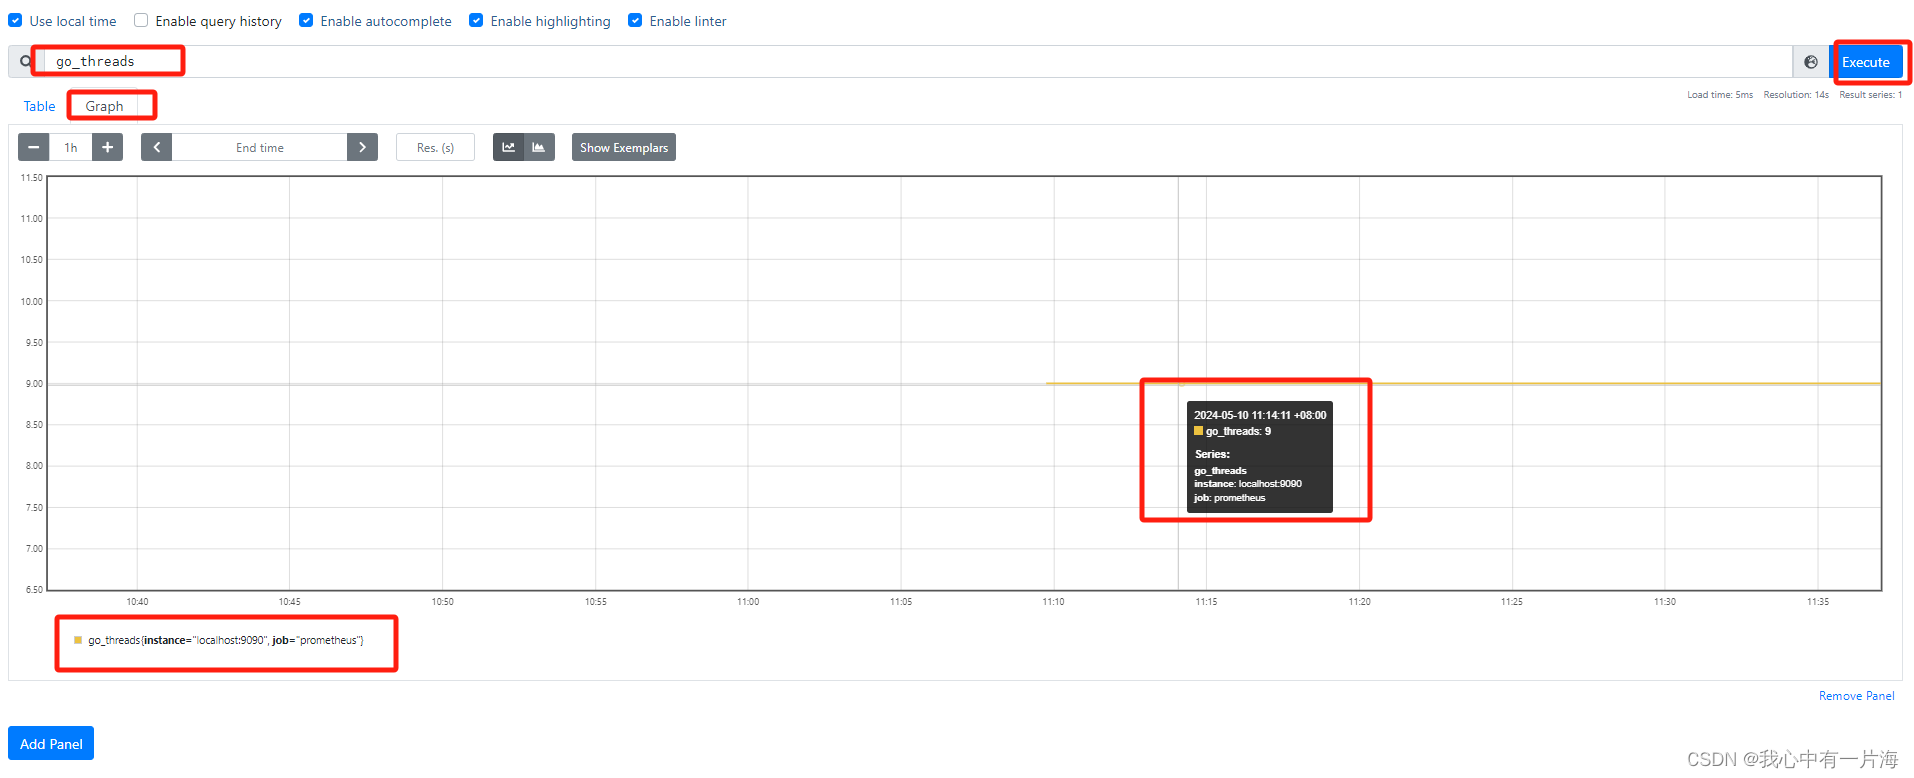
- 查看图形
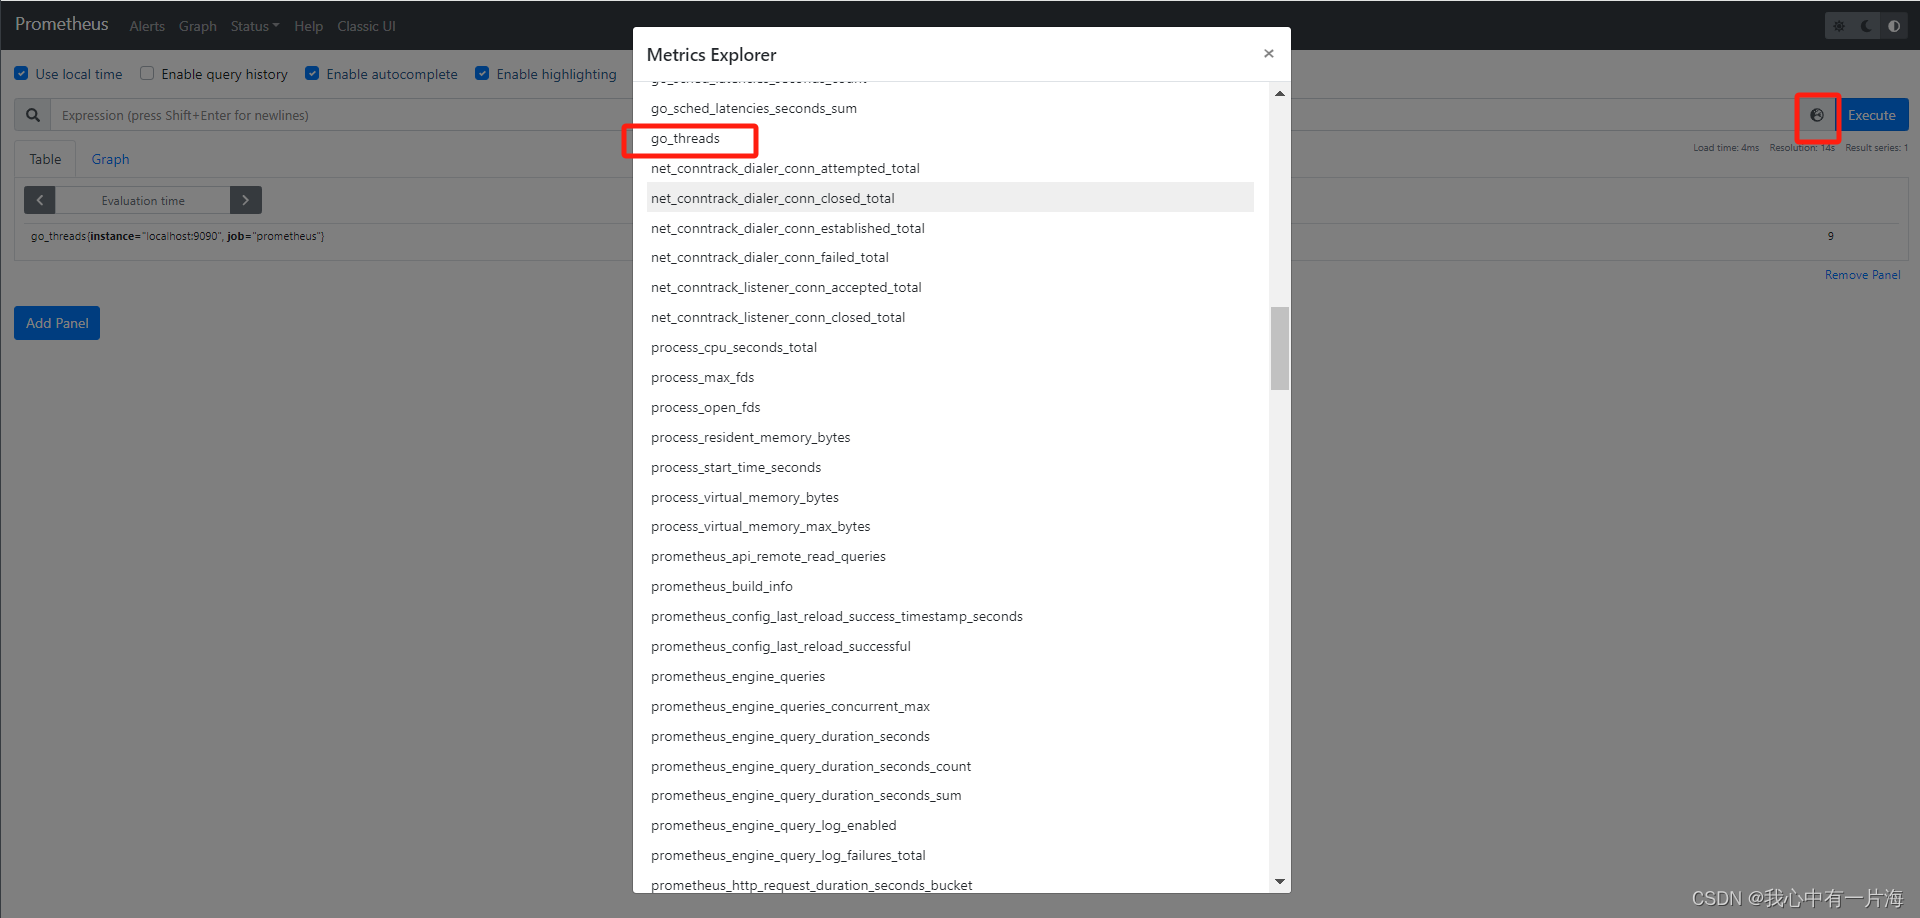
- 显示所有键值
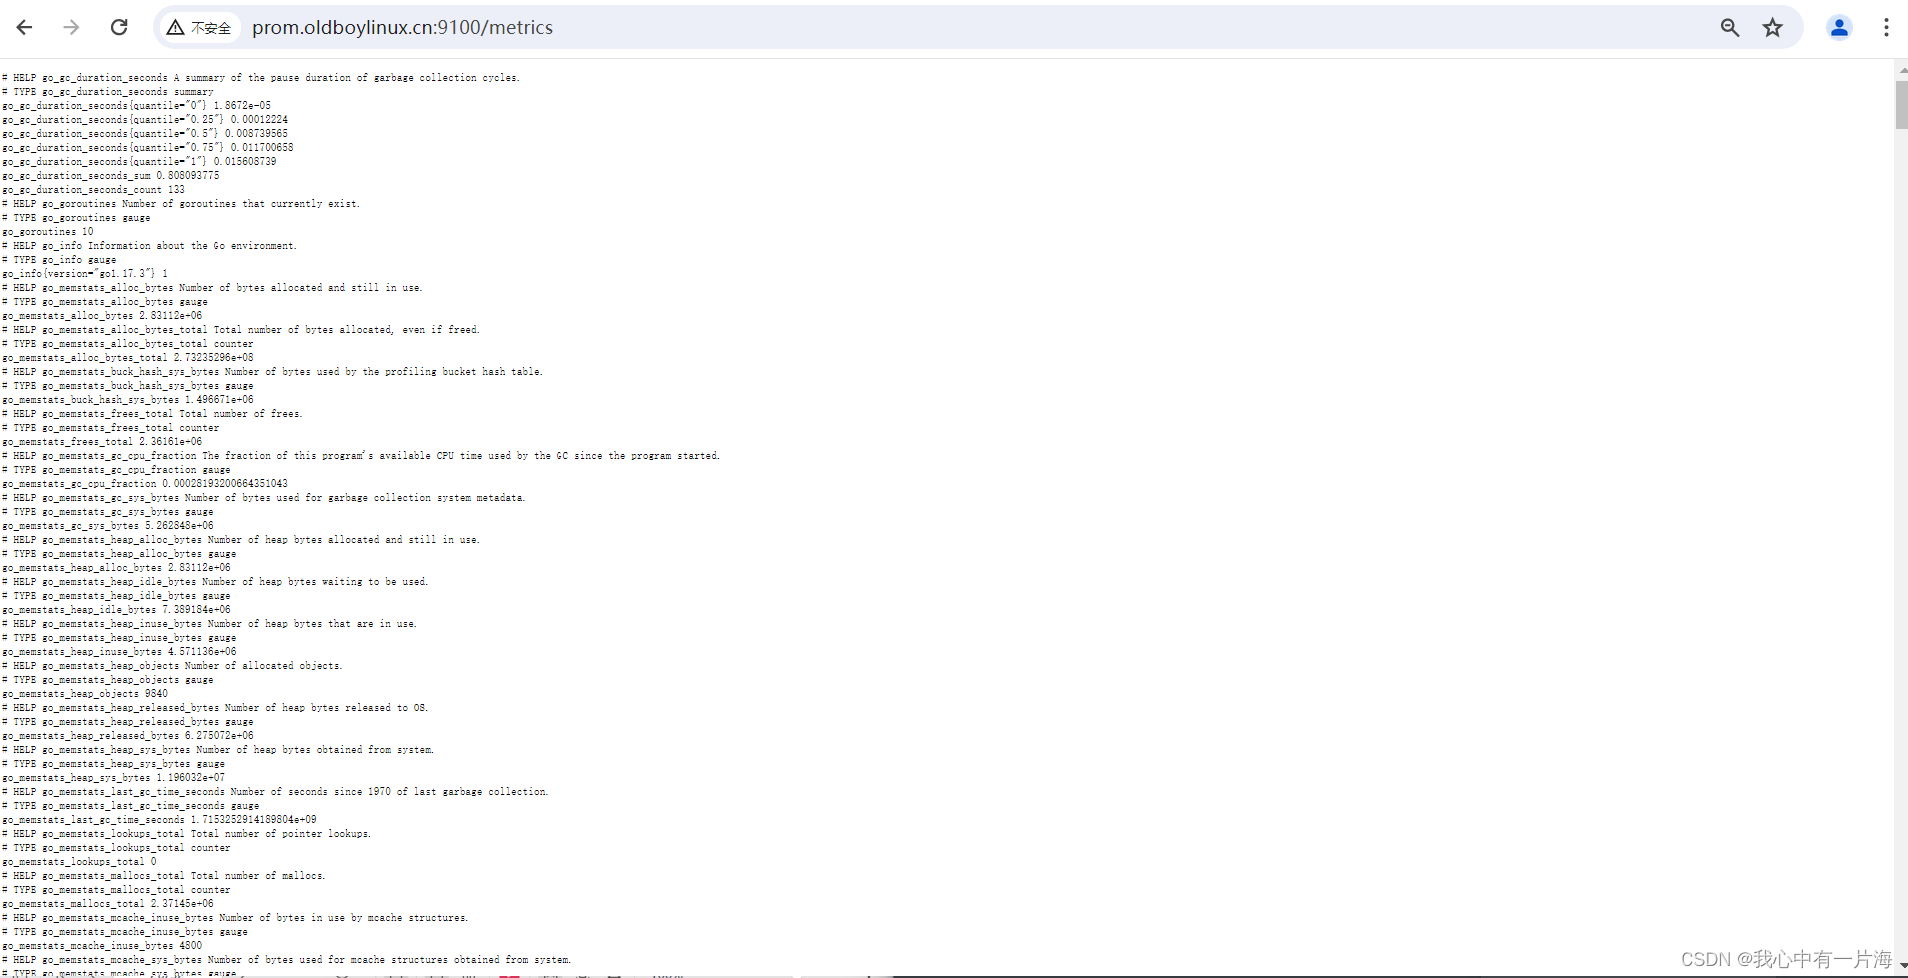
http://prom.oldboylinux.cn:9090/metrics
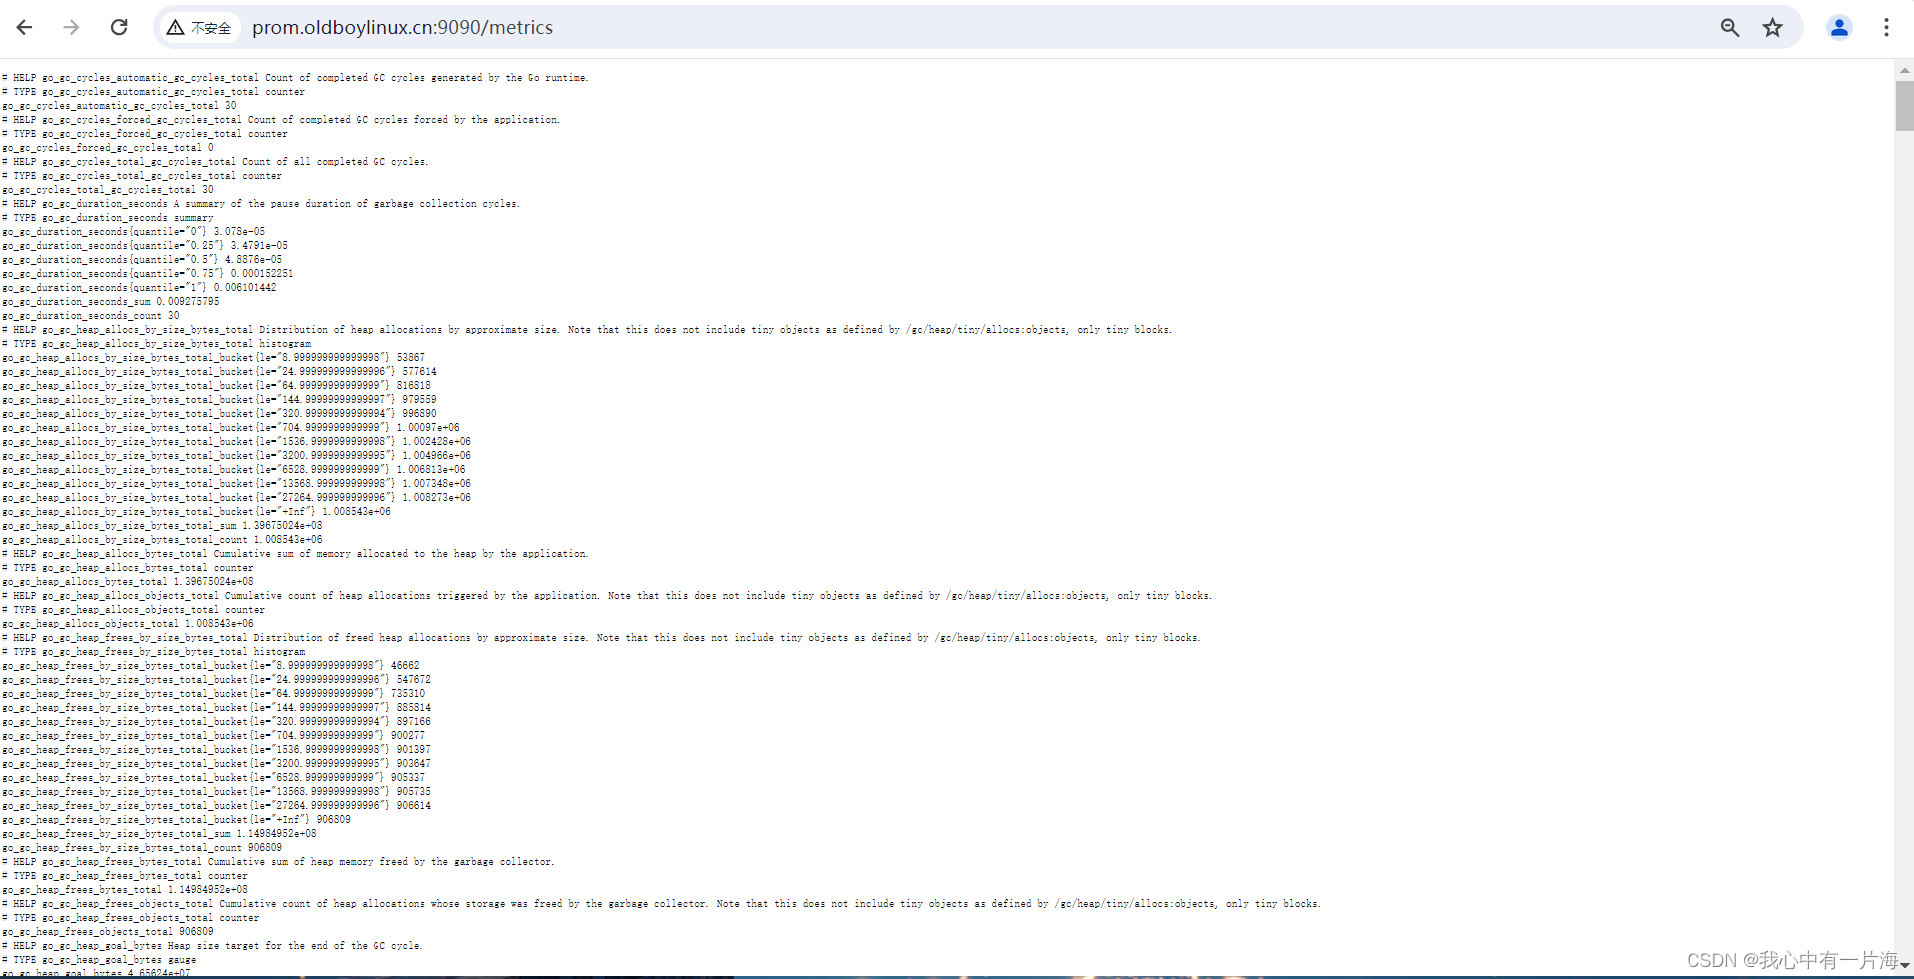
# 命令行或浏览器访问都可以
[root@m04-prometheus ~]# curl -s http://prom.oldboylinux.cn:9090/metrics|grep -v '#' |wc -l
739
4. Prometheus配置
4.1 服务端命令行选项
| prometheus命令行核心选项 | |
|---|---|
| –config.file=“prometheus.yml” | 指定配置文件,默认是当前目录下在的prometheus.yml |
| –web.listen-address=“0.0.0.0:9090” | 前端web页面,端口和监听的地址。如果想增加访问认证可以用ngx。 |
| –web.max-connections=512 | 并发连接数 |
| –storage.tsdb.path=“data/” | 指定tsdb数据存放目录,相对于安装目录 |
| –log.level=info | 日志级别,info(一般),debug(超级详细).prometheus日志默认输出到屏幕(标准输出) |
| –log.format=logfmt | 日志格式。logfmt默认格式。 json格式(日志收集的时候使用) |
[root@m04-prometheus ~]# systemctl status prometheus.service
[root@m04-prometheus ~]# journalctl -u prometheus.service
[root@m04-prometheus ~]# journalctl -f -u prometheus.service
-- Logs begin at 五 2024-05-10 09:32:02 CST. --
5月 10 11:13:41 m04-prometheus prometheus[2312]: ts=2024-05-10T03:13:41.997Z caller=head.go:533 level=info component=tsdb msg="Replaying WAL, this may take a while"
5月 10 11:13:42 m04-prometheus prometheus[2312]: ts=2024-05-10T03:13:42.131Z caller=head.go:604 level=info component=tsdb msg="WAL segment loaded" segment=0 maxSegment=2
5月 10 11:13:42 m04-prometheus prometheus[2312]: ts=2024-05-10T03:13:42.131Z caller=head.go:604 level=info component=tsdb msg="WAL segment loaded" segment=1 maxSegment=2
5月 10 11:13:42 m04-prometheus prometheus[2312]: ts=2024-05-10T03:13:42.132Z caller=head.go:604 level=info component=tsdb msg="WAL segment loaded" segment=2 maxSegment=2
5月 10 11:13:42 m04-prometheus prometheus[2312]: ts=2024-05-10T03:13:42.132Z caller=head.go:610 level=info component=tsdb msg="WAL replay completed" checkpoint_replay_duration=26.779µs wal_replay_duration=134.564566ms total_replay_duration=134.611283ms
5月 10 11:13:42 m04-prometheus prometheus[2312]: ts=2024-05-10T03:13:42.134Z caller=main.go:944 level=info fs_type=XFS_SUPER_MAGIC
5月 10 11:13:42 m04-prometheus prometheus[2312]: ts=2024-05-10T03:13:42.134Z caller=main.go:947 level=info msg="TSDB started"
5月 10 11:13:42 m04-prometheus prometheus[2312]: ts=2024-05-10T03:13:42.134Z caller=main.go:1128 level=info msg="Loading configuration file" filename=/app/tools/prometheus/prometheus.yml
5月 10 11:13:42 m04-prometheus prometheus[2312]: ts=2024-05-10T03:13:42.136Z caller=main.go:1165 level=info msg="Completed loading of configuration file" filename=/app/tools/prometheus/prometheus.yml totalDuration=1.497456ms db_storage=635ns remote_storage=4.346µs web_handler=341ns query_engine=798ns scrape=643.301µs scrape_sd=503.383µs notify=28.229µs notify_sd=7.149µs rules=2.194µs
5月 10 11:13:42 m04-prometheus prometheus[2312]: ts=2024-05-10T03:13:42.136Z caller=main.go:896 level=info msg="Server is ready to receive web requests."
# 完整的命令
/app/prometheus/prometheus --config.file="/app/prometheus/prometheus.yml" --web.listen-address="0.0.0.0:9090" --web.max-connections=512  &>/var/log/prometheus.log &

# 开机自启动
# 写入/etc/rc.local
/app/prometheus/prometheus --config.file="/app/prometheus/prometheus.yml" --web.listen-address="0.0.0.0:9090" --web.max-connections=512 &>/var/log/prometheus.log &
- systemctl 配置
[root@m05-prometheus /app/prometheus]# cat /usr/lib/systemd/system/prometheus.service
[Unit]
Description=prometheus server
After=network.target

[Service]
Type=simple
ExecStart=/app/prometheus/prometheus --config.file=/app/prometheus/prometheus.yml --web.listen-address=0.0.0.0:9090 --web.max-connections=512
KillMode=process

[Install]
WantedBy=multi-user.target

systemctl daemon-reload
systemctl enable prometheus.service
systemctl restart prometheus.service

# 查看日志
journalctl -f -u prometheus.service
systemctl配置说明官方文档:
https://access.redhat.com/documentation/zh-cn/red_hat_enterprise_linux/7/html/system_administrators_guide/chap-managing_services_with_systemd
4.2 配置文件
[root@m04-prometheus prometheus]# cat prometheus.yml
# 全局定义部分
# my global config
global:
# 这个间隔表示,prometheus采集数据的间隔.
  scrape_interval: 15s # Set the scrape interval to every 15 seconds. Default is every 1 minute.
# 执行对应的rules(规则)间隔,一般报警规则.
  evaluation_interval: 15s # Evaluate rules every 15 seconds. The default is every 1 minute.
# 采集数据的超时时间,默认是10秒.
  # scrape_timeout is set to the global default (10s).

# Alertmanager configuration
# 用于配置警告信息,alertmanager配置。
alerting:
  alertmanagers:
    - static_configs:
        - targets:
          # - alertmanager:9093

# Load rules once and periodically evaluate them according to the global 'evaluation_interval'.
rule_files:
  # - "first_rules.yml"
  # - "second_rules.yml"

# A scrape configuration containing exactly one endpoint to scrape:
# Here it's Prometheus itself.
scrape_configs:
# 数据采集的配置(客户端)
  # The job name is added as a label `job=<job_name>` to any timeseries scraped from this config.
  - job_name: "prometheus"
    # 任务名字.体现采集哪些机器,哪些指标.
    # metrics_path defaults to '/metrics'
    # scheme defaults to 'http'.

    static_configs:
    # 静态配置文件,直接指定被采集的对象. 修改后要重启prometheus.
      - targets: ["localhost:9090"]
    file_sd_configs:
    # 动态配置文件,动态读取文件内容,然后进行采集,实时监控。
prom服务端配置文件核心:
scrape_configs: 用于配置各种的exporter
- 修改prometheus服务端监控配置文件,服务端自我监控设置名字
[root@m04-prometheus prometheus]# cat prometheus.yml
global:
  scrape_interval: 15s
  evaluation_interval: 15s
alerting:
  alertmanagers:
    - static_configs:
        - targets:
rule_files:
scrape_configs:
  - job_name: "prometheus_server"
    static_configs:
      - targets: ["localhost:9090"]

[root@m04-prometheus prometheus]# systemctl restart prometheus.service
5. Prometheus的exporter
5.1 概述
- prometheus有众多的exporters.基本通过命令或docker运行。
| exporter | 说明 |
|---|---|
| node_exporter | 获取节点基础信息(系统监控) |
| 服务_exporter | 监控指定服务的。 |
- 各种exporter使用流程
- 下载,部署,启动exporter
- prometheus服务端配置,在配置中添加这主机+端口。
5.2 环境准备
| 节点 | 部署的内容 | ip地址 |
|---|---|---|
| prometheus | node_exporter | 10.0.0.64/172.16.1.64 |
| grafana | node_exporter | 10.0.0.63/172.16.1.63 |
5.3 部署node_exporter
- 部署node_exporter
[root@m04-prometheus tools]# tar xf node_exporter-1.3.1.linux-amd64.tar.gz -C /app/tools/
[root@m04-prometheus tools]# ln -s /app/tools/node_exporter-1.3.1.linux-amd64/ /app/tools/node_exporter
[root@m04-prometheus tools]# ln -s /app/tools/node_exporter/node_exporter /bin/
[root@m04-prometheus tools]# node_exporter --version
node_exporter, version 1.3.1 (branch: HEAD, revision: a2321e7b940ddcff26873612bccdf7cd4c42b6b6)
  build user:       root@243aafa5525c
  build date:       20211205-11:09:49
  go version:       go1.17.3
  platform:         linux/amd64
- 配置systemctl
[root@m04-prometheus tools]# cat /usr/lib/systemd/system/node-exporter.service
[Unit]
Description=Prometheus node_exporter
After=network.target

[Service]
Type=simple
ExecStart=/bin/node_exporter
KillMode=process

[Install]
WantedBy=multi-user.target


[root@m04-prometheus tools]# ps -ef|grep node
root       3174   2729  0 14:24 pts/0    00:00:00 grep --color=auto node
[root@m04-prometheus tools]# systemctl daemon-reload
[root@m04-prometheus tools]# systemctl enable --now node-exporter.service
Created symlink from /etc/systemd/system/multi-user.target.wants/node-exporter.service to /usr/lib/systemd/system/node-exporter.service.
[root@m04-prometheus tools]# ps -ef|gerp node
-bash: gerp: 未找到命令
[root@m04-prometheus tools]# ps -ef|grep node
root       3148      1  0 14:23 ?        00:00:00 /bin/node_exporter
root       3157   2729  0 14:23 pts/0    00:00:00 grep --color=auto node
[root@m04-prometheus tools]# ss -lntup|grep node
tcp    LISTEN     0      16384  [::]:9100               [::]:*                   users:(("node_exporter",pid=3148,fd=3))
- 检查node_exporter端口与进程信息.

- 部署grafana主机的node_exporeter
过程同上
5.4 配置prometheus服务端
[root@m04-prometheus prometheus]# cat prometheus.yml
global:
scrape_interval: 15s
evaluation_interval: 15s
alerting:
alertmanagers:
- static_configs:
- targets:
rule_files:
scrape_configs:
- job_name: "prometheus_server"
static_configs:
- targets: ["localhost:9090"]
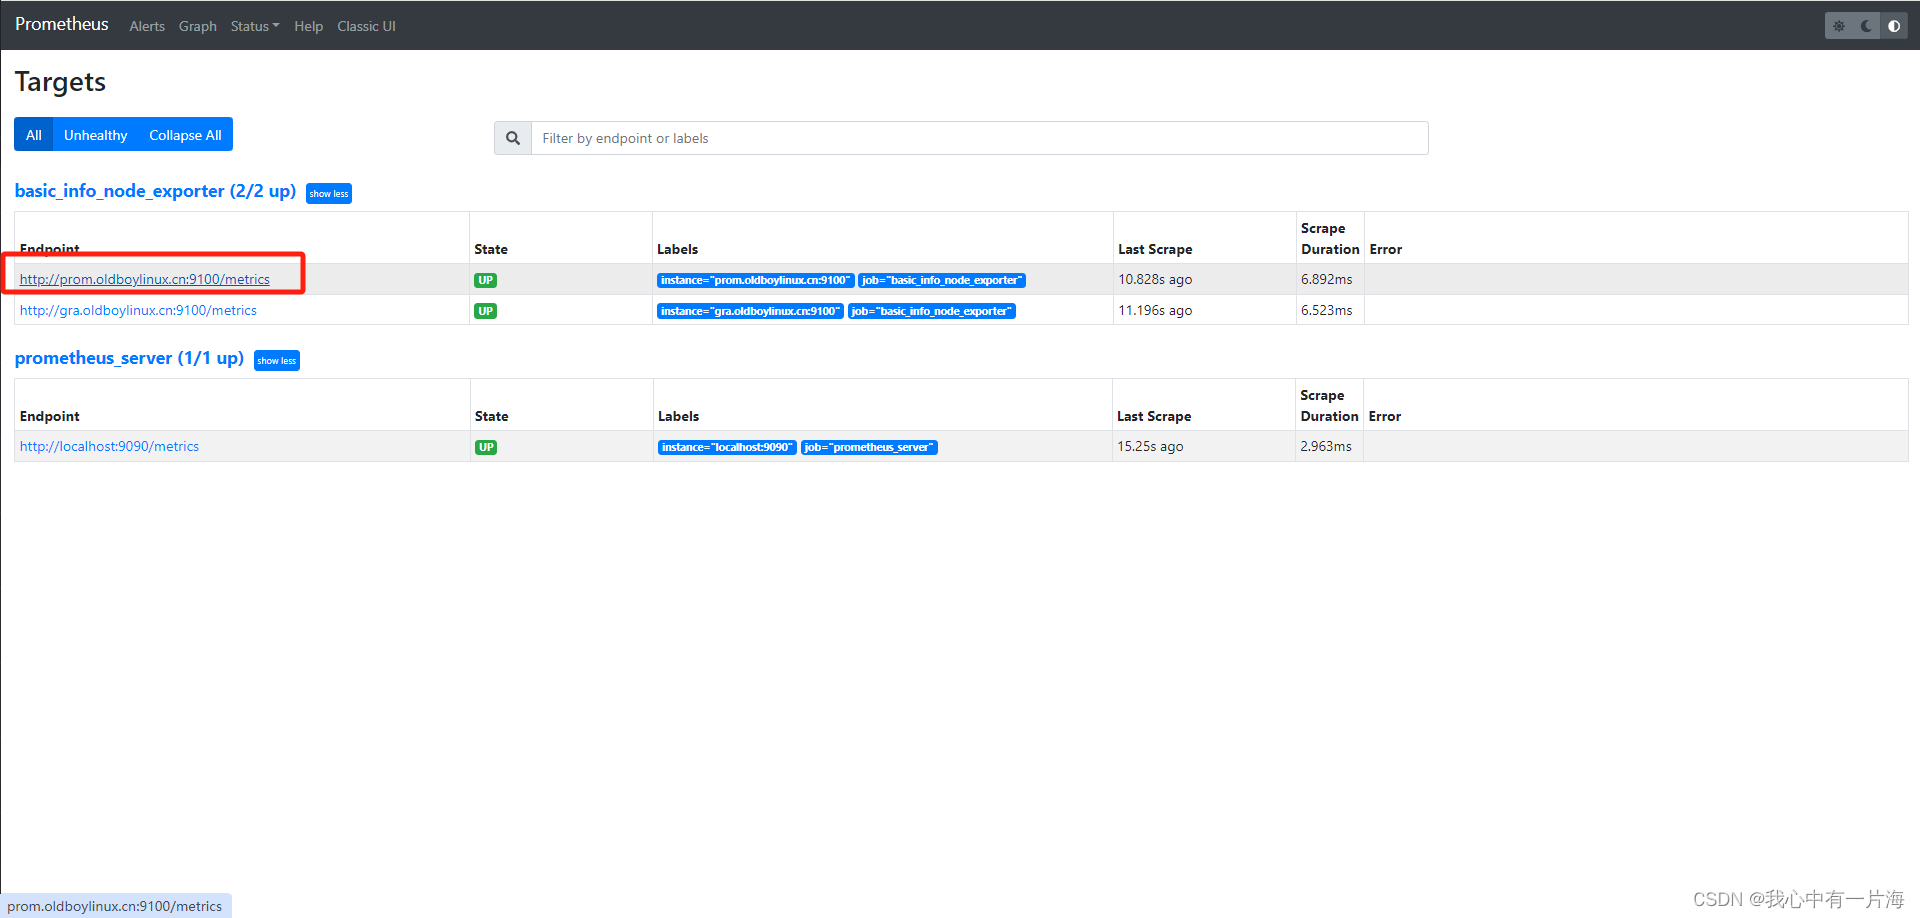
- job_name: "basic_info_node_exporter"
static_configs:
- targets:
- "prom.oldboylinux.cn:9100"
- "gra.oldboylinux.cn:9100"
[root@m04-prometheus prometheus]# systemctl restart prometheus.service
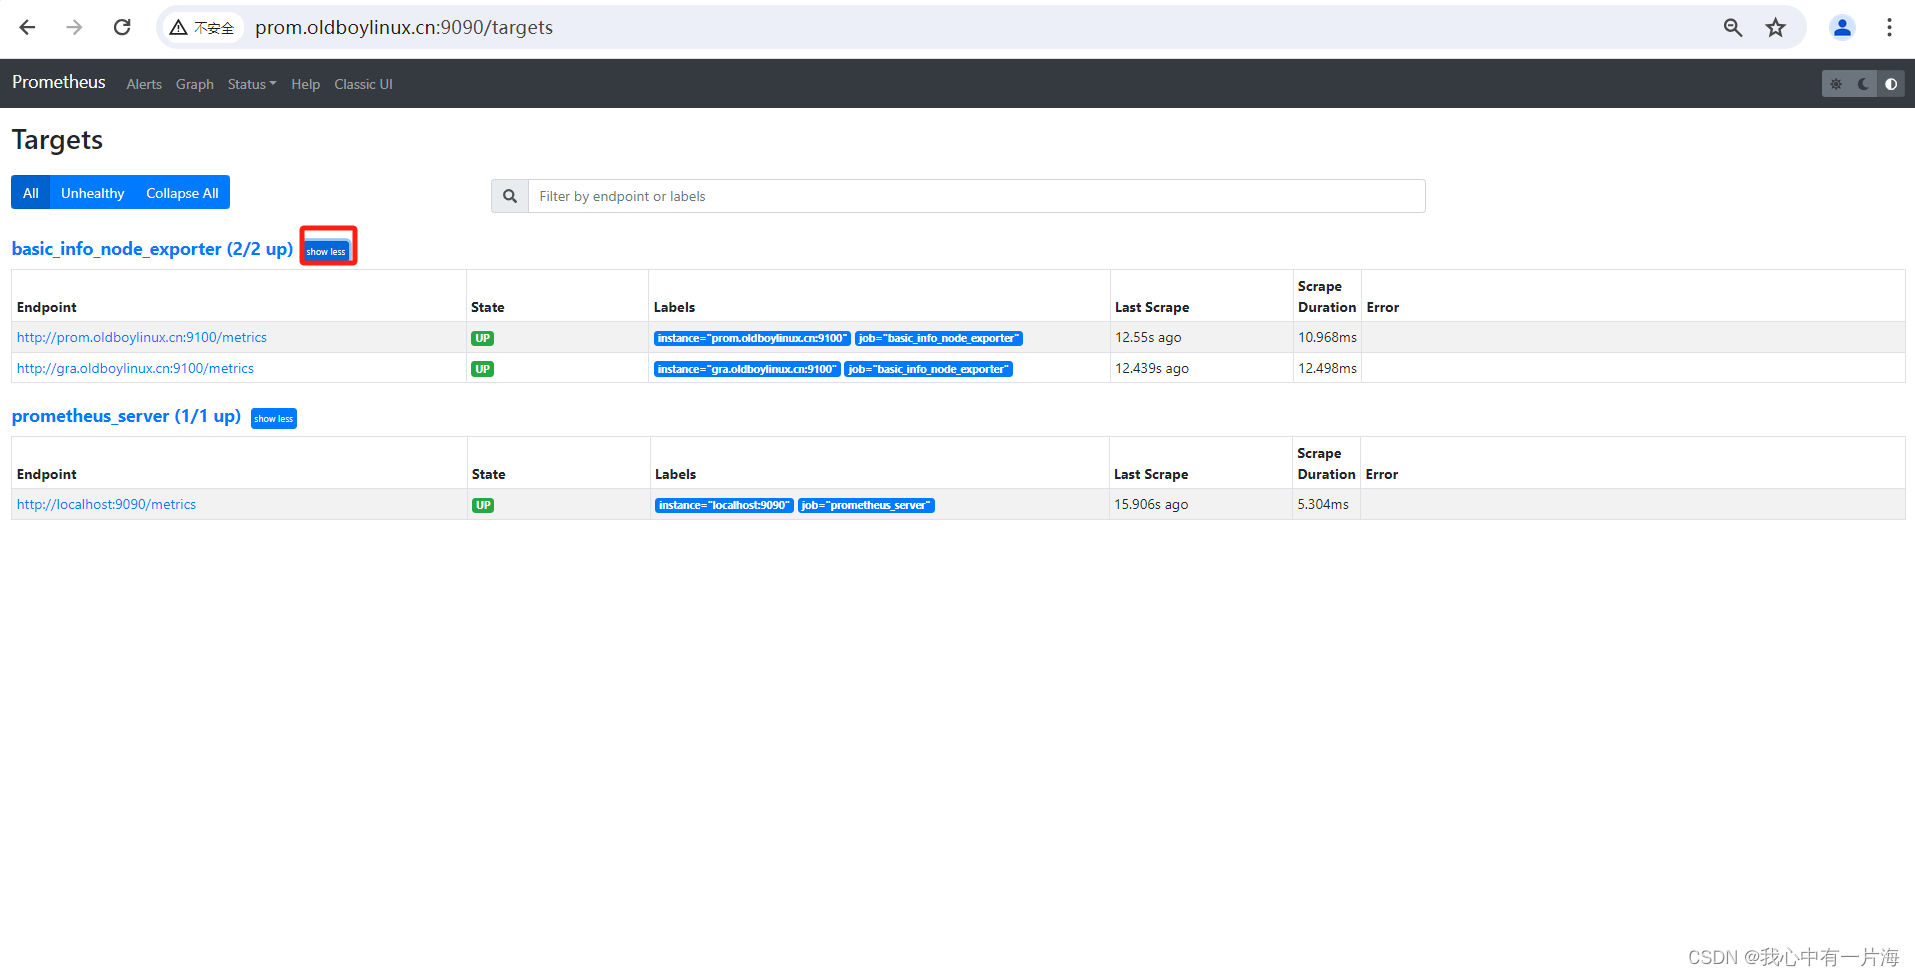
- 稍加等待并刷新,显示如下
5.6 过滤数据
5.7 prometheus动态配置文件
- 获取的exporter域名+端口,写入配置文件,prometheus可以定时读取并加入到prometheus中。
- 用于解决,大量主机添加、删除的操作。
[root@m04-prometheus prometheus]# cat prometheus.yml
global:
  scrape_interval: 15s
  evaluation_interval: 15s
alerting:
  alertmanagers:
    - static_configs:
        - targets:
rule_files:
scrape_configs:
  - job_name: "prometheus_server"
    static_configs:
      - targets: ["localhost:9090"]
#  - job_name: "basic_info_node_exporter"
#    static_configs:
#      - targets:
#        - "prom.oldboylinux.cn:9100"
#        - "gra.oldboylinux.cn:9100"
  - job_name: "basic_info_node_exporter_discovery"
    file_sd_configs:
    - files:
      - /app/tools/prometheus/discovery_node_exporter.json
      refresh_interval: 5s
- 配置说明
file_sd_configs: 动态读取与加载配置文件。
files: 指定要加载的配置文件.
refresh_interval 读取间隔.
- 动态加载的配置文件格式
[root@m04-prometheus prometheus]# cat discovery_node_exporter.json
[
  {
    "targets": [
                 "prom.oldboylinux.cn:9100" ,
                 "gra.oldboylinux.cn:9100" ]
  }
]
5.8 小结
-
prometheus通过各种exporter监控客户端.
-
常用exporter
- node_exporter获取主机的系统监控项.
- 其他项目通过各种exporter(docker运行)实现.
-
这个部分主要讲解的是prometheus服务端的配置(连接客户端)
- prometheus.yml主配置文件.
- 静态配置:static_configs 书写到配置文件,重启Prometheus服务端生效。应用场景:适用于固定的服务器监控.
- 动态配置:file_sd_configs 配置书写到文件中,prometheus定时加载。应用场景:网站集群经常发生变化.
6. Prometheus过滤语句
6.1 案例:基本过滤
- 直接写上prometheus的键值(key)
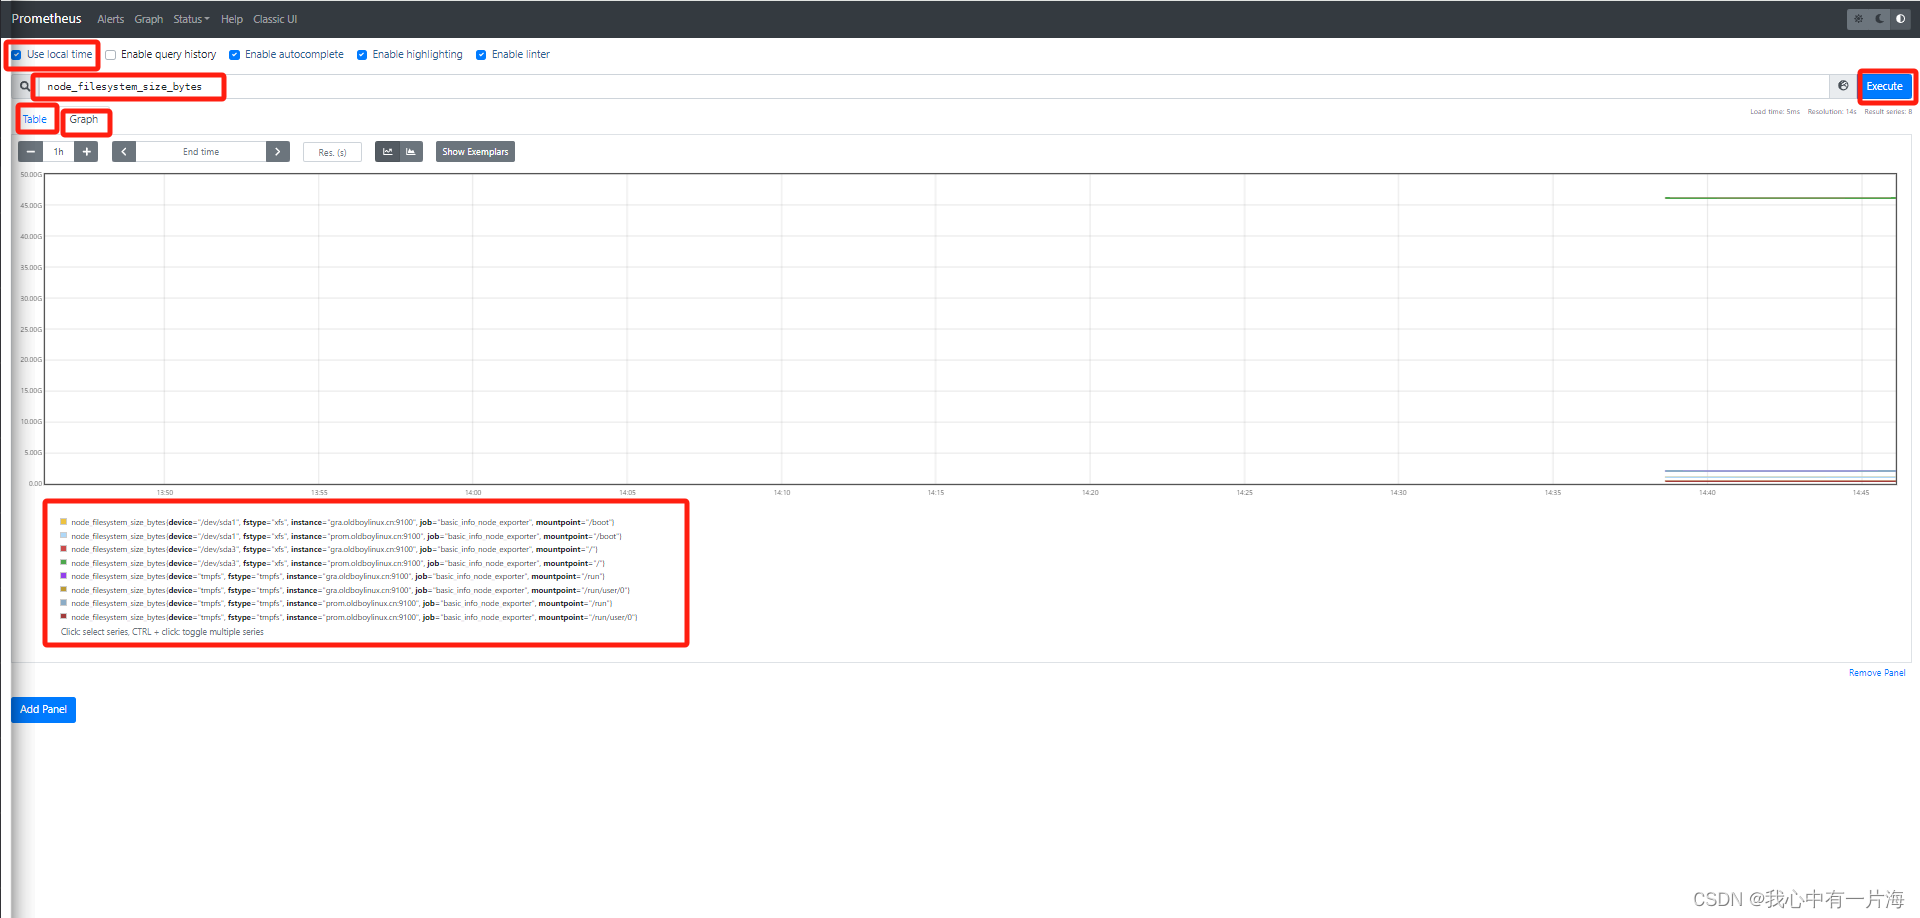
- 比如通过node_exporter获取所有主机可用内存输入 node_memory_MemFree_bytes
node_memory_MemFree_bytes
- 加入运算符后
node_memory_MemFree_bytes/1024^2
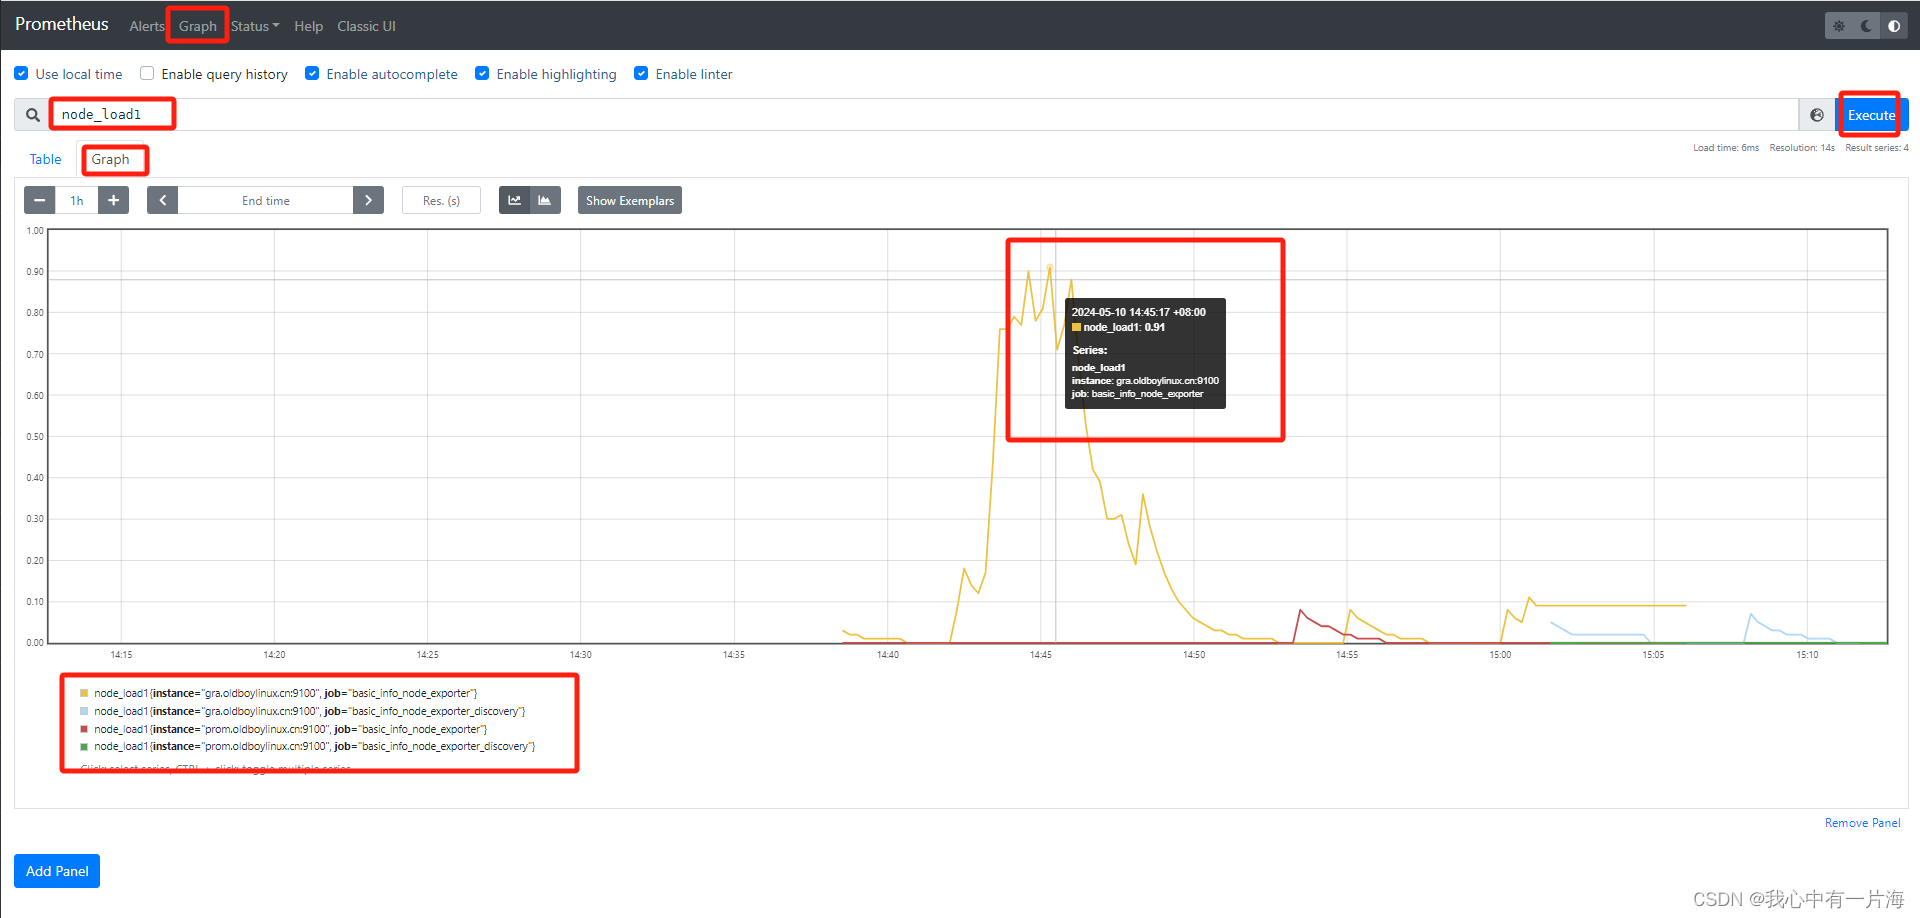
- 过滤负载: node_load1
node_load1
- 查看所有键值
6.2 包含条件的过滤
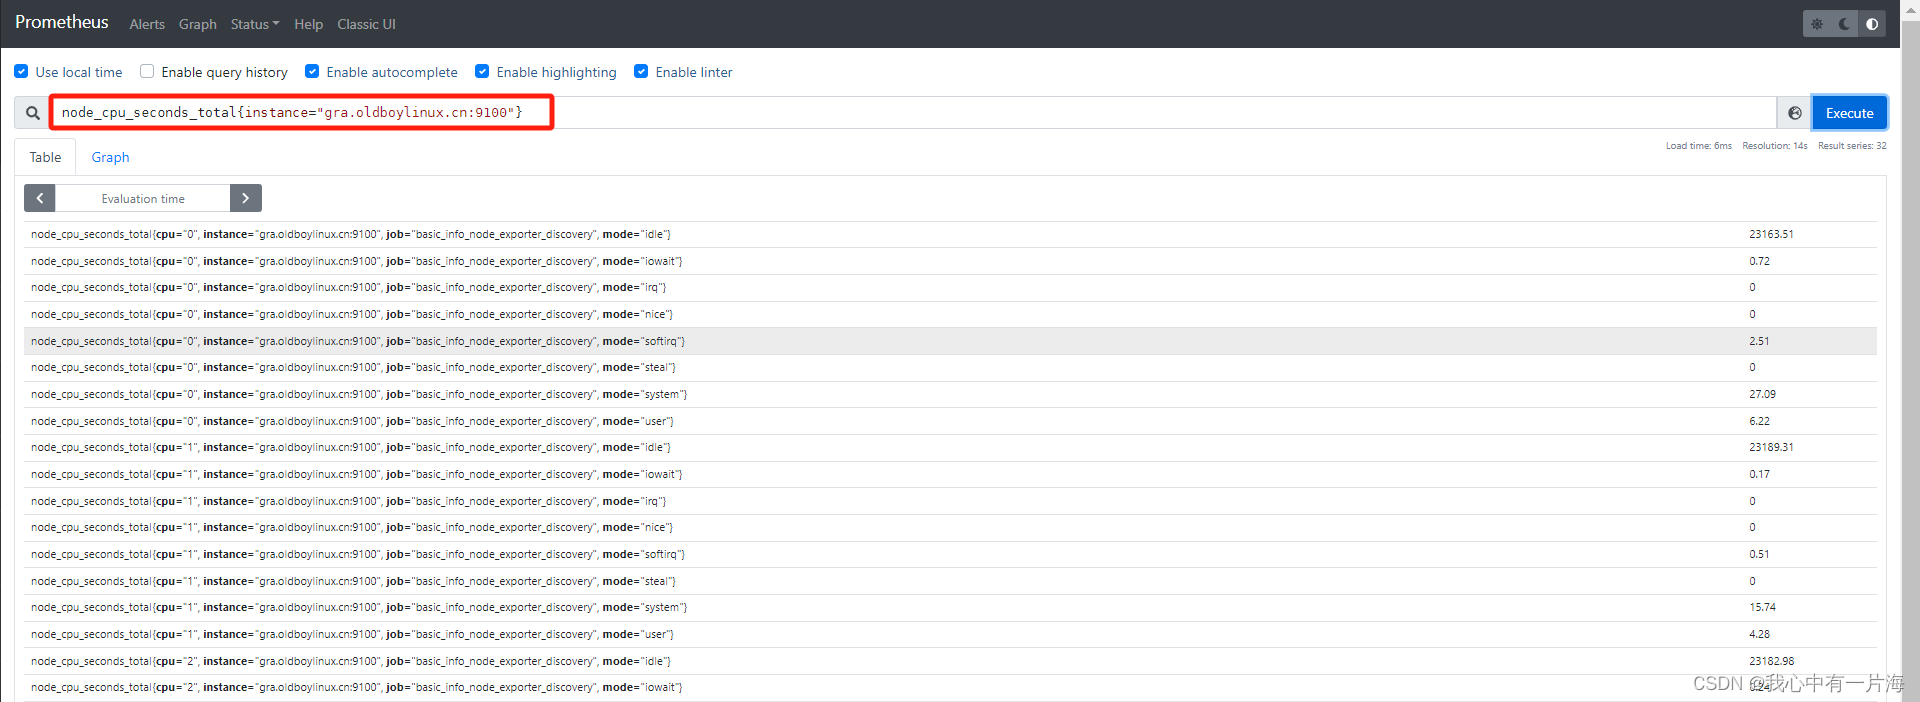
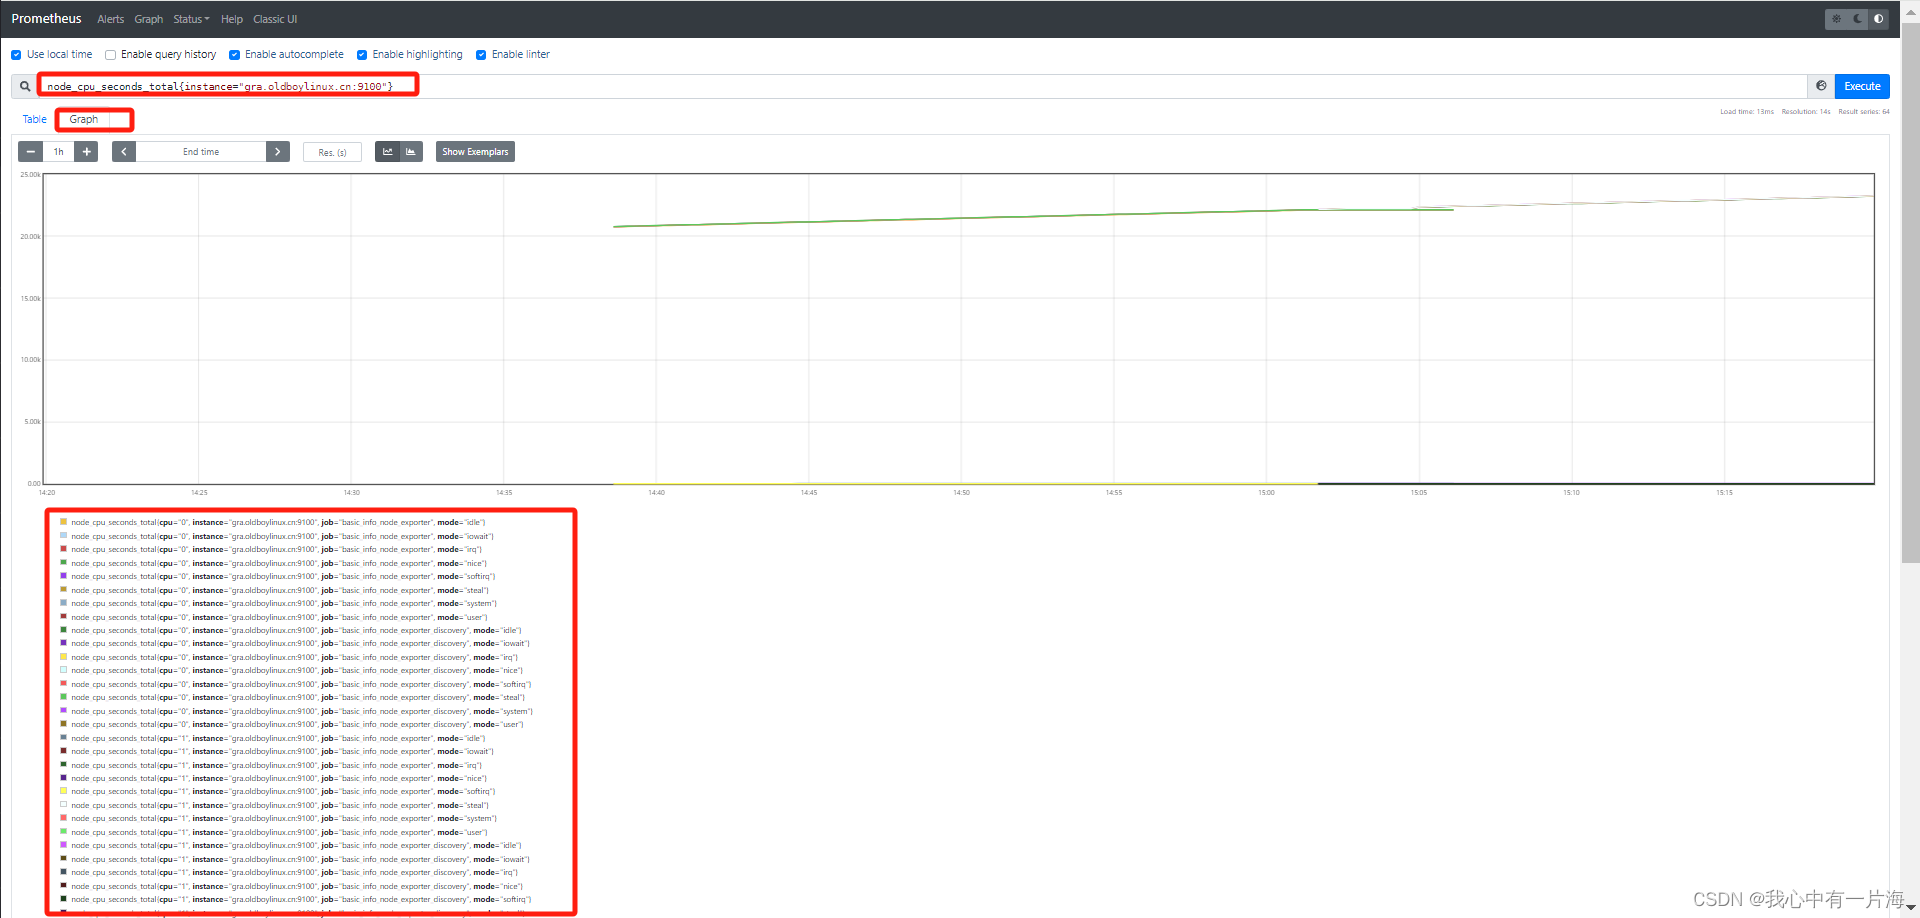
1)案例01:过滤指定主机的数据
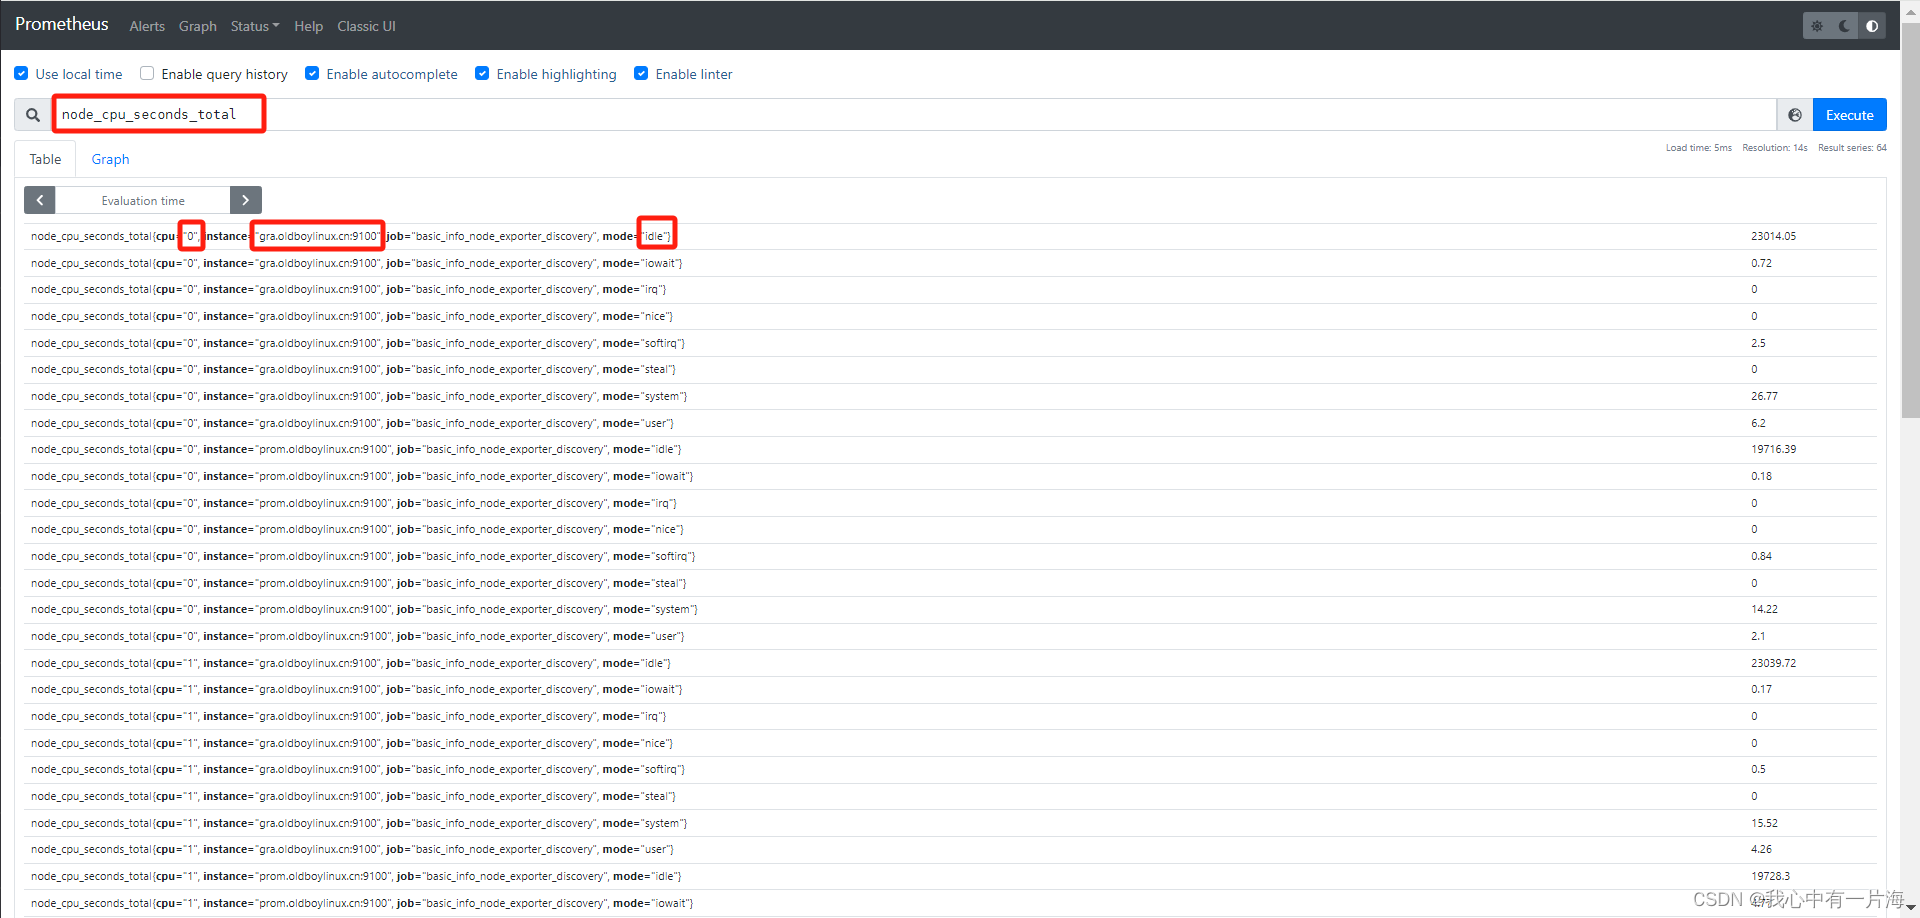
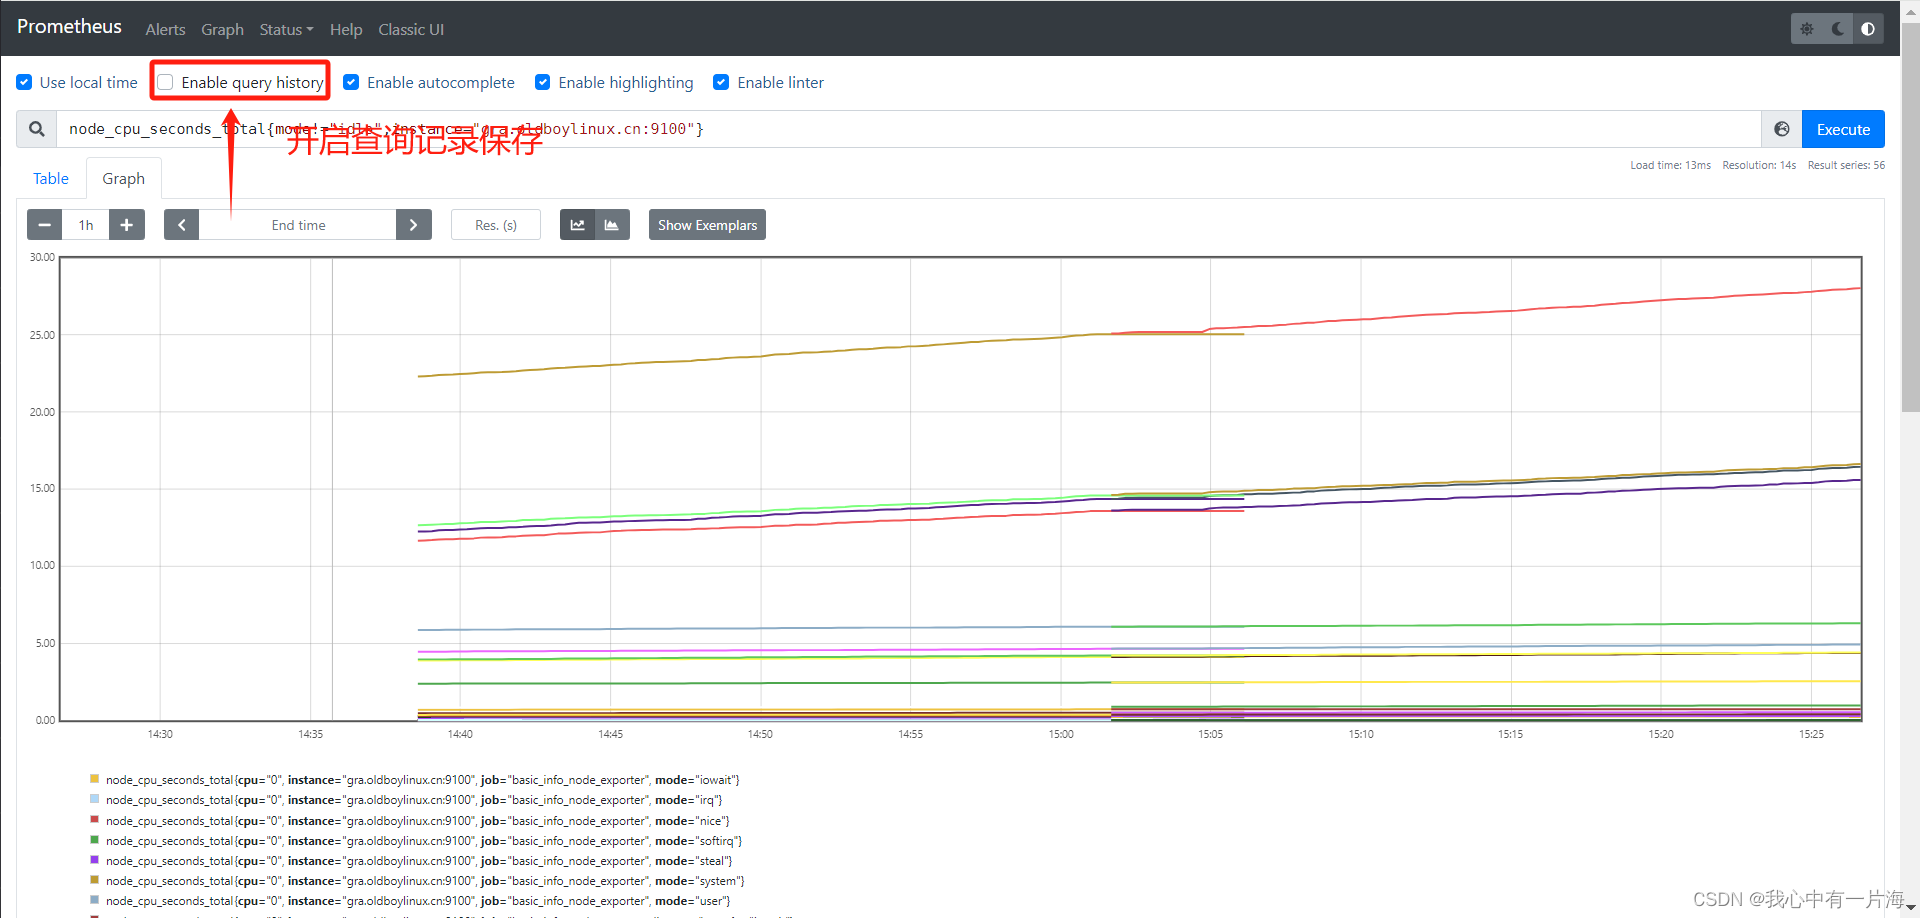
node_cpu_seconds_total{instance="gra.oldboylinux.cn:9100"}
# 格式说明,过滤出指定的内容,需要使用{key(属性)="想要的值"}
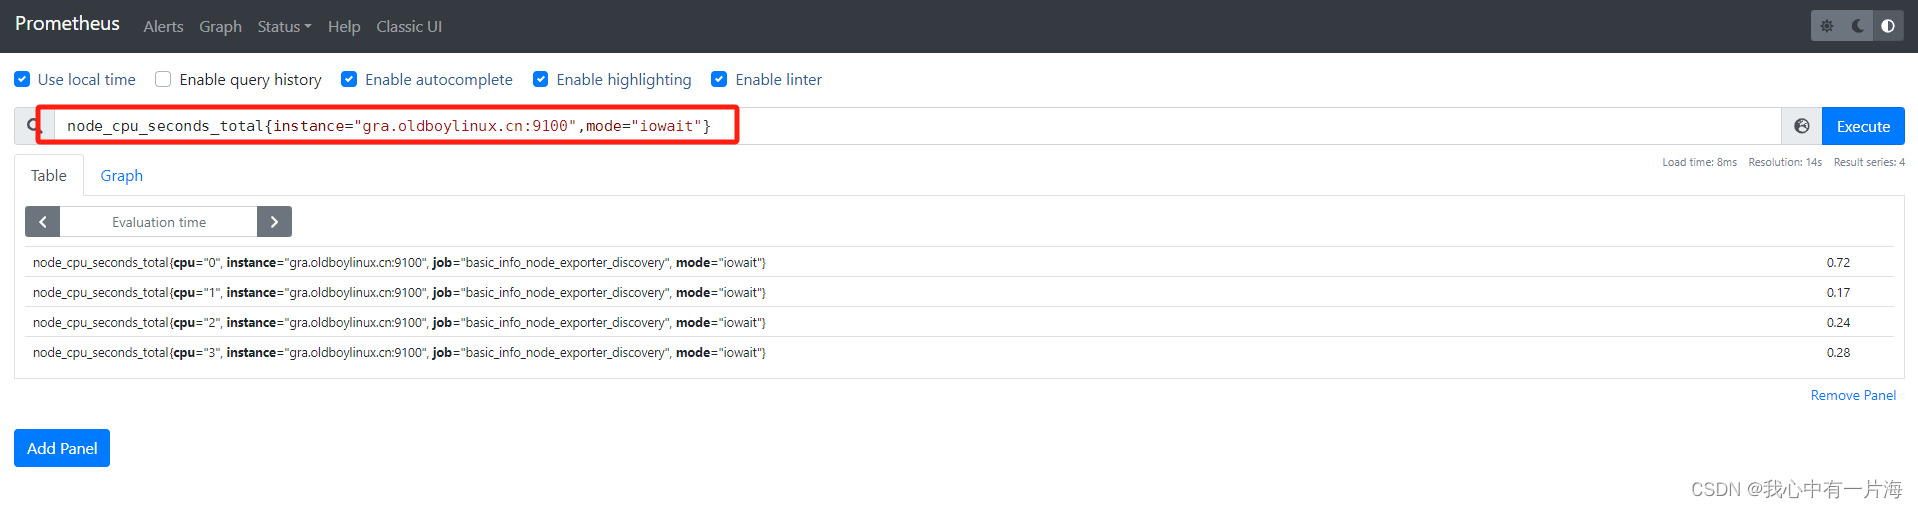
2)案例02:过滤出指定主机cpu信息只要iowait信息
node_cpu_seconds_total{instance="gra.oldboylinux.cn:9100",mode="iowait"}
2)案例03:过滤出所有主机非idle的指标
node_cpu_seconds_total{mode!="idle"}
同时两个条件
node_cpu_seconds_total{mode!="idle",instance="gra.oldboylinux.cn:9100"}
- 温馨提示:开启查询记录保存
3) 小结
- PQL过滤中可以使用=,!=, =~ ,!~
| 符号 | 含义 |
|---|---|
| = | 等于 |
| != | 不等于 |
| =~ | 支持正则,匹配,要完全匹配对应的内容 node_cpu_seconds_total{mode=~“^i.*”} |
| !~ | 支持正则,不匹配 |
-
推荐先找出你要的键值,观察下键值里面的属性.
-
过滤格式
- node_cpu_seconds_total{mode!=“idle”}
- 键值{属性=“值”}
6.3 常用函数
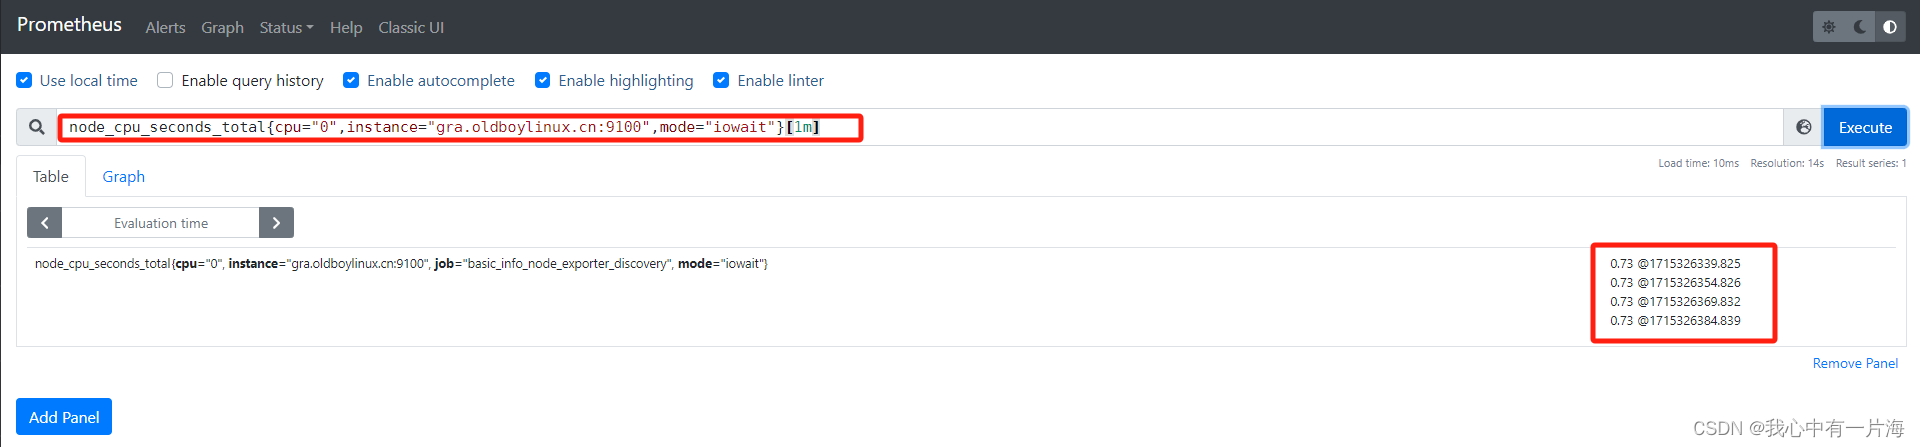
案例04: 取出最近1分钟系统cpu信息
node_cpu_seconds_total{cpu="0",instance="gra.oldboylinux.cn:9100",mode="iowait"}[1m]
# [1m] 最近1分钟的所有数据.

# node_cpu_seconds_total[1m]
[ ]应用场景:配合着prometheus函数使用.
1)rate函数
rate(v range-vector) 计算范围向量中时间序列的每秒平均增长率。单调性的中断(例如由于目标重新启动而导致的计数器重置)会自动调整。此外,计算推断到时间范围的末端,允许错过刮擦或刮擦周期与该范围的时间段的不完美对齐。
以下示例表达式返回在过去 5 分钟内测量的每秒 HTTP 请求速率,范围向量中的每个时间序列
rate(prometheus_http_requests_total{handler="/metrics"}[5m])
rate 只能与计数器一起使用。它最适合警报和缓慢移动计数器的图形。
- 检查cpu速率
rate(node_cpu_seconds_total[1m])
# 排除idle
node_cpu_seconds_total{mode!="idle"}

rate(node_cpu_seconds_total{mode!="idle"}[1m])
# [ ]一般配合函数实现统计指定范围的内容.
2) sum求和
- 计算总和
3) count计数
4)其他函数
https://prometheus.io/docs/prometheus/latest/querying/functions/
6.4 复杂语句
1) 计算内存使用率
# (总内存-剩余)/总共
# 可用/总共
# 总数
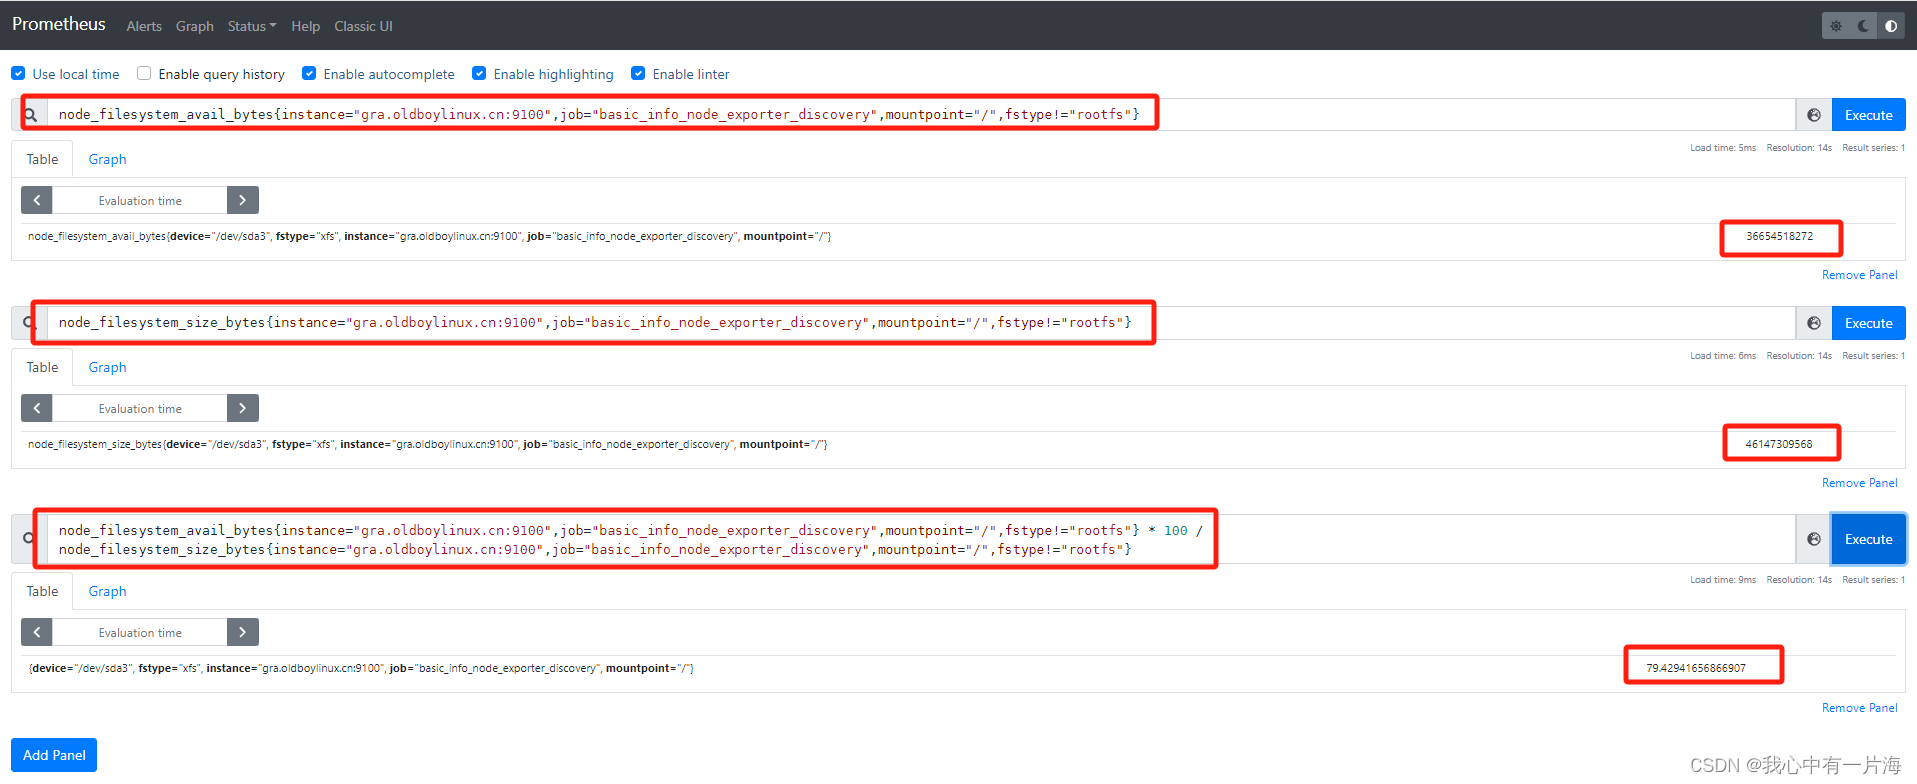
node_memory_MemTotal_bytes{instance="gra.oldboylinux.cn:9100"}
# 可用
node_memory_MemAvailable_bytes{instance="gra.oldboylinux.cn:9100"}
# 使用率=用了多少/总数
# 使用率=(总数-可用)/总数
#(总内存-剩余)/总共
(node_memory_MemTotal_bytes - node_memory_MemFree_bytes) / node_memory_MemTotal_bytes * 100
# 可用/总共
node_memory_MemAvailable_bytes / node_memory_MemTotal_bytes * 100
# 计算某一个节点
( node_memory_MemTotal_bytes{instance="gra.oldboylinux.cn:9100"} - node_memory_MemAvailable_bytes{instance="gra.oldboylinux.cn:9100"} ) / node_memory_MemTotal_bytes{instance="gra.oldboylinux.cn:9100"}
6.5 小结
-
目标:根据我们展示需求或Grafana中的仪表板配置,修改或测试PQL语句
-
过滤的本质,通过promethe获取到的数据,通过键值过滤他们。
-
通过键值+条件。
-
键值之间可以进行计算.
-
还可能使用函数.
-
过滤用于grafana展示.
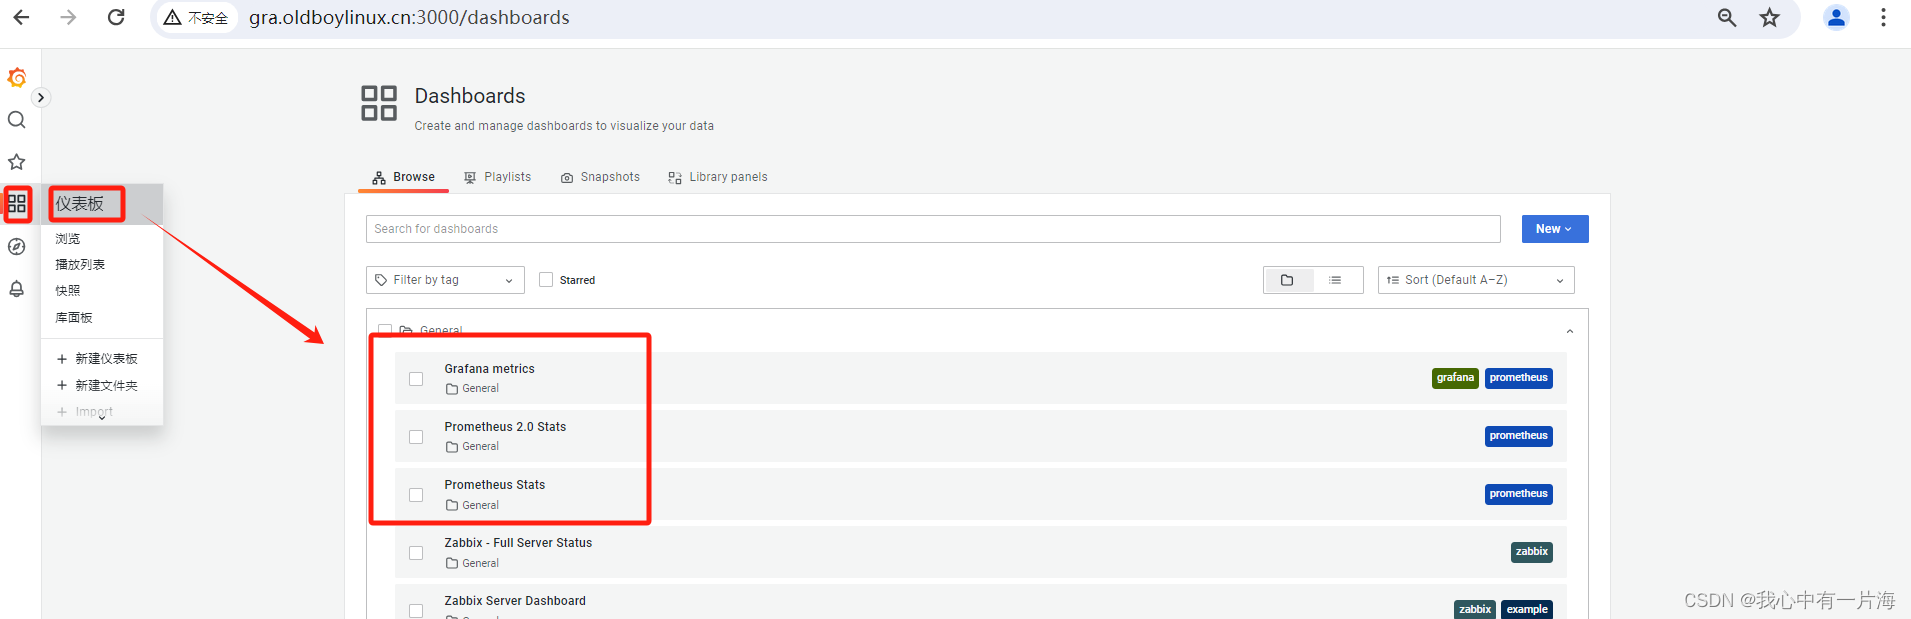
7. 进入Grafana
7.1 概述
- prometheus webui一般用于调试PromQL语句(查询语句)
- 展示交给Grafana。本质:Grafana执行PromQL语句(查询语句),然后通过Grafana进行展示.
7.2 使用流程
| 使用流程 | |
|---|---|
| grafana中添加数据源 | 添加Prometheus,导入仪表盘 |
| 使用,导入第3方仪表盘 |
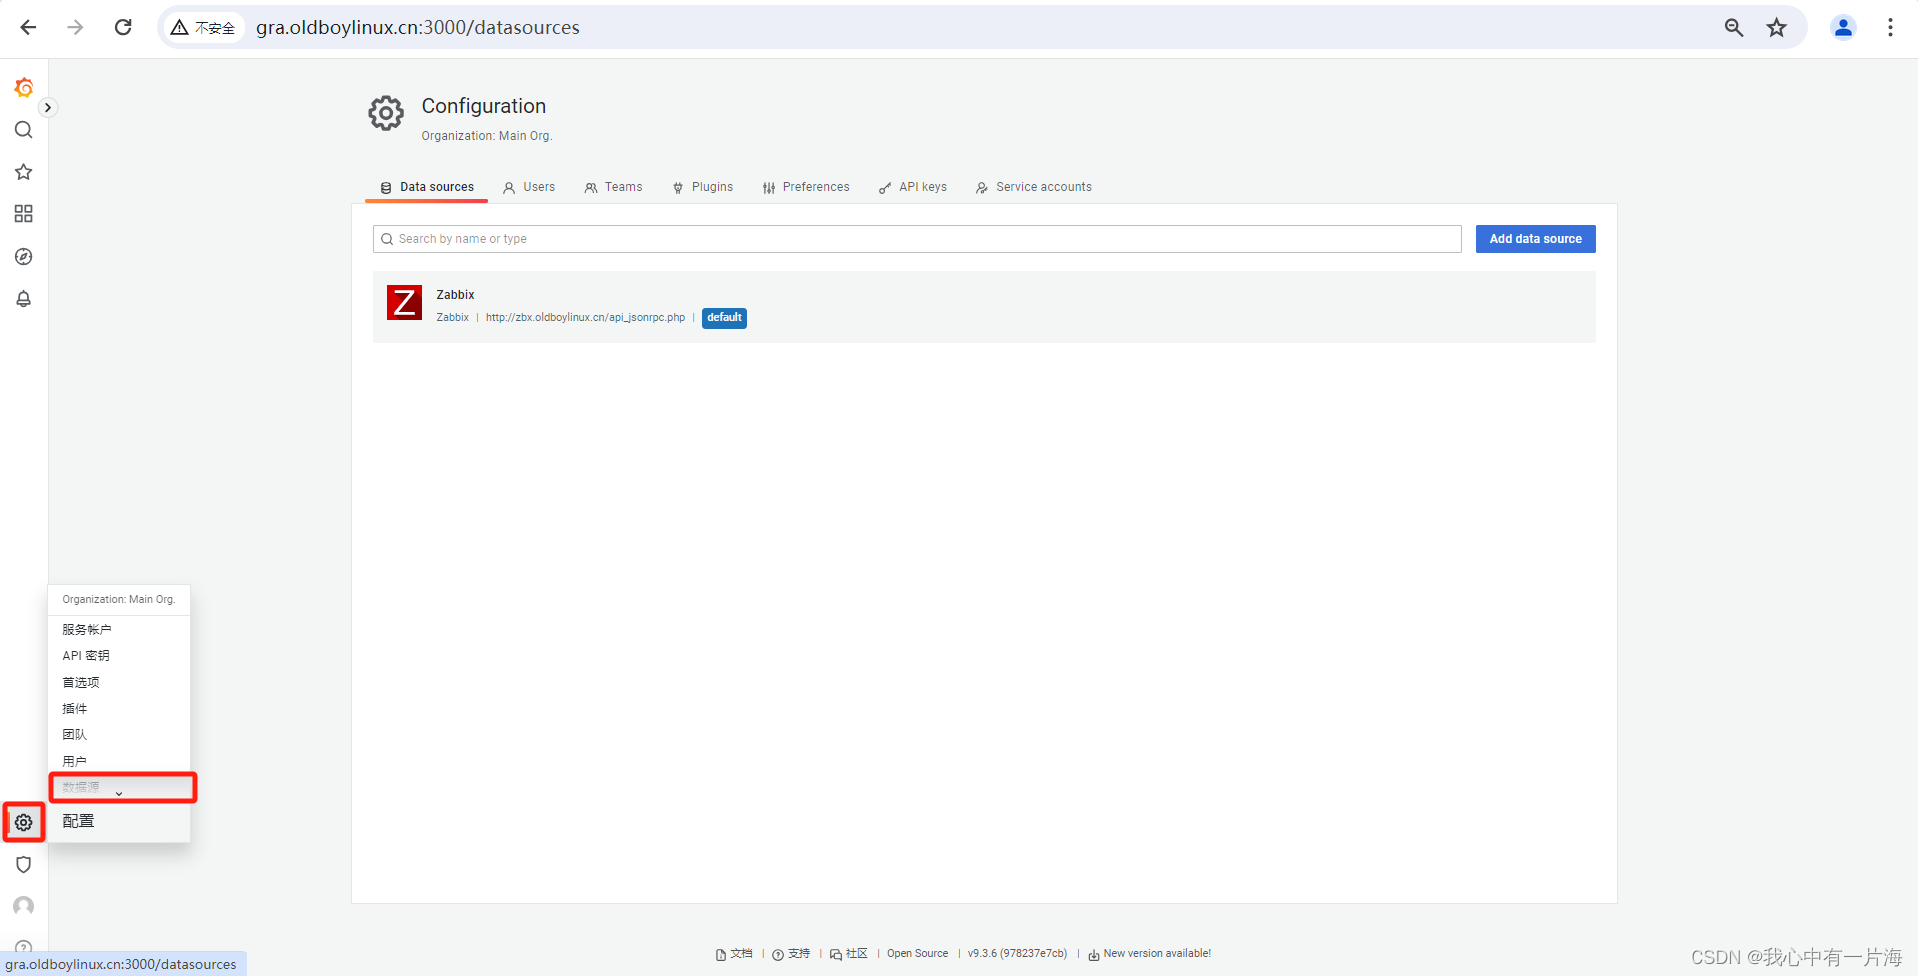
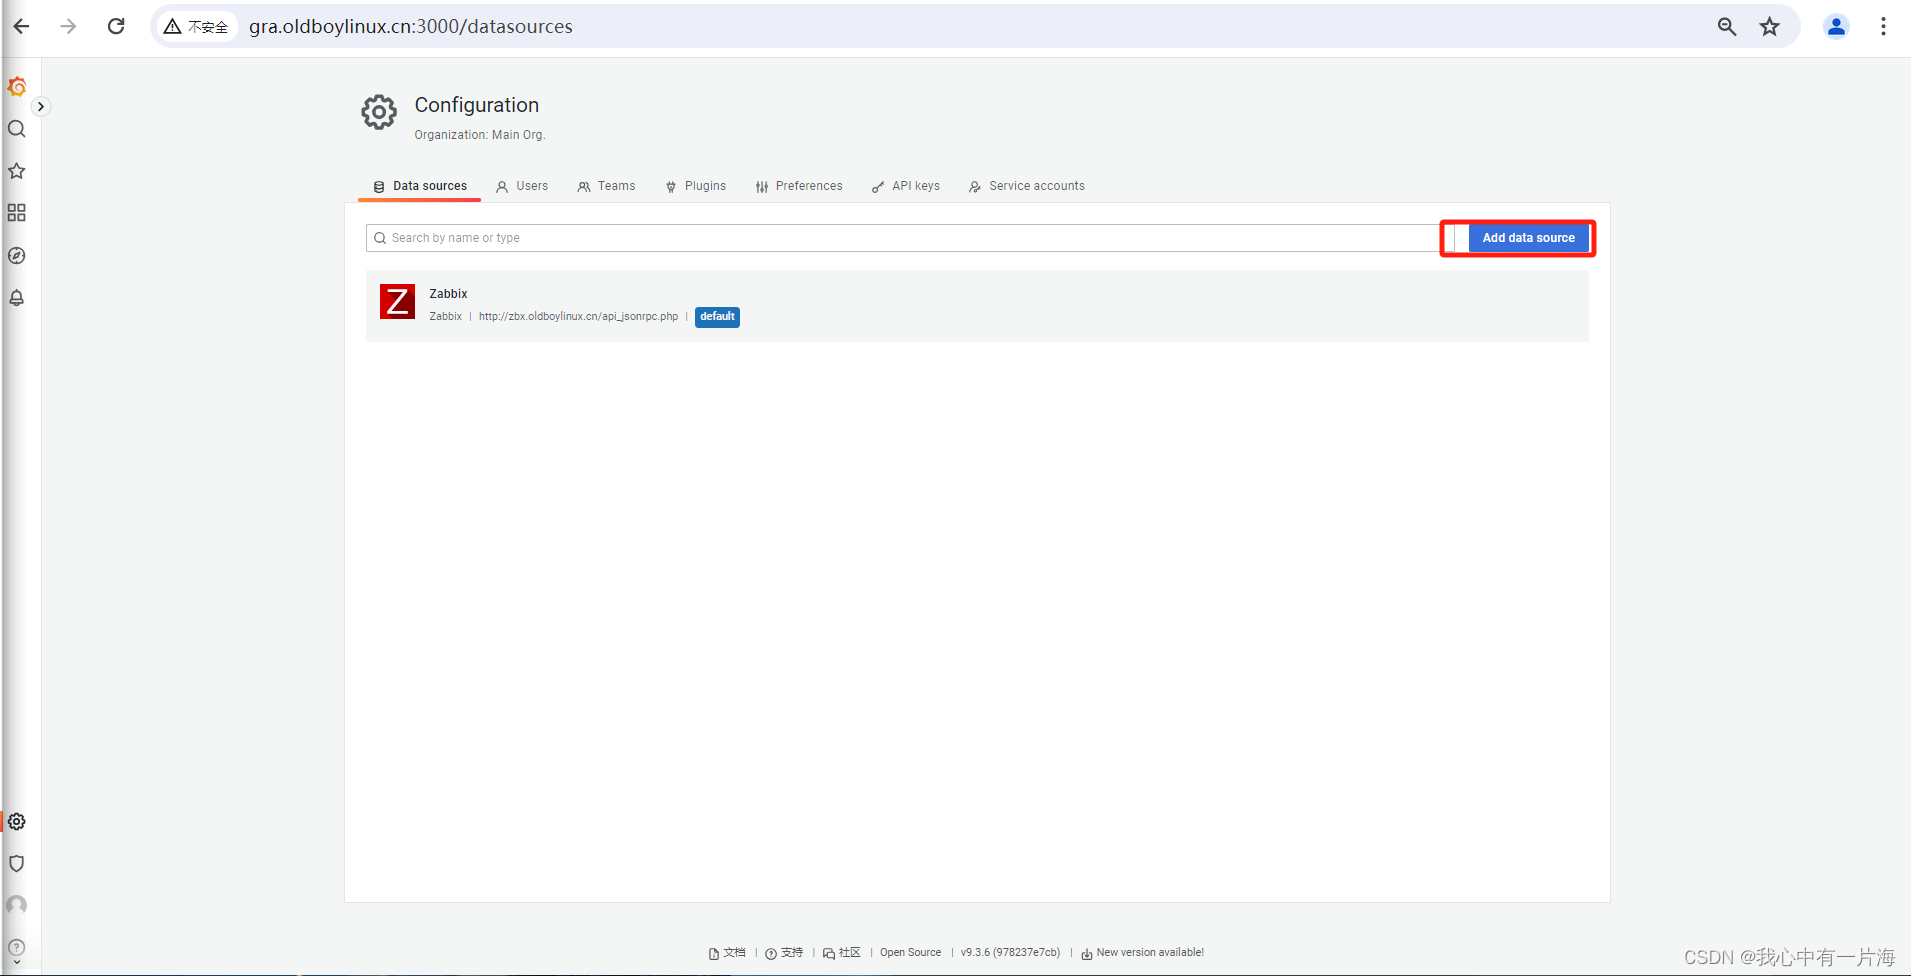
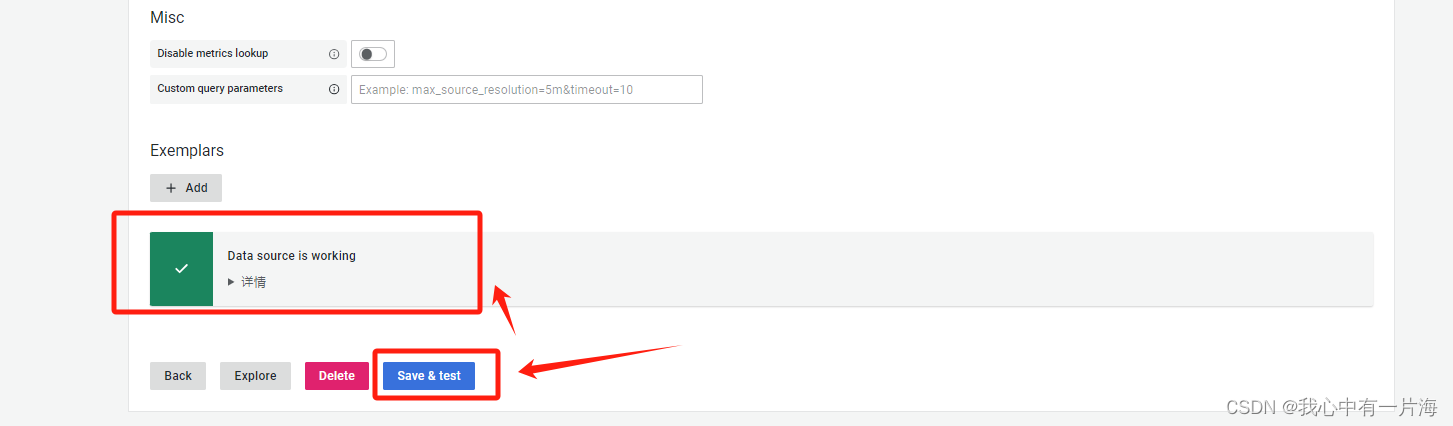
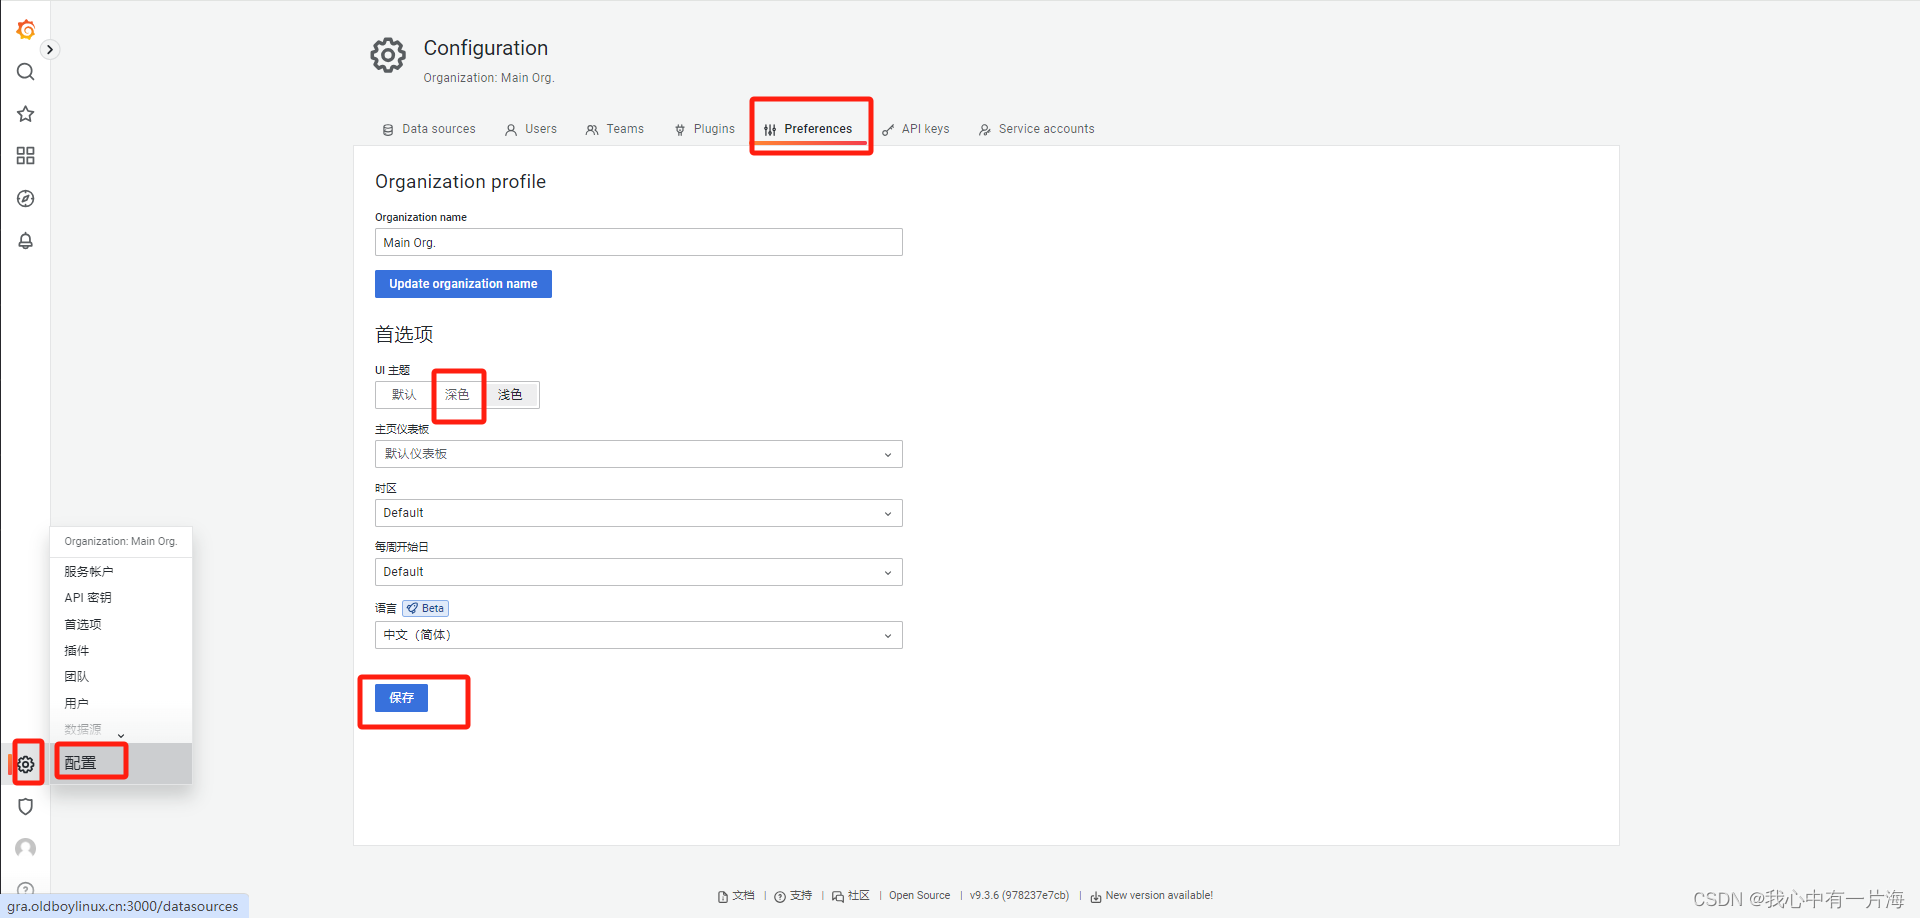
1)添加数据源
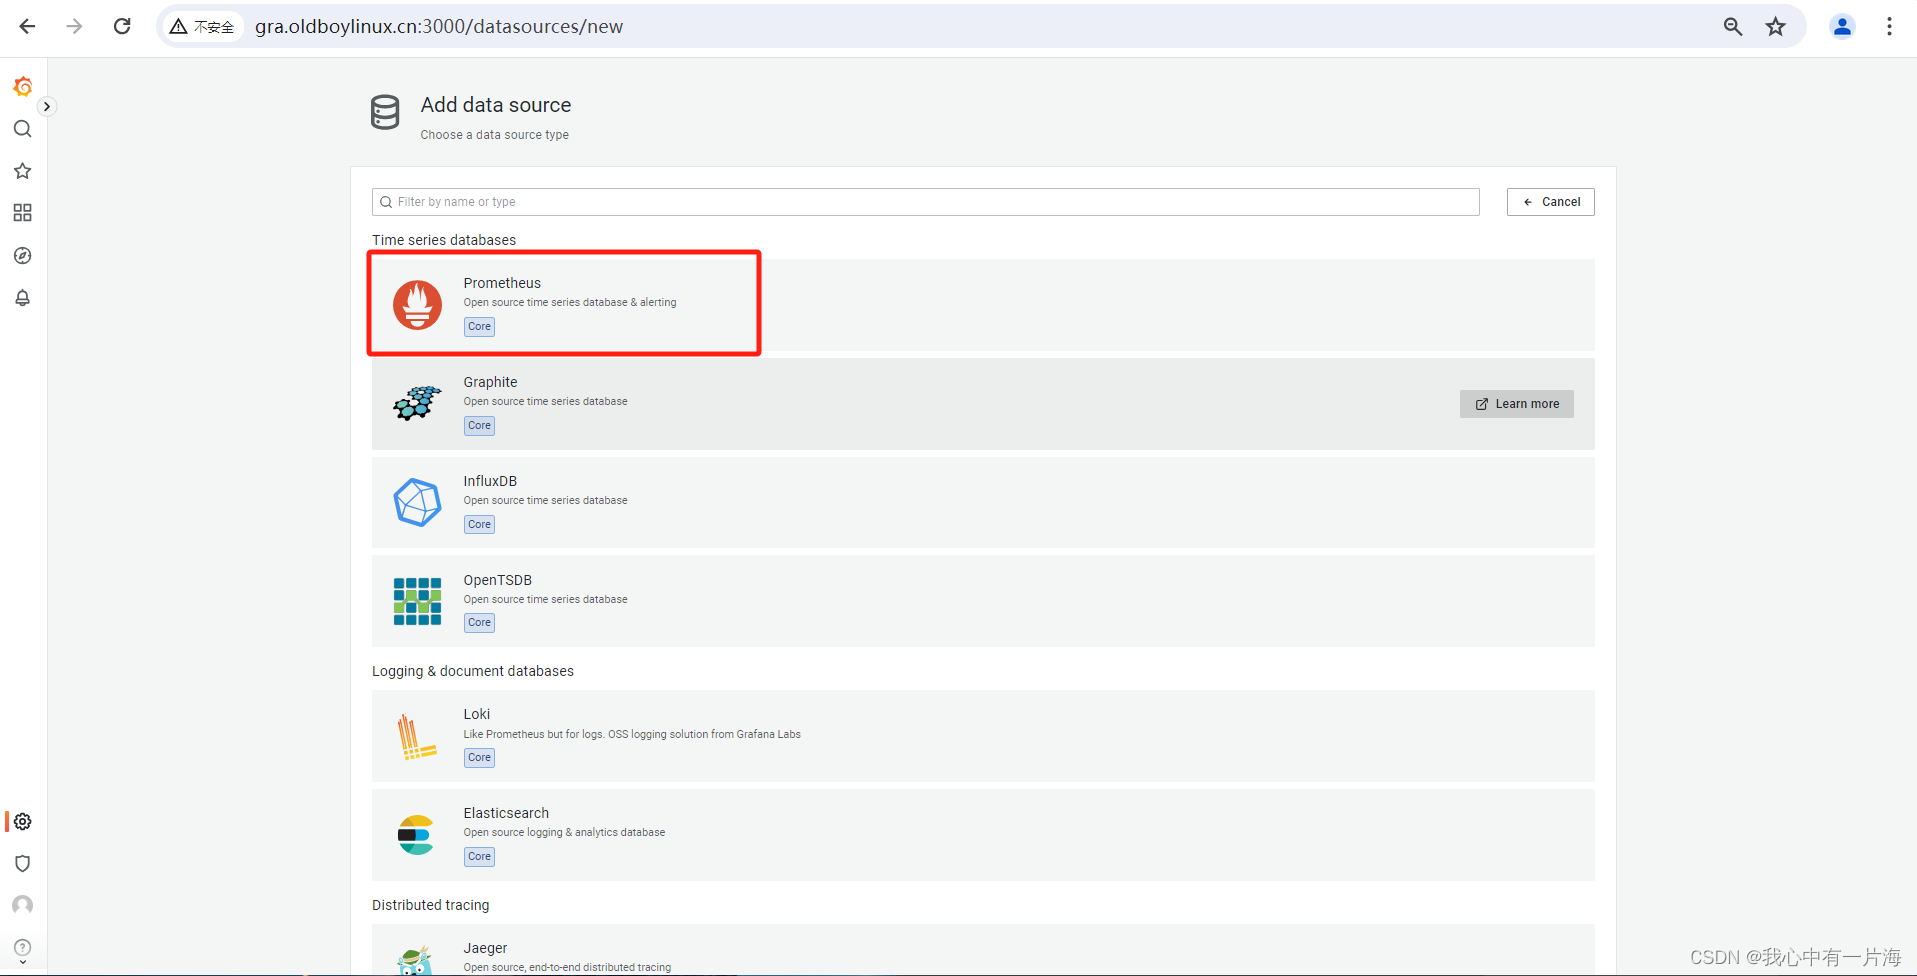
- 保存退出即可
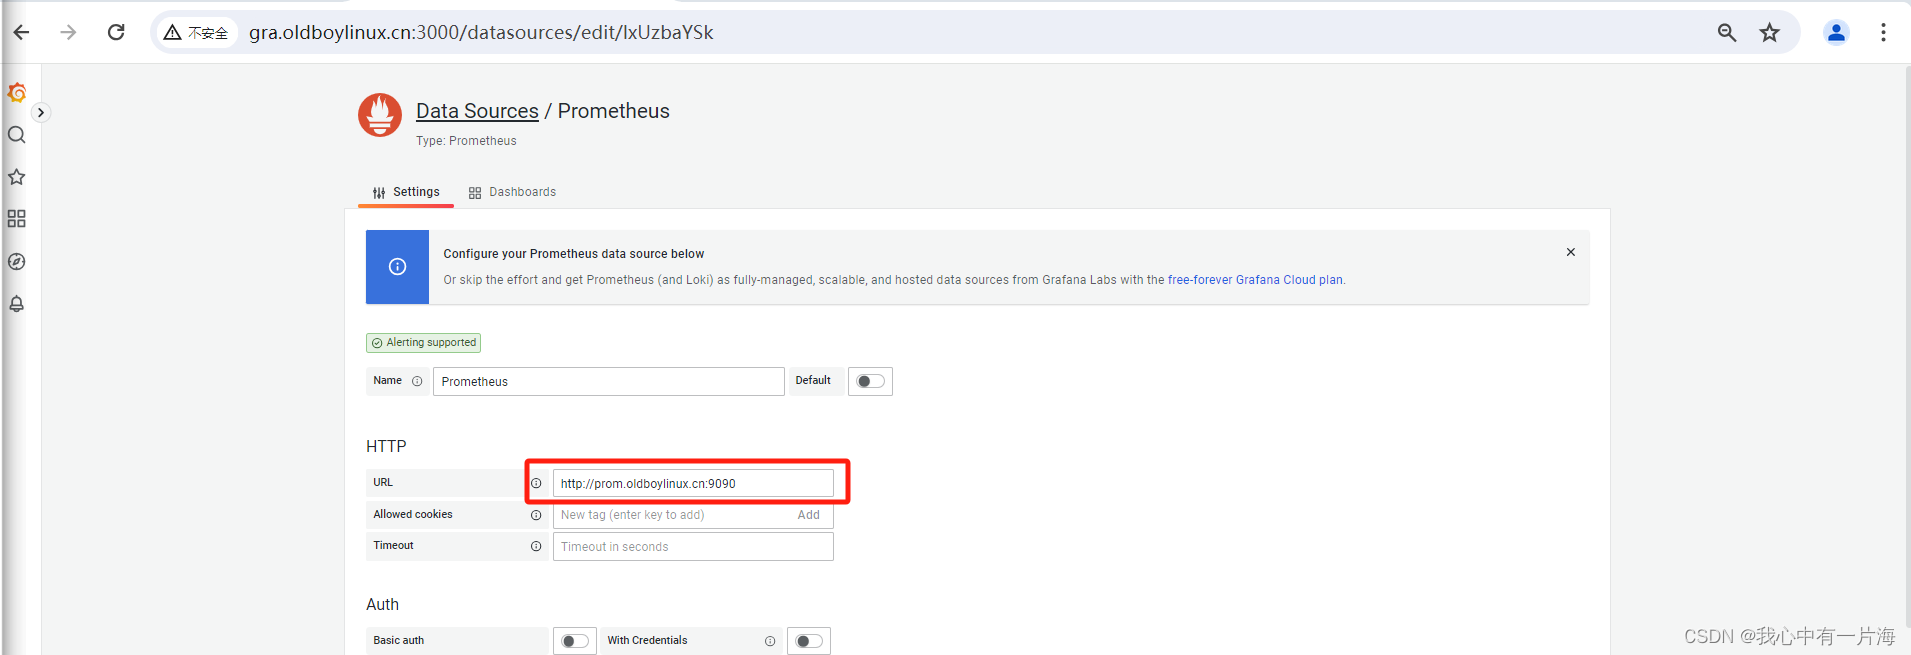
- 测试
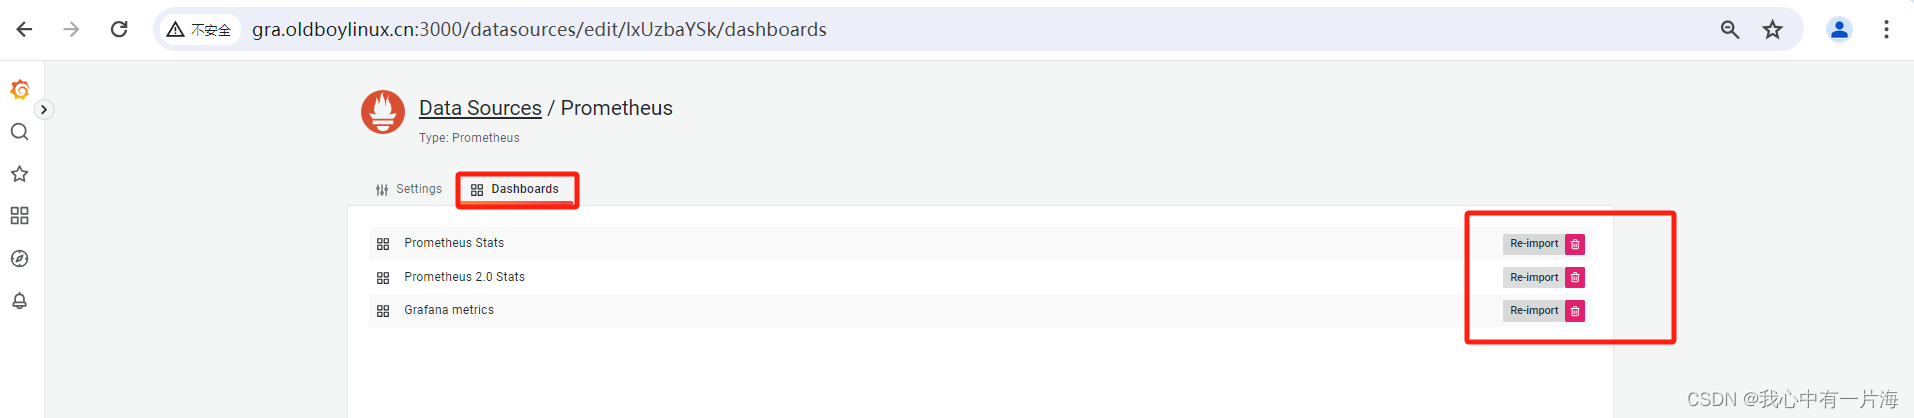
- 导入数据源自带的仪表盘
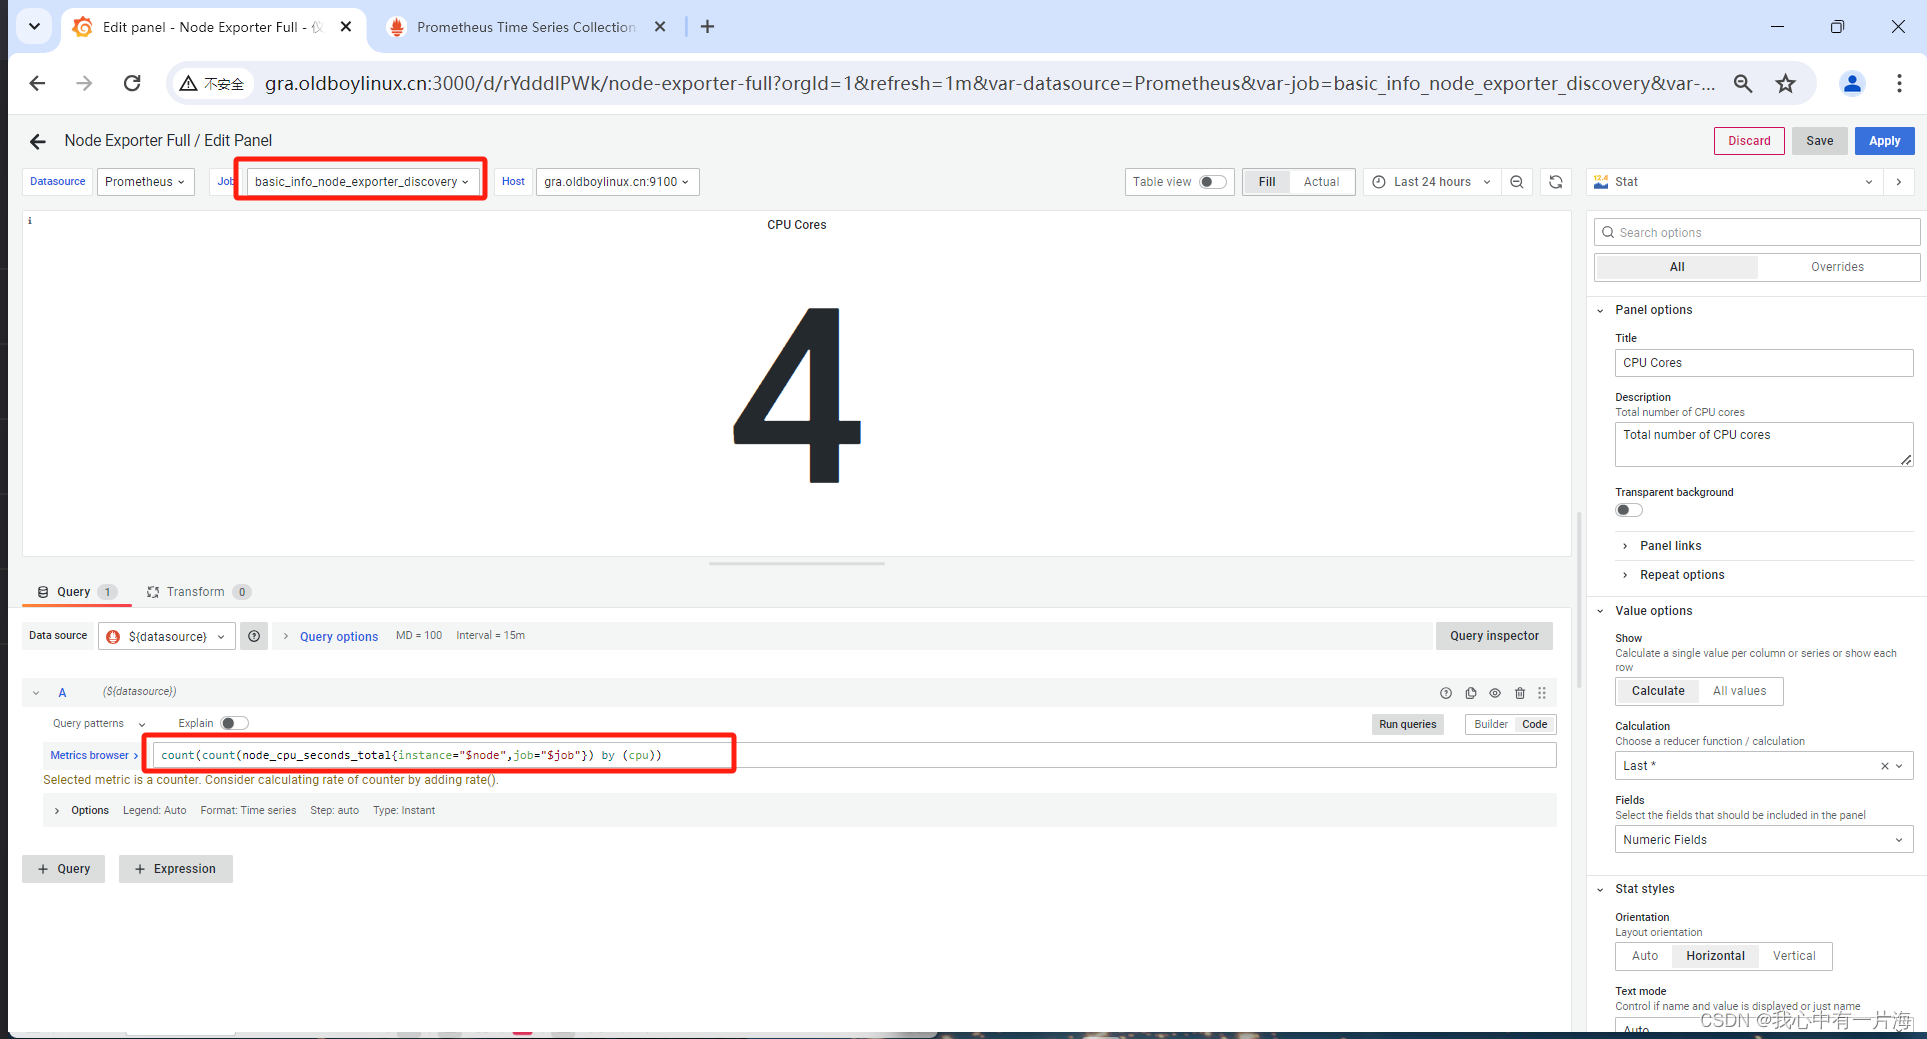
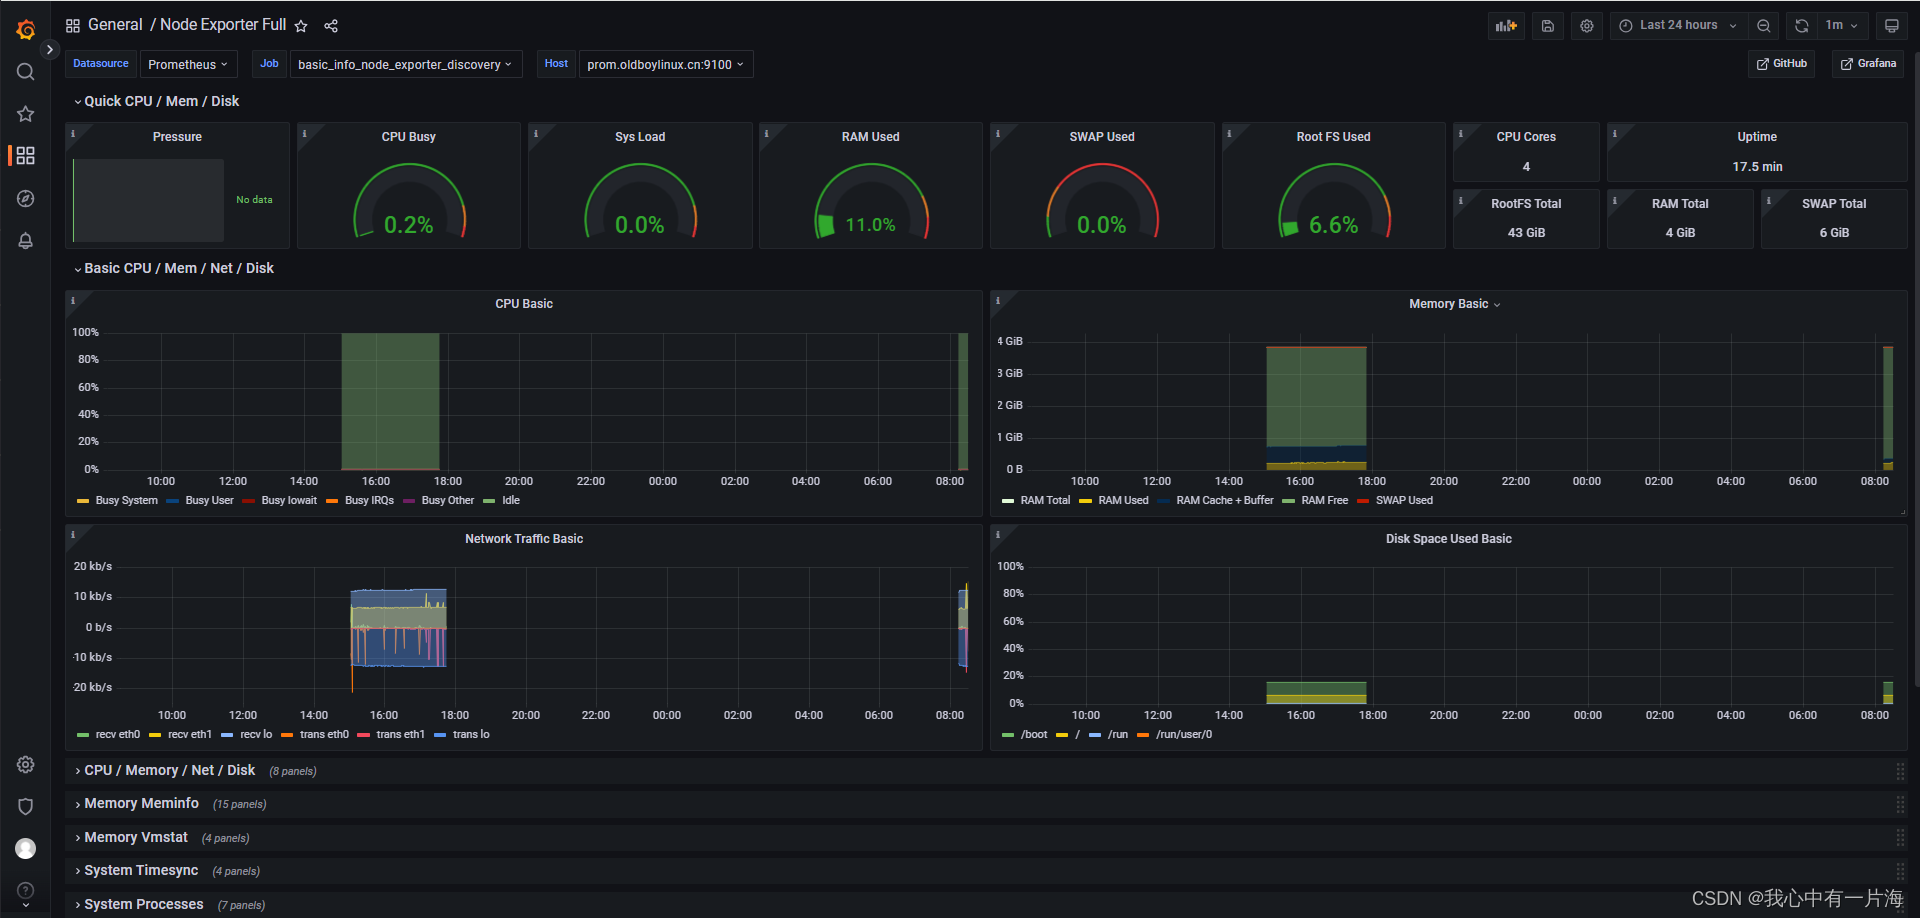
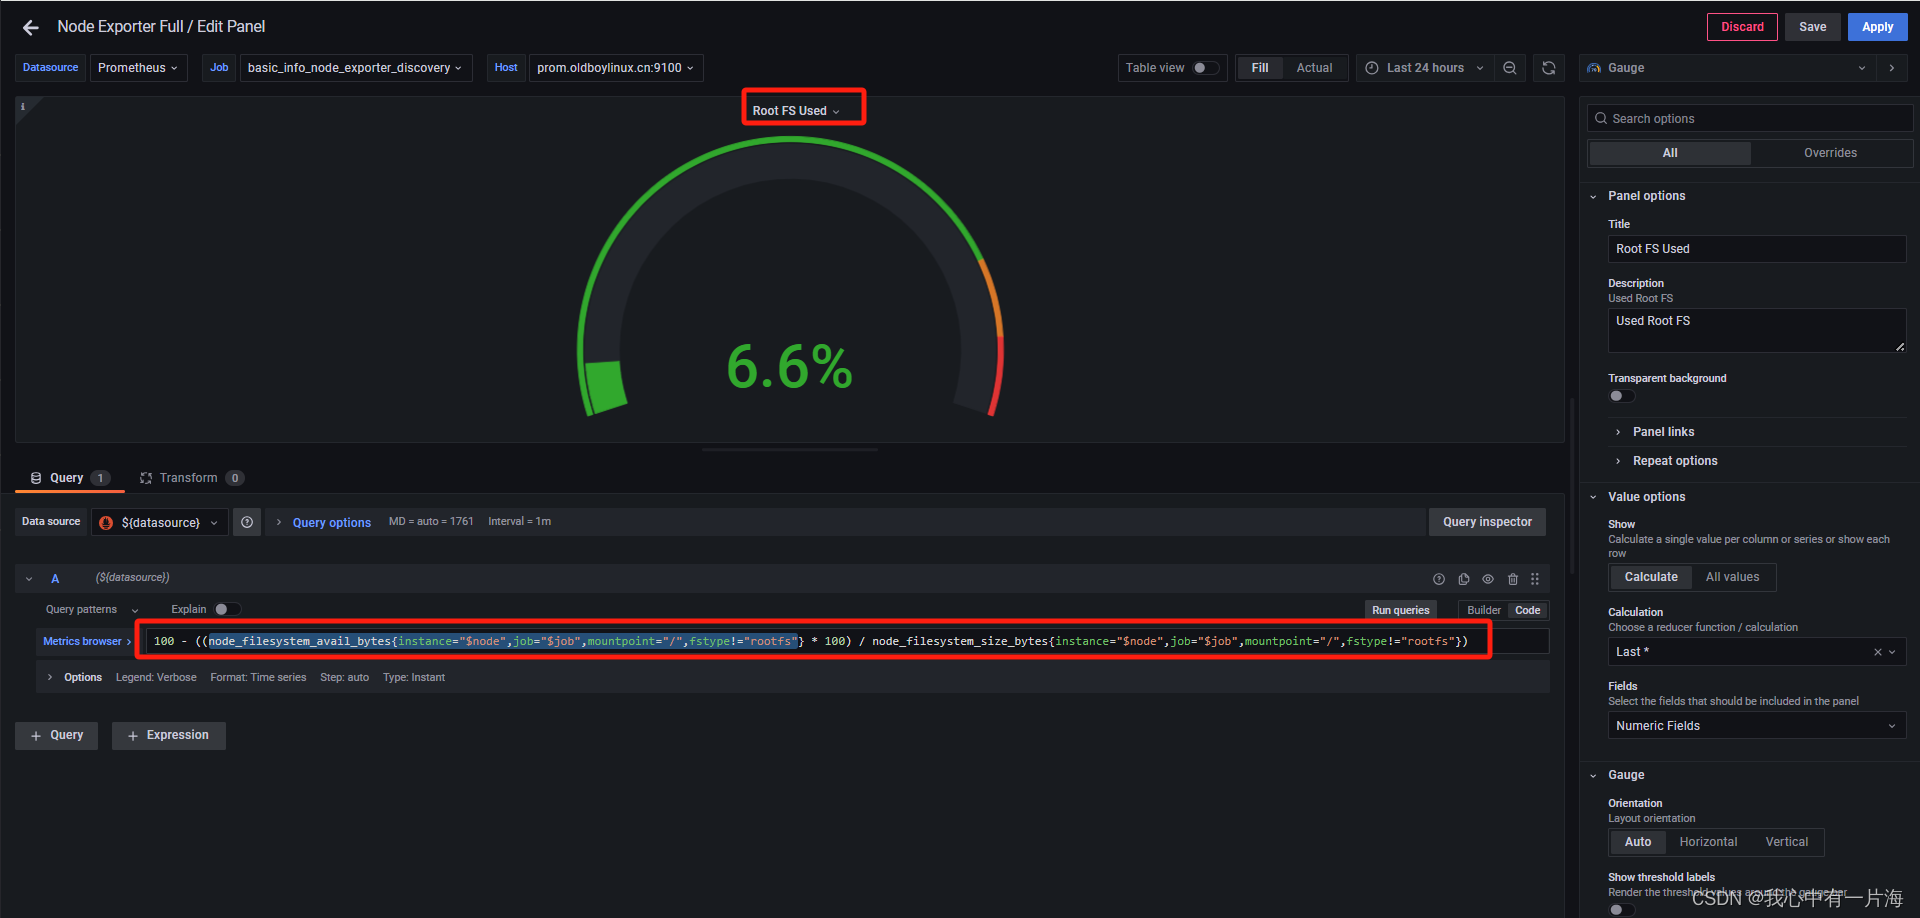
- CPU信息
count(count(node_cpu_seconds_total{instance="gra.oldboylinux.cn:9100",job="basic_info_node_exporter_discovery"})by(cpu))

第1个步骤:
取出指定的job和指定的节点的cpu信息.如果有多个cpu,cpu部分会有cpu=0 cpu=1 cpu=2 ...
node_cpu_seconds_total{instance="gra.oldboylinux.cn:9100",job="basic_info_node_exporter_discovery"

第2个步骤:
根据cpu这个部分进行去重并统计次数awk取出cpu这列 sort|uniq
count(xxxxxx第1个步骤的指令) by (cpu)  #cpu 表示这个部分, countxxx by (xxx) 根据cpu这个列去重统计次数.处理后的结果
cpu0  8
cpu1  8
cpu2  8
cpu3  8
.....

第3个步骤:
最后再次统计次数.
count( count(xxxx) by (cpu) )
2)解决仪表盘没有数据
- 修改的查询语句主要关注,job部分和instance。
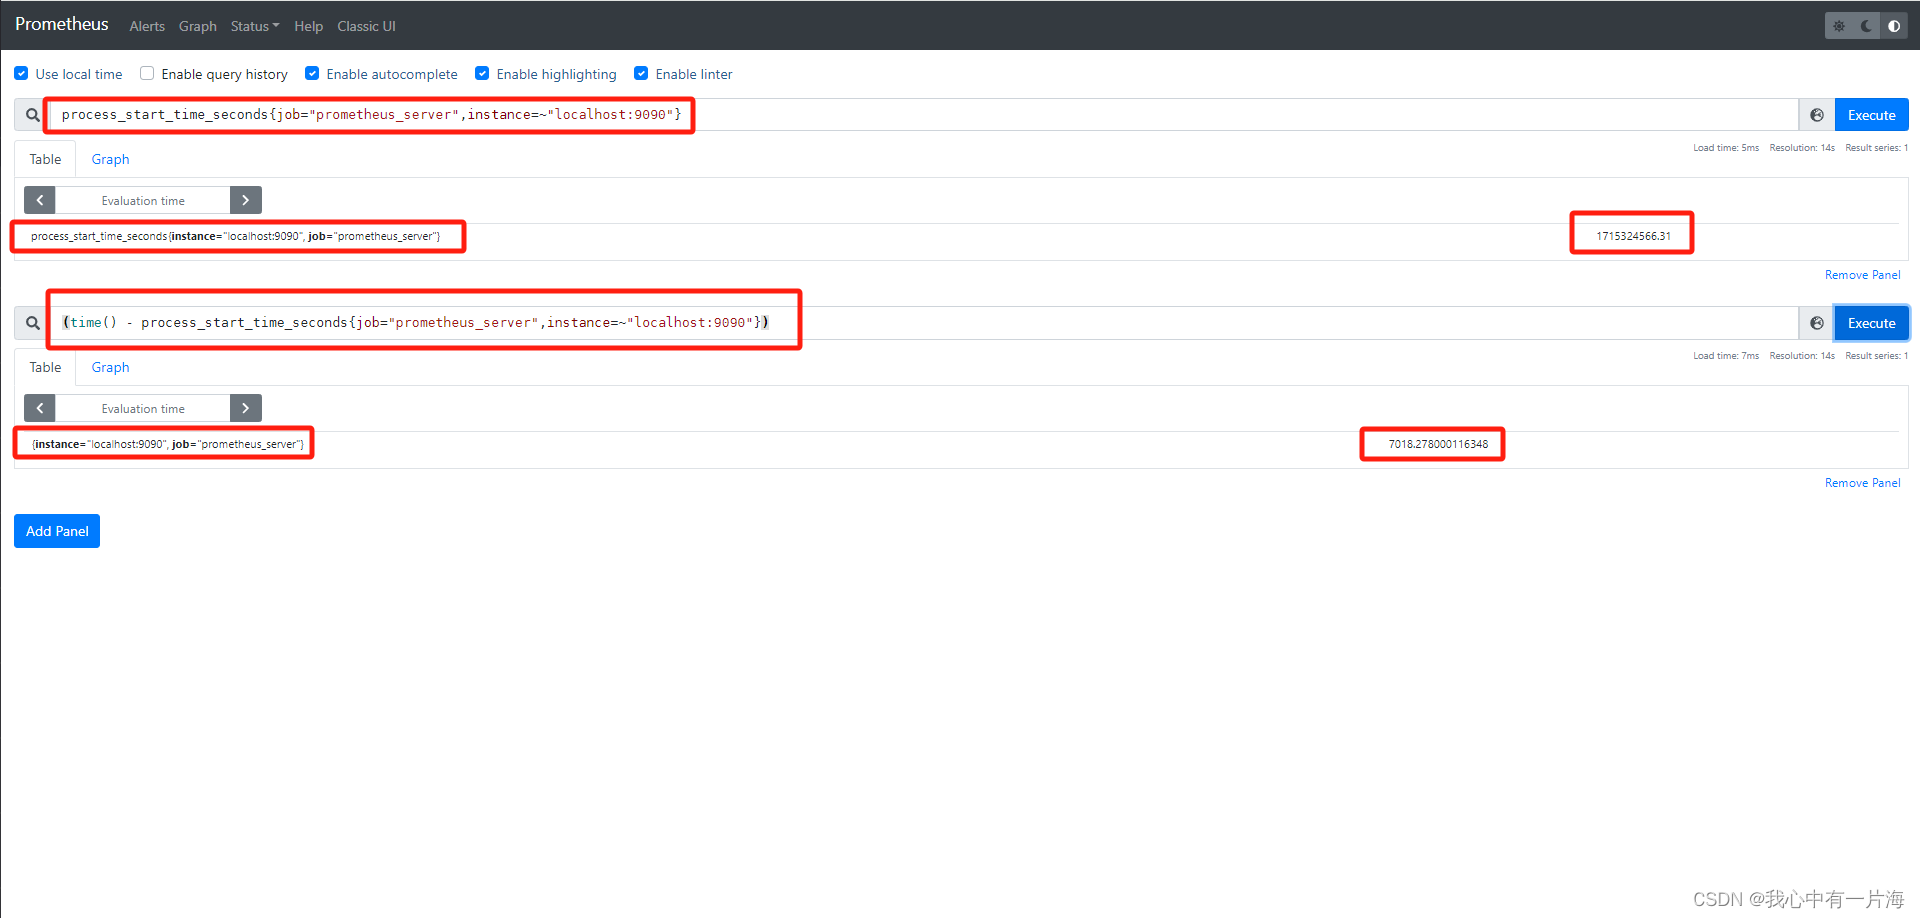
(time() - process_start_time_seconds{job="prometheus", instance=~"$node"})
time() # 当前时间,秒
(time() - process_start_time_seconds{job="prometheus_server", instance=~"$node"})
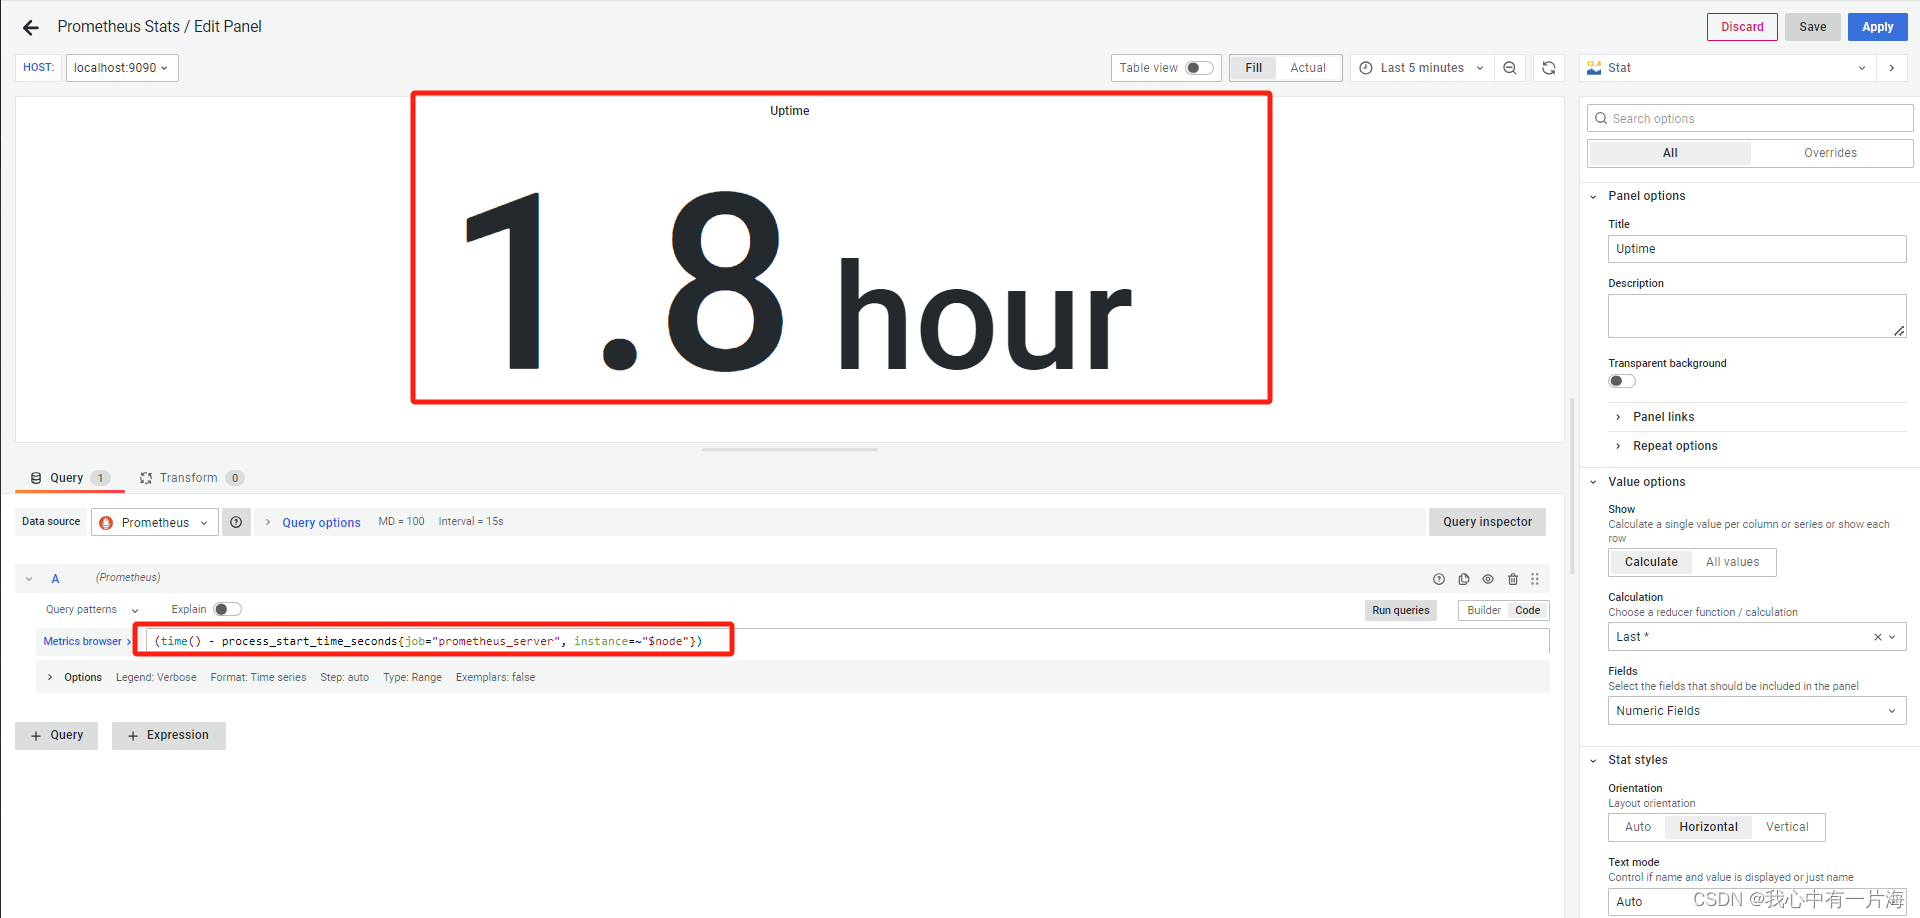
process_start_time_seconds{job="prometheus_server",instance=~"localhost:9090"}
(time() - process_start_time_seconds{job="prometheus_server",instance=~"localhost:9090"})
- 关灯
- 显示如下
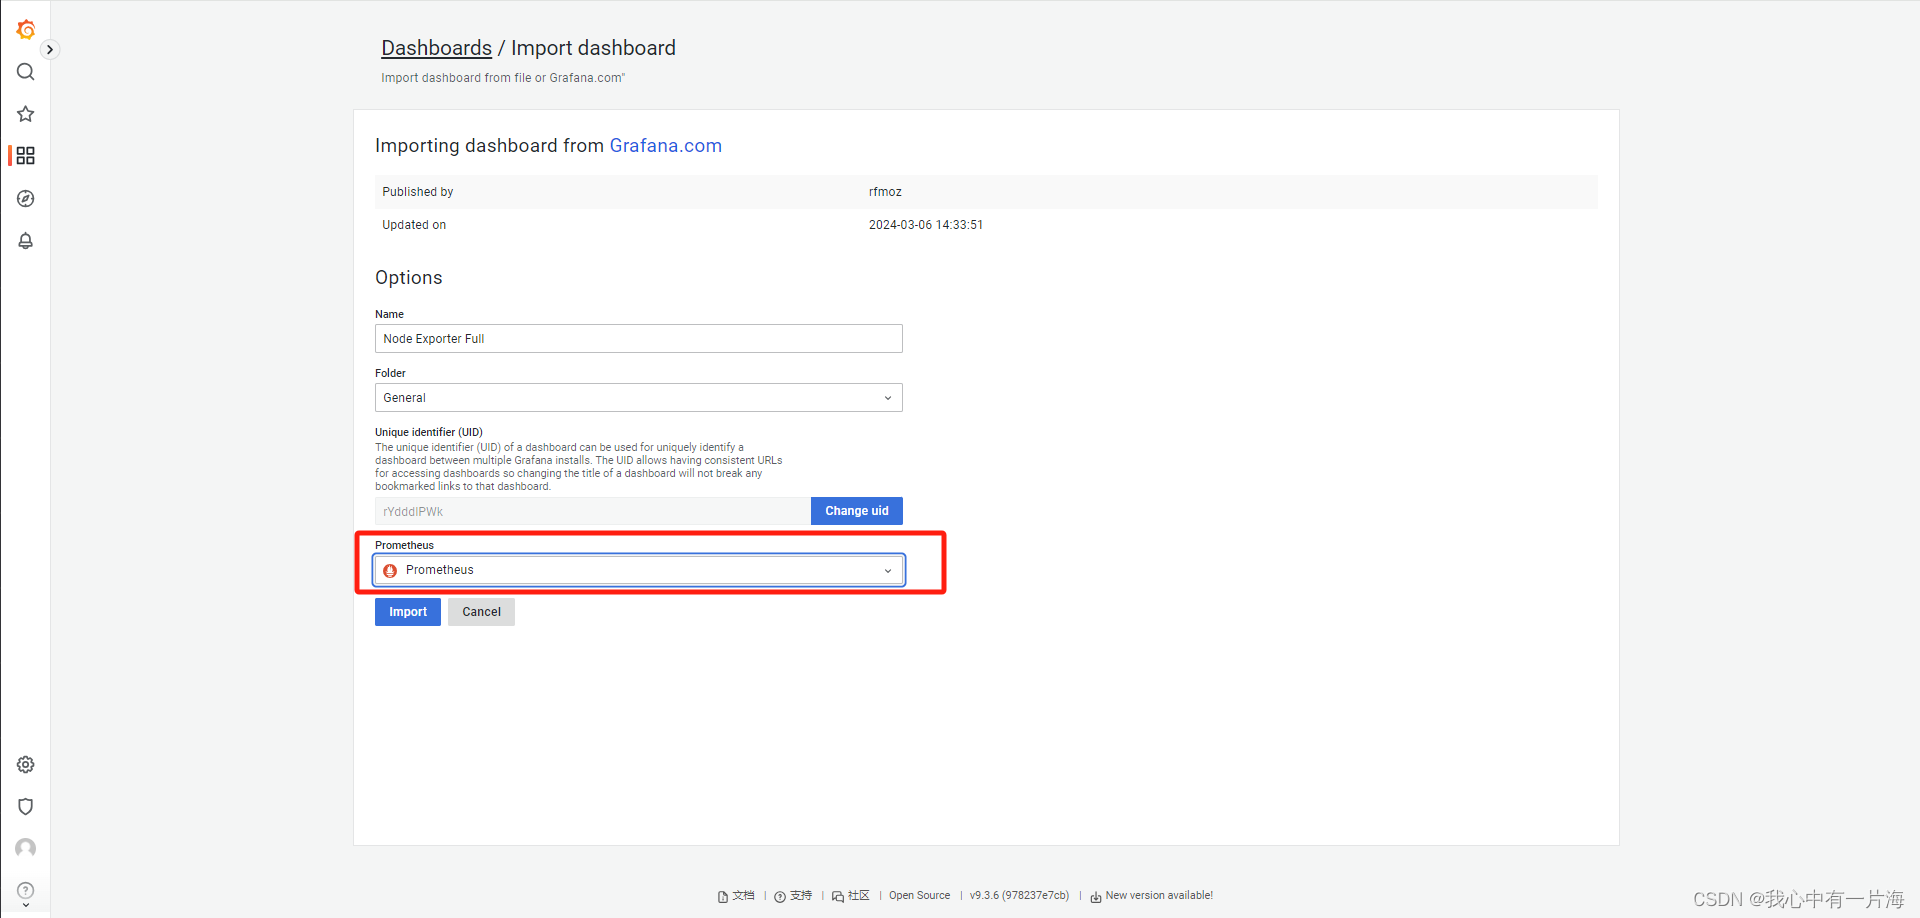
4)导入第三方仪表盘
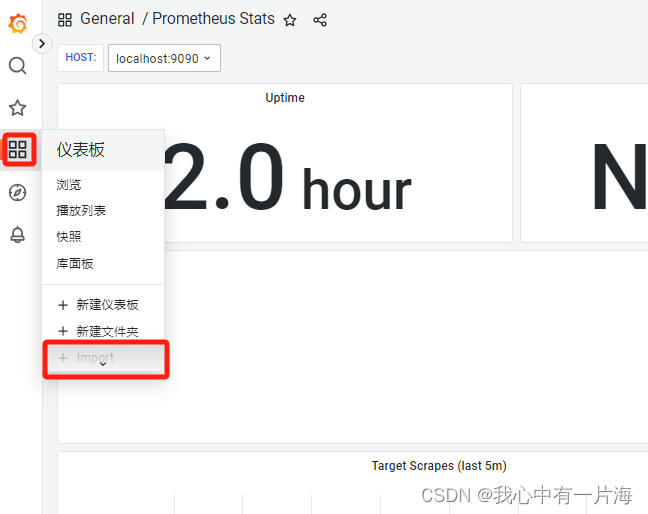
- 输入id: 1860
- 使用率、空闲率等
- 各种服务的exporter
https://github.com/nginxinc/nginx-prometheus-exporter
8. Pushgateway
- 应用场景:自定义监控项,分布式监控(zbx proxy)
8.1 使用流程
- 部署,启动pushgateway,服务端ip/域名+端口,写入配置(动态、静态)。
- 书写脚本获取你要的信息,把信息发送到pushgateway中。
8.2 Pushgateway部署
| 角色 | 主机与ip信息 |
|---|---|
| pushgatway | gra.oldboylinux.cn m03 10.0.0.63/172.16.1.63 |
- grafana节点: 部署pushgateway
# 1. 解压
[root@m03-grafana tools]# tar xf pushgateway-1.4.1.linux-amd64.tar.gz -C /app/tools/
# 2.软连接
[root@m03-grafana tools]# ln -s /app/tools/pushgateway-1.4.1.linux-amd64/ /app/tools/pushgateway
[root@m03-grafana tools]# ln -s /app/tools/pushgateway/pushgateway /bin/
# 3. 启动(后面改为systemctl管理)
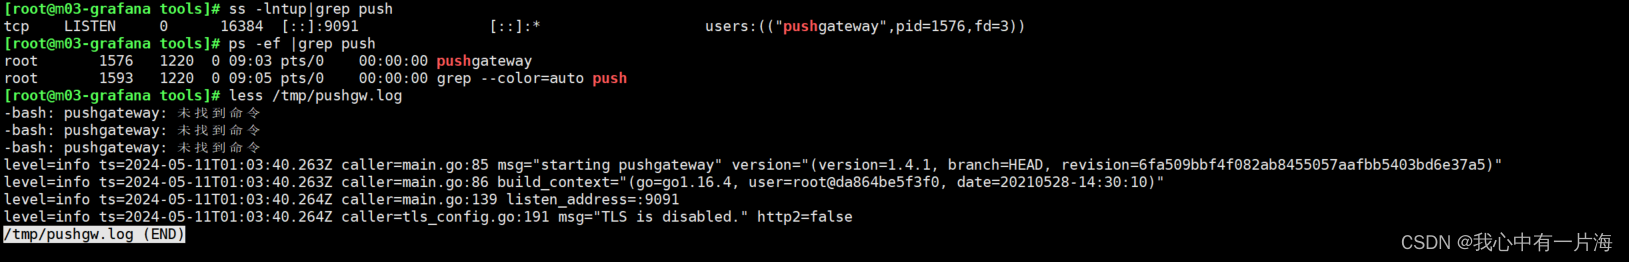
[root@m03-grafana tools]# pushgateway &>>/tmp/pushgw.log &
[1] 1576
[root@m03-grafana tools]# ss -lntup|grep push
tcp LISTEN 0 16384 [::]:9091 [::]:* users:(("pushgateway",pid=1576,fd=3))
[root@m03-grafana tools]# ps -ef |grep push
root 1576 1220 0 09:03 pts/0 00:00:00 pushgateway
root 1587 1220 0 09:04 pts/0 00:00:00 grep --color=auto push
- prometheus服务端: 修改服务端配置文件(静态)
[root@m04-prometheus prometheus]# cat prometheus.yml
global:
scrape_interval: 15s
evaluation_interval: 15s
alerting:
alertmanagers:
- static_configs:
- targets:
rule_files:
scrape_configs:
- job_name: "prometheus_server"
static_configs:
- targets: ["localhost:9090"]
# - job_name: "basic_info_node_exporter"
# static_configs:
# - targets:
# - "prom.oldboylinux.cn:9100"
# - "gra.oldboylinux.cn:9100"
- job_name: "basic_info_node_exporter_discovery"
file_sd_configs:
- files:
- /app/tools/prometheus/discovery_node_exporter.json
refresh_interval: 5s
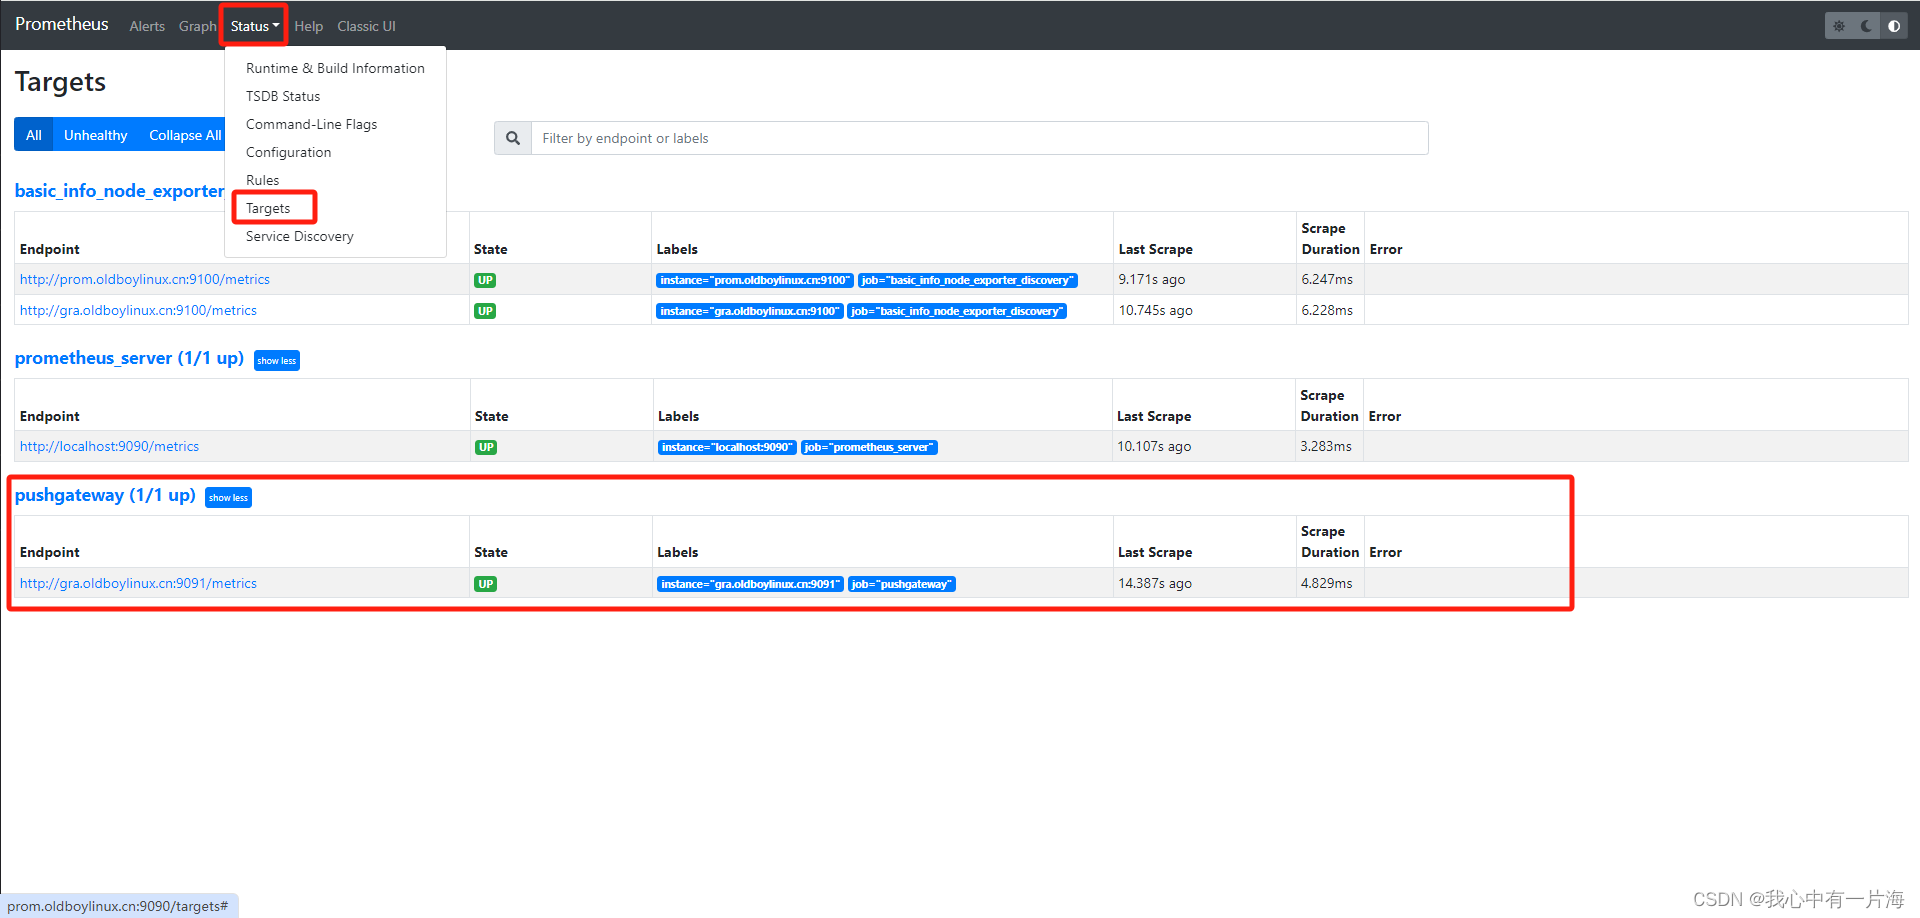
- job_name: "pushgateway"
static_configs:
- targets:
- "gra.oldboylinux.cn:9091"
[root@m04-prometheus prometheus]# systemctl restart prometheus.service
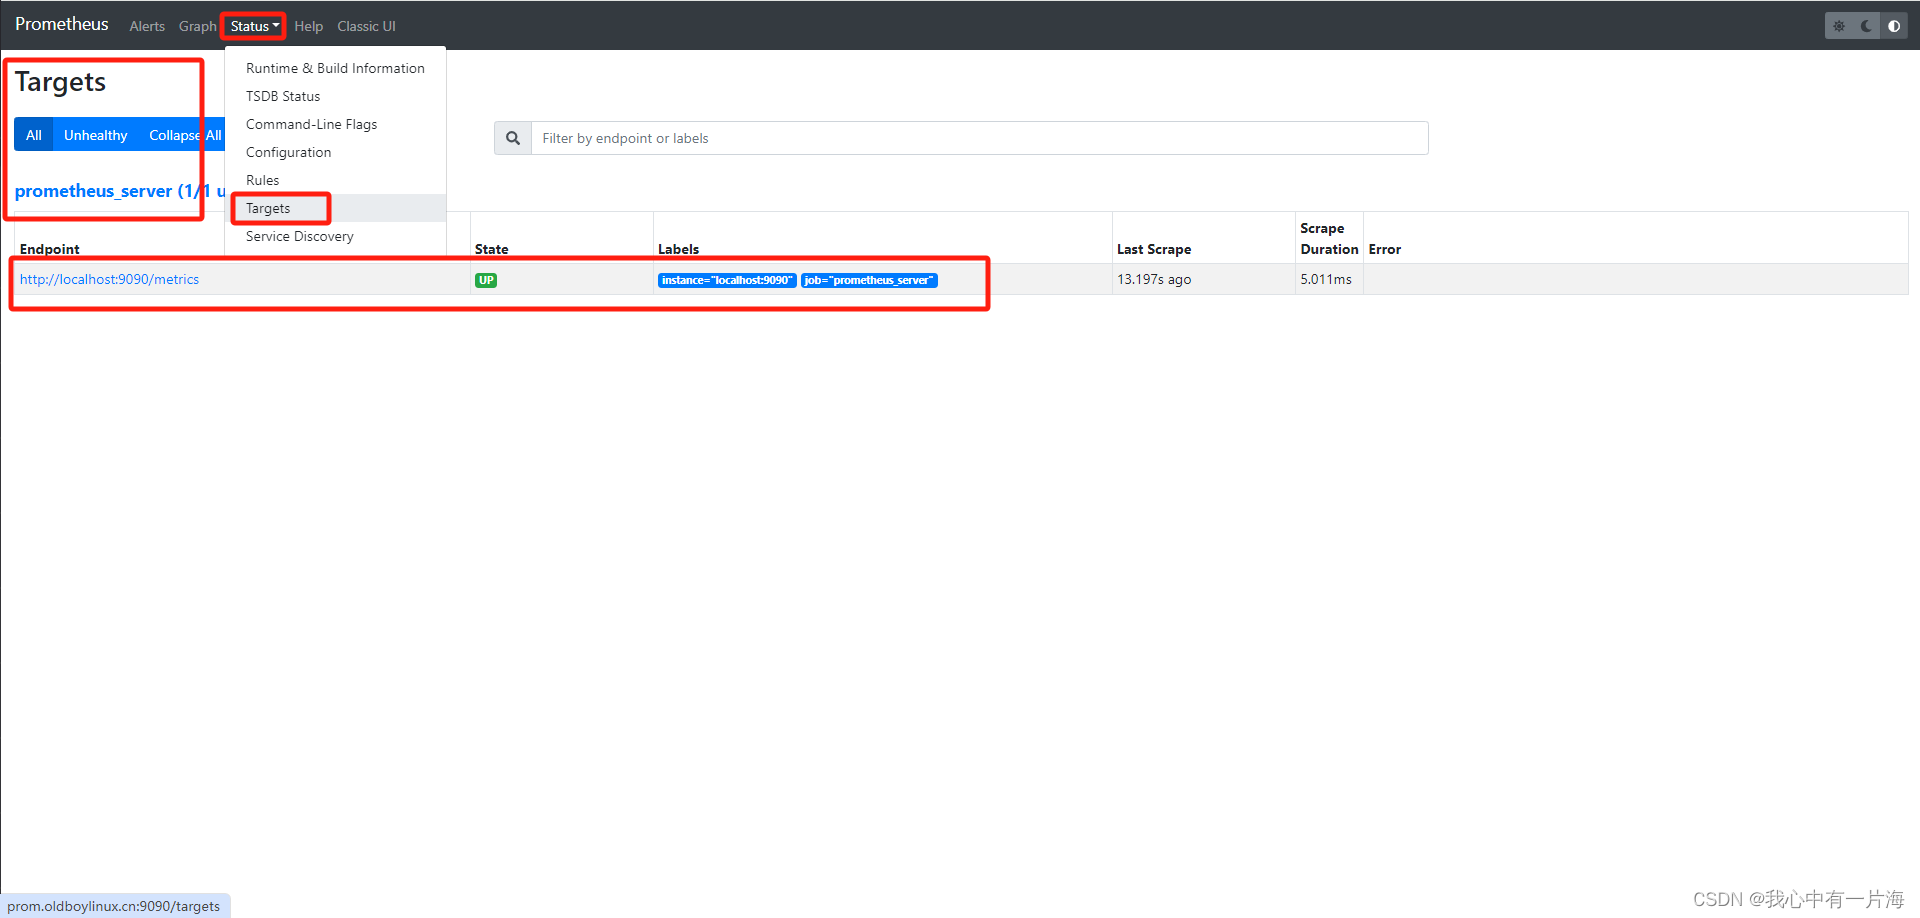
- 检查 检查是否添加成功
8.3 书写脚本与提交数据
1)自定有监控cpu核心总数
cpu核心总数
lscpu |awk '/^CPU\(s\):/{print $2}'
- 脚本及测试
[root@m03-grafana ~]# cat /server/scripts/diy_push_cpu_cores.sh
#!/bin/bash
#1.vars
job="pushgateway_metrics"
ins="gra.oldboylinux.cn:9091"
pushgw="http://gra.oldboylinux.cn:9091"
cores=`lscpu |awk '/^CPU\(s\):/{print $2}'`
#2.
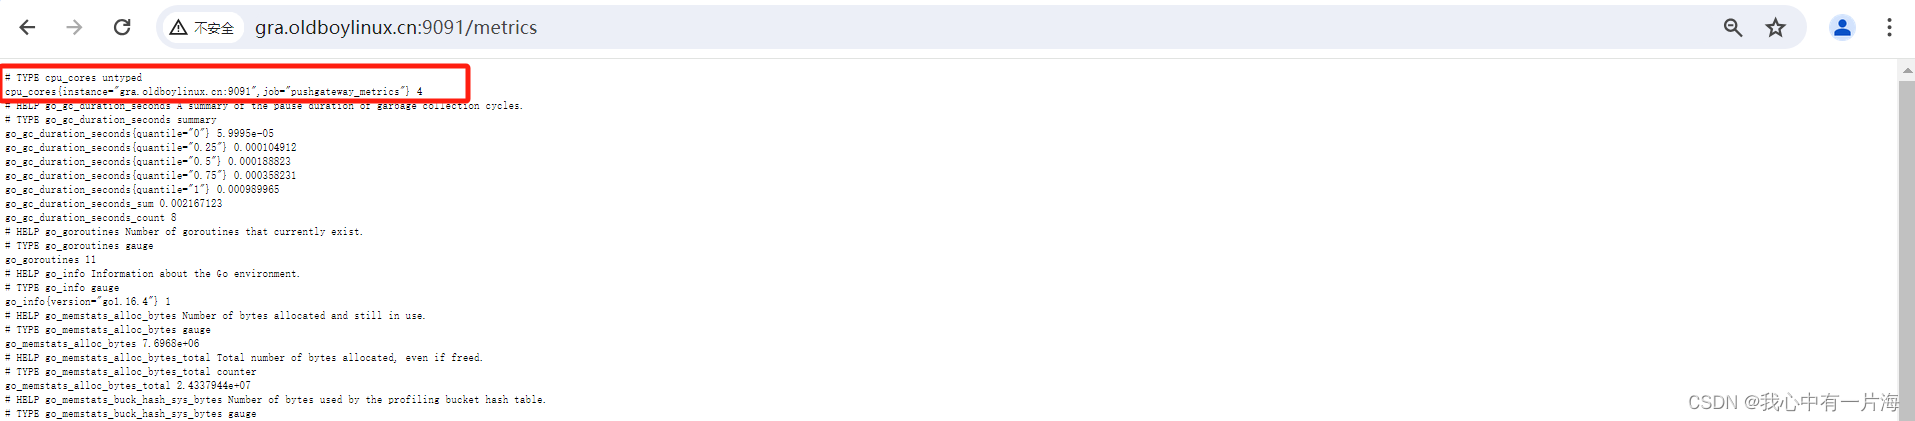
echo "cpu_cores $cores"|\
curl --data-binary @- ${pushgw}/metrics/job/${job}/instance/${ins}
# curl --data-binary @- http://gra.oldboylinux.cn:9091/metrics/job/分组名/instance/实例名字
# --data-binary 发出POST请求,上传数据
# @- 数据来自于管道(标准输入)
[root@m03-grafana ~]# sh -x /server/scripts/diy_push_cpu_cores.sh
+ job=pushgateway_metrics
+ ins=gra.oldboylinux.cn:9091
+ pushgw=http://gra.oldboylinux.cn:9091
++ lscpu
++ awk '/^CPU\(s\):/{print $2}'
+ cores=4
+ echo 'cpu_cores 4'
+ curl --data-binary @- http://gra.oldboylinux.cn:9091/metrics/job/pushgateway_metrics/instance/gra.oldboylinux.cn:9091
- 显示

2)再来一个脚本
# 取值根分区的大小
# 取值根分区的已用大小
# 取值根分区的未使用大小
[root@m03-grafana ~]# cat /server/scripts/diy_push_disk_usage.sh
#!/bin/bash
# 1.vars
job="pushgateway_metrics"
ins="gra.oldboylinux.cn:9091"
pushgw="http://gra.oldboylinux.cn:9091"
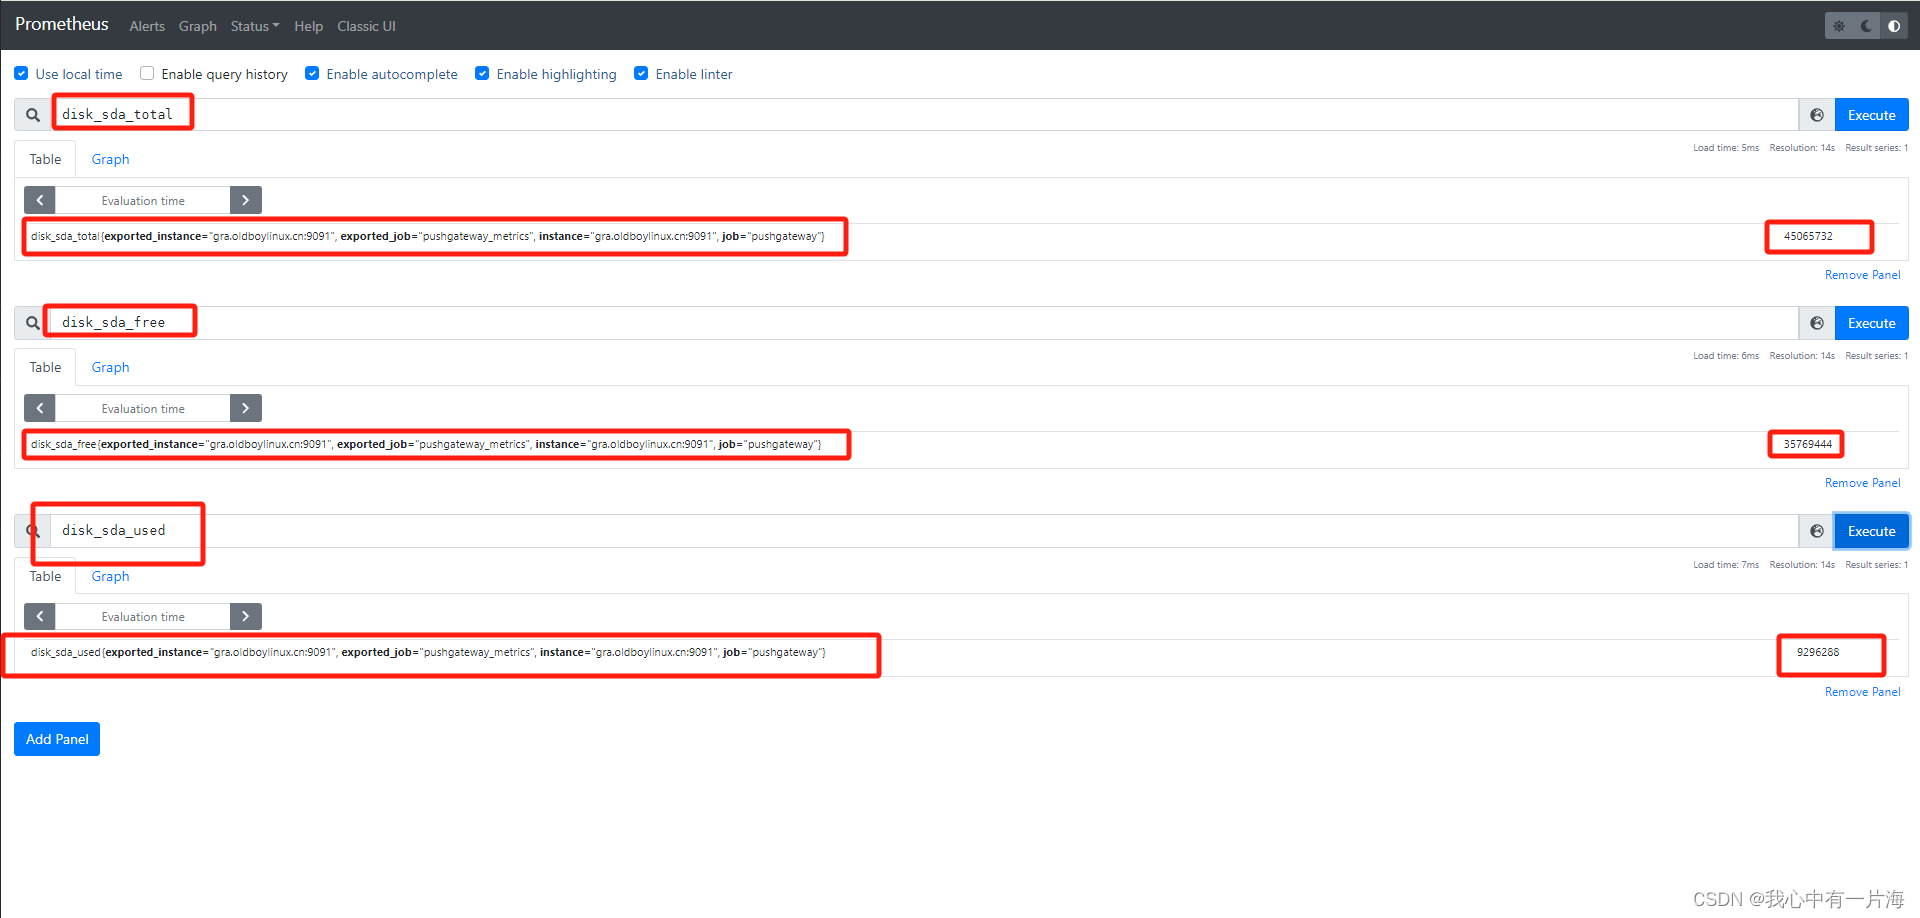
disk_sda_root_total=`df |awk '$NF=="/"{print $2}'`
disk_sda_root_free=`df |awk '$NF=="/"{print $4}'`
disk_sda_root_used=`df |awk '$NF=="/"{print $3}'`
# 3.
echo "disk_sda_total $disk_sda_root_total"|\
curl --data-binary @- ${pushgw}/metrics/job/${job}/instance/${ins}
echo "disk_sda_free $disk_sda_root_free"|\
curl --data-binary @- ${pushgw}/metrics/job/${job}/instance/${ins}
echo "disk_sda_used $disk_sda_root_used"|\
curl --data-binary @- ${pushgw}/metrics/job/${job}/instance/${ins}
[root@m03-grafana ~]# sh -x /server/scripts/diy_push_disk_usage.sh
+ job=pushgateway_metrics
+ ins=gra.oldboylinux.cn:9091
+ pushgw=http://gra.oldboylinux.cn:9091
++ df
++ awk '$NF=="/"{print $2}'
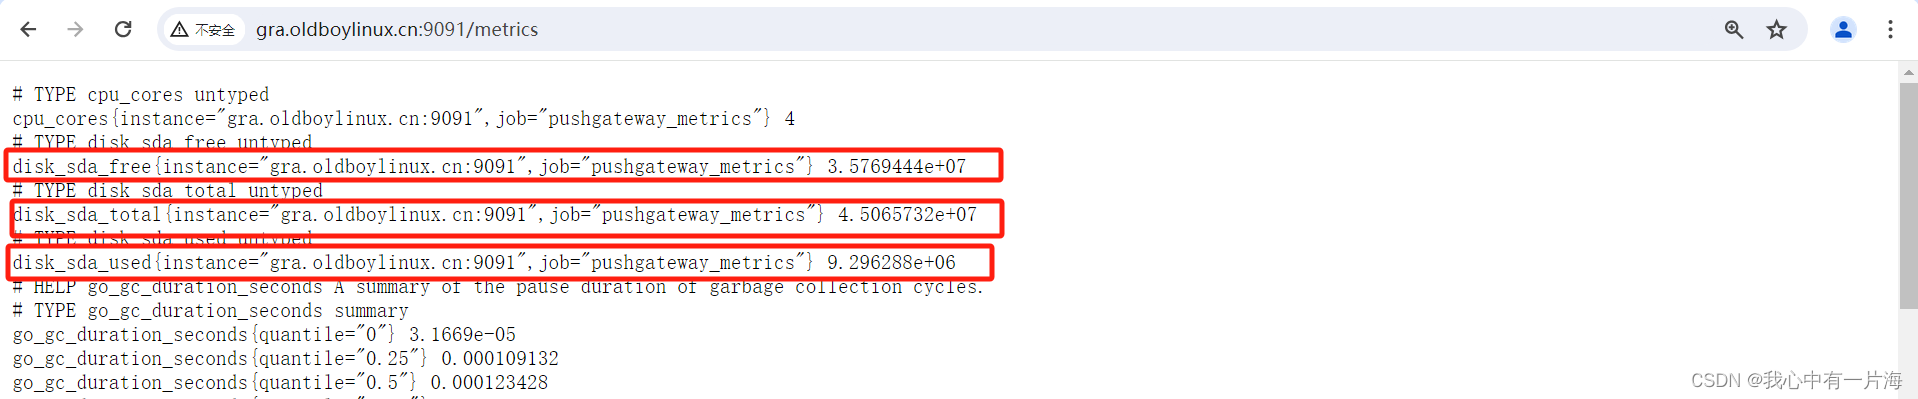
+ disk_sda_root_total=45065732
++ df
++ awk '$NF=="/"{print $4}'
+ disk_sda_root_free=35769444
++ df
++ awk '$NF=="/"{print $3}'
+ disk_sda_root_used=9296288
+ echo 'disk_sda_total 45065732'
+ curl --data-binary @- http://gra.oldboylinux.cn:9091/metrics/job/pushgateway_metrics/instance/gra.oldboylinux.cn:9091
+ echo 'disk_sda_free 35769444'
+ curl --data-binary @- http://gra.oldboylinux.cn:9091/metrics/job/pushgateway_metrics/instance/gra.oldboylinux.cn:9091
+ echo 'disk_sda_used 9296288'
+ curl --data-binary @- http://gra.oldboylinux.cn:9091/metrics/job/pushgateway_metrics/instance/gra.oldboylinux.cn:9091
8.4 小结
- pushgateway用于实现对监控进行补充,类似于zbx自定义监控项.
- 脚本交给定时任务或死循环每5秒执行一次.
今日总结
Prometheus
-
部署各种exporter:
- node_exporter
- nginx_exporter (docker)
- mysql_exporter (docker)
- jmx(docker)
-
与Grafana结合
- 一些模板(仪表盘)
- 修改


 1653
1653


 被折叠的 条评论
为什么被折叠?
被折叠的 条评论
为什么被折叠?
 到【灌水乐园】发言


