


 本文介绍如何使用Ruby on Rails (RoR) 和 ArcGIS Online Map快速构建Location Based Service (LBS) 应用,包括环境搭建、数据库配置、首页设置及定时刷新地图数据等关键步骤。
一个使用Ruby on Rails开发LBS网站的简单实例
cheungmine
2011-7
这几天一直在学习使用Ruby on Rails(RoR),想建立一个功能全面一点的LBS(Location Based Service)网站。但是对于我这个RoR的初学者(仅有几天时间)来说,毕竟太复杂了。因此本文试图简化原来的设计思路,抛弃一切权限管理,仅仅对数据表中的坐标位置进行插入和更新。也就是,使用表单提交用户坐标位置信息,地图页面定时刷新获取这些信息并显示在地图上。通过这个例子,来熟悉RoR的编程,熟悉ArcGIS Online Map。掌握Ajax在RoR中的一般用法(RJS)。
关键词:Ruby, RoR, MySQL, LBS, Ajax, RJS, ArcGIS Online Map, Dojo
0 安装RubyOnRails
Windows环境下一键安装RubyOnRails开发环境
1)直接点击链接下载:
http://rubyforge.org/frs/download.php/29867/InstantRails-2.0-win.zip
2)或者进入下载页面,选择要安装的版本:http://rubyforge.org/frs/?group_id=904
3)在Windows下安装InstantRails-2.0-win, 解压到无空格的英文路径下即可,如C:\。然后双击C:\InstantRails-2.0-win\InstantRails.exe文件即可启动InstantRails。
4)因为我总是喜欢使用MySQL,因此要手动把文件C:\InstantRails-2.0-win\mysql\bin\libmySQL.dll复制到目录C:\InstantRails-2.0-win\ruby\bin\。这个应该算InstantRails安装包的一个小缺陷吧。
2)开发用到的工具软件

1 创建Rails项目
从InstantRails进入Ruby命令行,输入清单1的命令:

图1:打开Ruby命令行
清单1:创建项目gis
- C:\InstantRails-2.0-win\rails_apps>rails -d mysql gis
- cd gis
- ruby script/server
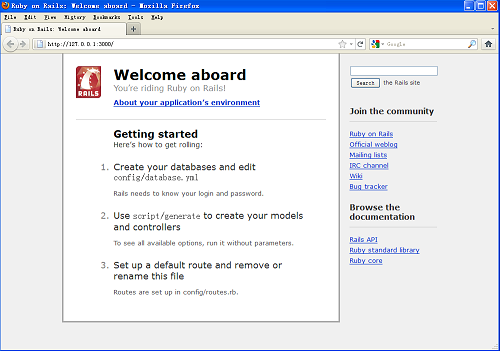
图2:RoR默认网站
2 创建数据库
从InstantRails进入Ruby命令行:
清单2:创建项目数据库
- cd gis
- gis>mysql -u root –p
- mysql> create database gis_dev;
- mysql> create database gis_test;
- mysql> create database gis;
- mysql> exit;
- gis>
3 导入数据表(locations)
从InstantRails->Configure->Database (via PhpMyAdmin),使用以下脚本创建gis_dev中的数据表。
清单3:创建gis_dev数据库表locations
- drop table if exists locations;
- create table locations (
- id int not null auto_increment,
- user_id int not null,
- recv_time timestamp default current_timestamp not null,
- x_long decimal(12,7) null,
- y_lat decimal(12,7) null,
- z_elev decimal(12,3) null,
- velocity decimal(10,0) null,
- accel decimal(10,0) null,
- direction decimal(10,4) null,
- pitch decimal(10,4) null,
- roll decimal(10,4) null,
- battery decimal(3,0) null,
- confidence decimal(3,0) null,
- message varchar(200) null,
- primary key (id)
- );
user_id:用户id
recv_time:收到信息的时间,这是个数据库自动填充时间的字段
x_long:经度deg
y_lat:纬度deg
z_elev:高度m
velocity:速度m/s
accel:加速度
direction:方向角度
pitch: 俯仰角度
roll:倾斜角度
battery:电池电量0-100
confidence:信号强度0-100,似乎用signal更好一些
message:短消息,提供呼叫信息功能
选择数据库gis_dev,在选择SQL标签页,将上面的SQL脚本粘帖到框中,最后按右下角的【执行】按钮。如图3所示:
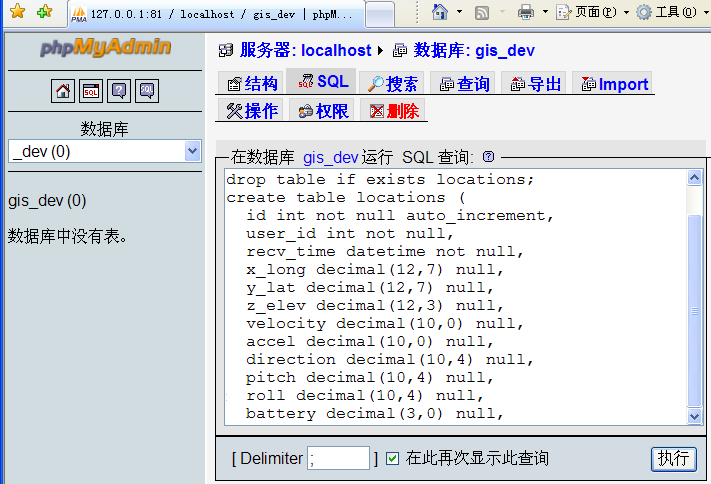
图3:使用PhpMyAdmin创建数据表
4 生成location模型
进入Ruby命令行,切换到gis目录,输入下面的命令,在一行中输入:清单4:创建locations Model
- ruby script/generate scaffold Location user_id:int recv_time:datetime x_long:decimal y_lat:decimal z_elev:decimal velocity:decimal accel:decimal direction:decimal pitch:decimal roll:decimal battery:decimal confidence:decimal message:string
C:\InstantRails-2.0-win\rails_apps\gis\app\controllers\locations_controller.rb
...\gis\app\models\location.rb
...\gis\app\views\locations\
然后重新执行命令。现在我们可以通过http://localhost:3000/locations/new创建新的location:
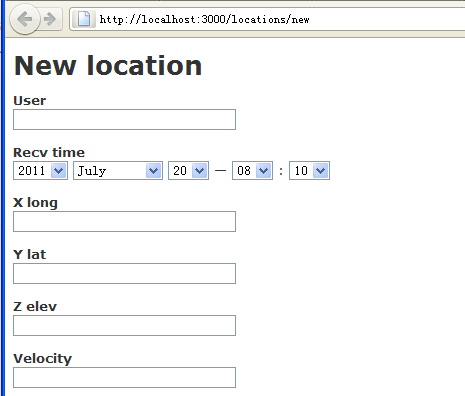
图4:创建location的界面
5 建立网站首页
清单5:创建home/index- $ ruby script/generate controller home index
- $ rm public/index.html
在 config/routes.rb 文件中,将 # map.root :controller => "welcome" 改为:
map.root :controller => "home"
默认首页文件变为:...\gis\app\views\home\index.html.erb。访问地址为: http://localhost:3000/
我们用预先建好的使用了ArcGIS Online Map的网页替换掉\home\index.html.erb,替换之后的index.html.erb见清单6。
清单6:网站首页文件index.html.erb
- <!DOCTYPE HTML PUBLIC "-//W3C//DTD HTML 4.01//EN" "http://www.w3.org/TR/html4/strict.dtd">
- <html>
- <head>
- <meta http-equiv="Content-Type" content="text/html; charset=utf-8" />
- <meta http-equiv="X-UA-Compatible" content="IE=7,IE=9" />
- <!--The viewport meta tag is used to improve the presentation and behavior of the samples on iOS devices-->
- <meta name="viewport" content="initial-scale=1, maximum-scale=1,user-scalable=no"/>
- <title>LBS Test Map</title>
- <link rel="stylesheet" type="text/css" href="http://serverapi.arcgisonline.com/jsapi/arcgis/2.4/js/dojo/dijit/themes/claro/claro.css">
- <style type="text/css">
- html,body {
- height:100%;
- width:100%;
- margin:0;
- }
- body {
- background-color:#FFF;
- overflow:hidden;
- font-family:"Trebuchet MS";
- }
- #mainWindow {
- width:100%;
- height:100%;
- margin:0px;
- padding:0;
- }
- #header {
- border:solid 0px #FFF;
- border-bottom:1px solid #AEAEAE;
- background-color:#EEF2FB;
- color:#CD853F;
- font-size:10pt;
- text-align:center;
- height:80px;
- margin:0px;
- padding:0;
- }
- #subheader {
- font-size:small;
- color:#CD853F;
- }
- #rightPane {
- background-color:#FFF;
- border:none;
- width:300px;
- overflow:hidden;
- margin:0px;
- padding:0;
- }
- #mapDiv {
- background-color:#FFF;
- border:solid 1px #AEAEAE;
- margin:0px;
- padding:0;
- }
- #measurementPaneDiv {
- background-color:#FFF;
- border:solid 1px #B8B8B8;
- height:130px;
- overflow:hidden;
- margin:0px;
- padding:0;
- }
- #measurementDiv {
- background-color:#FFF;
- font-size:10pt;
- height:100%;
- overflow:hidden;
- margin:0px;
- padding:0;
- }
- </style>
- <script type="text/javascript">
- var djConfig = {
- parseOnLoad: true
- };
- </script>
- <script type="text/javascript" src="http://serverapi.arcgisonline.com/jsapi/arcgis/?v=2.4">
- </script>
- <script type="text/javascript">
- dojo.require("dijit.dijit"); // optimize: load dijit layer
- dojo.require("dijit.layout.BorderContainer");
- dojo.require("dijit.layout.ContentPane");
- dojo.require("esri.map");
- dojo.require("esri.dijit.Measurement");
- dojo.require("esri.dijit.Scalebar");
- dojo.require("esri.toolbars.draw");
- dojo.require("esri.dijit.OverviewMap");
- var map, spatialRef, initExtent;
- // init on load
- function initGCS_WGS_1984()
- {
- // 4326 = GCS_WGS_1984
- spatialRef = new esri.SpatialReference({wkid:4326});
- // china extent
- initExtent = new esri.geometry.Extent(65, 9, 145, 55, spatialRef);
- map = new esri.Map("mapDiv");
- map.setExtent(initExtent);
- dojo.connect(map, 'onLoad', function(map) {
- var scalebar = new esri.dijit.Scalebar({map: map, scalebarUnit: "metric"});
- dojo.connect(dijit.byId('mapDiv'), 'resize', resizeMap);
- initToolbar(map);
- // add the overview map
- var overviewMapDijit = new esri.dijit.OverviewMap({map: map, visible:false});
- overviewMapDijit.startup();
- }
- );
- var basemapUrl = "http://server.arcgisonline.com/ArcGIS/rest/services/ESRI_StreetMap_World_2D/MapServer";
- var basemap = new esri.layers.ArcGISTiledMapServiceLayer(basemapUrl);
- map.addLayer(basemap);
- }
- // init on load
- function initWGS_1984_Web_Mercator_Auxiliary_Sphere() {
- // 102100 = WGS_1984_Web_Mercator_Auxiliary_Sphere
- spatialRef = new esri.SpatialReference({"wkid": 102100});
- // china extent
- initExtent = new esri.geometry.Extent({
- "xmin":-32971876.5210848,
- "ymin":2044843.3806844242,
- "xmax":-23921732.37212246,
- "ymax":7127600.013534156,
- "spatialReference":{"wkid":102100}
- });
- map = new esri.Map("mapDiv", {extent:initExtent, wrapAround180:true});
- dojo.connect(map, 'onLoad', function(map) {
- var scalebar = new esri.dijit.Scalebar({map: map, scalebarUnit: "metric"});
- dojo.connect(dijit.byId('mapDiv'), 'resize', resizeMap);
- initToolbar(map);
- // add the overview map
- var overviewMapDijit = new esri.dijit.OverviewMap({map: map, visible:false});
- overviewMapDijit.startup();
- }
- );
- var basemapUrl = "http://server.arcgisonline.com/ArcGIS/rest/services/World_Imagery/MapServer";
- var basemap = new esri.layers.ArcGISTiledMapServiceLayer(basemapUrl);
- map.addLayer(basemap);
- var referenceUrl = "http://server.arcgisonline.com/ArcGIS/rest/services/Reference/World_Boundaries_and_Places/MapServer";
- var referenceLayer = new esri.layers.ArcGISTiledMapServiceLayer(referenceUrl);
- map.addLayer(referenceLayer);
- }
- // resize map
- function resizeMap() {
- var resizeTimer;
- clearTimeout(resizeTimer);
- resizeTimer =
- setTimeout(
- function(){map.resize(); map.reposition();}, 500
- );
- }
- function initToolbar(map) {
- //define a new line symbol and point symbol to use for measure tools
- var pms = new esri.symbol.PictureMarkerSymbol("images/flag.png", 24, 24);
- pms.setOffset(9,11);
- var sls = new esri.symbol.SimpleLineSymbol(esri.symbol.SimpleLineSymbol.STYLE_DOT,
- new dojo.Color([255,0,0,.55]), 4);
- var measurement = new esri.dijit.Measurement({
- map: map,
- lineSymbol:sls,
- pointSymbol:pms
- },
- dojo.byId('measurementDiv')
- );
- measurement.startup();
- measurement.setTool("area", true);
- }
- // show map on load
- dojo.addOnLoad(initGCS_WGS_1984);
- // dojo.addOnLoad(initWGS_1984_Web_Mercator_Auxiliary_Sphere);
- </script>
- </head>
- <body class="claro">
- <div id="mainWindow" dojotype="dijit.layout.BorderContainer" design="headline" gutters="false">
- <div id="header" dojotype="dijit.layout.ContentPane" region="top">
- <h1>A Test for RoR with ArcGIS Online Map</h1>
- </div>
- <!-- header -->
- <div id="mapDiv" dojotype="dijit.layout.ContentPane" region="center">
- </div>
- <!-- mapDiv -->
- <div id="rightPane" dojotype="dijit.layout.BorderContainer" region="right" gutters="false">
- <div id="admin_div" dojotype="dijit.layout.ContentPane" style="height:100%;" region="center">
- </div>
- <!-- admin_div -->
- <div id="measurementPaneDiv" dojotype="dijit.layout.ContentPane" region="bottom">
- <div id="measurementDiv" style="height:100%;"></div>
- </div>
- <!-- measurementPaneDiv -->
- </div>
- <!-- rightPane -->
- </div>
- <!-- mainWindow -->
- </body>
- </html>
http://help.arcgis.com/en/webapi/javascript/arcgis/help/jsapi_start.htm
此时我们再浏览http://localhost:3000/,显示如图5所示:

图5:网站(gis)的首页
6 用RJS查询locations
我的设想是设置一个定时器,不断地查询locations表,把获得的记录显示右边的空白处(<div id="admin_div" ></div>),同时把坐标点显示在地图(map)上。当我们访问http://localhost:3000/locations,会显示locations数据表的全部信息,因此我们就想办法把这个表显示在admin_div处,这就需要引入Ajax,或者称为RJS(Ruby-generated JavaScript)的东西。请参考我转载的一篇文章(RubyOnRails with Ajax),那里面详细讨论了RJS技术的实现原理和方法。
6.1 添加定时器查询数据库
为此我们首先添加一个链接到清单6中(\home\index.html.erb),当用户点击这个链接,admin_div就显示查询的结果。添加链接之后的代码如下:
清单7:修改index.html.erb,红色粗体的部分是我新增的代码
- <div id="header" dojotype="dijit.layout.ContentPane" region="top">
- Click this link to show the current
- <%= link_to_remote "locations",
- :update => 'admin_div',
- :url => {:controller=>"locations", :action =>"list_by"} %>.
- </div>
- <!-- header -->
清单8:给locations_controller.rb添加list_by,红色粗体的部分是我新增的代码
- class LocationsController < ApplicationController
- # GET /locations
- # GET /locations.xml
- def index
- @locations = Location.find(:all)
- respond_to do |format|
- format.html # index.html.erb
- format.xml { render :xml => @locations }
- end
- end
- # add by me
- def list_by
- redirect_to :action => "index"
- end
另外为了支持RJS,我们还需要把<%= javascript_include_tag :defaults %>添加到index.html.erb中:
清单9:添加RJS声明
- ...
- </style>
- <%= javascript_include_tag :defaults %>
- <script type="text/javascript">
- ...
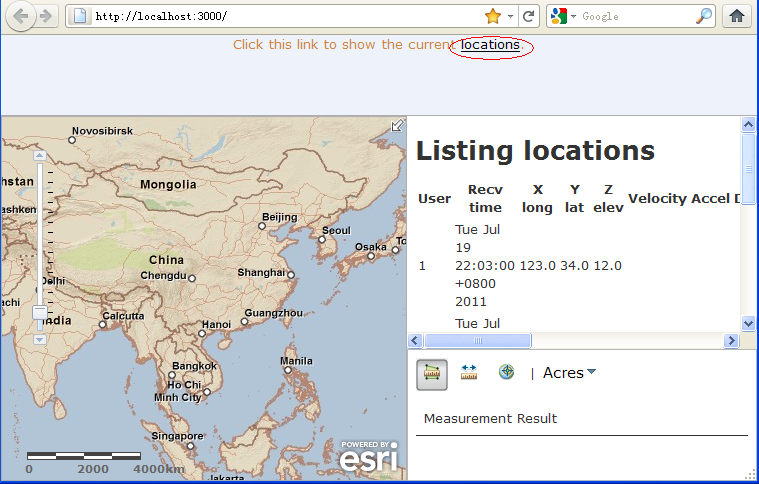
图6:增加了RJS后的首页
到目前为止,locations链接是您见到的惟一触发器。Ajax 还有许多其他的可用武器,一些由用户驱动,而另一些由程序事件驱动,如时钟。它是一个像闹钟一样并不需要用户干预的东西。可以用 Ajax 的 periodically_call_remote 方法定期更新时钟。更改 index.html.erb 代码如清单10(仅仅修改红色黑体部分):
清单10:修改index.html.erb,增加periodically_call_remote
- <div id="header" dojotype="dijit.layout.ContentPane" region="top">
- <h1>A Test for RoR with ArcGIS Online Map</h1>
- <%= periodically_call_remote :update => 'admin_div',
- :url => {:controller=>"locations", :action =>"list_by"},
- :frequency => 3.0 %>
- </div>
- <!-- header -->
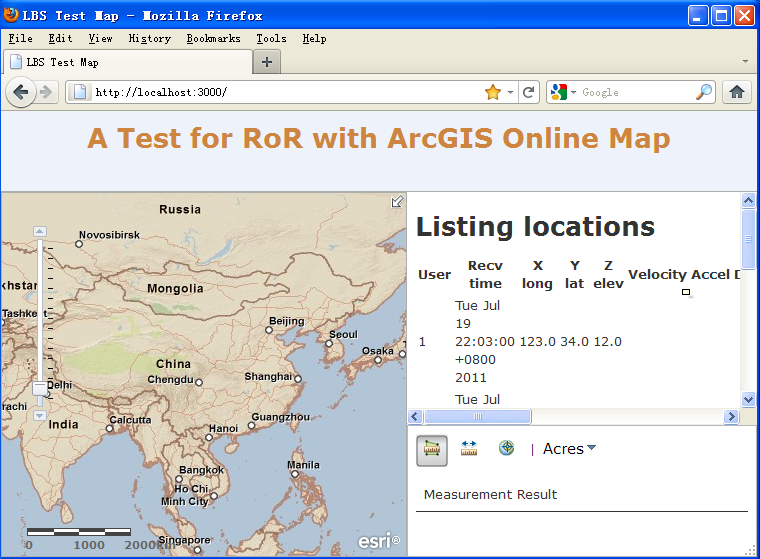
图7:自动更新Listing locations

图8:最终的gis主页
6.2 为定时器添加启动(Start Monitor)和暂停(StopMonitor)的方法
我们设想用户可以控制periodically_call_remote定时器的启动和停止。因此需要修改一下Ruby代码。修改后的代码如下:
清单11:控制periodically_call_remote定时器的启动和停止代码
- <head>
- ......
- <%= javascript_include_tag :defaults %>
- <script type="text/javascript">
- ......
- var myMonitor = true;
- var myUpdater = null;
- PeriodicalExecuter.prototype.resume = function(){
- if(!this.timer)
- this.registerCallback();
- };
- function startMonitor() {
- if (myUpdater != null)
- {
- myUpdater.resume();
- }
- }
- function stopMonitor() {
- if (myUpdater != null)
- {
- myUpdater.stop();
- }
- }
- </script>
- </head>
- <body class="claro">
- <%= periodically_call_remote(
- :variable => "myUpdater",
- :condition => "myMonitor == true",
- :update => "locations_div",
- :url => {:controller=>"locations", :action =>"list_by"},
- :frequency => 5,
- :complete => "new Effect.Highlight('locations_div');refreshLocations(dojo.byId('tb_users'));") %>
- <div id="mainWindow" dojotype="dijit.layout.BorderContainer" design="headline" gutters="false">
- ......
- <div id="locations_div" dojotype="dijit.layout.ContentPane" region="center">
- </div>
- <!-- locations_div -->
- ......
- </div>
- </body>
:variable => "myUpdater", 指明new PeriodicalExecuter返回变量名。
:condition => "myMonitor == true", 指明触发器回调函数运行的条件。
:update => "locations_div", 指明要更新的div id。就是上文的(admin_div),我改了名字。
:url => {:controller=>"locations", :action =>"list_by"}, 指明控制器和反应器名称。
:frequency => 5, 指定定时器间隔5秒
:complete => "...." 指明链接加载完毕onComplete执行的代码,我们的JavsScript代码可以放在这里。
我增加了下面的代码:
PeriodicalExecuter.prototype.resume = function(){
if(!this.timer)
this.registerCallback();
};
因为PeriodicalExecuter是...\gis\public\javascripts\prototype.js中的JS对象。PeriodicalExecuter只有stop方法,为此我们需要增加了启动定时器的重启方法resume()。
比较清单11中蓝色的代码和运行后查看浏览器源代码中的显示(我做了排版编辑):
清单12:查看浏览器源代码
- myUpdater =
- new PeriodicalExecuter(
- function(){
- if (myMonitor == true) {
- new Ajax.Updater(
- 'locations_div',
- '/locations/list_by',
- {
- asynchronous:true,
- evalScripts:true,
- onComplete:function(request) {
- new Effect.Highlight('locations_div');
- refreshLocations(dojo.byId('tb_users'));
- },
- parameters:'authenticity_token=' + encodeURIComponent('314268a80fbdca6f758e7bd120507c12a10c4698')
- }
- );
- }
- },
- 5
- );
C:\InstantRails-2.0-win\rails_apps\gis\app\helpers\application_helper.rb。
修改application_helper.rb文件以和下面的清单13一致:
清单13:重载periodically_call_remote,以支持返回变量
- # Methods added to this helper will be available to all templates in the application.
- module ApplicationHelper
- def periodically_call_remote(options = {})
- variable = options[:variable] ||= 'poller'
- frequency = options[:frequency] ||= 10
- code = "#{variable} = new PeriodicalExecuter(function(){#{remote_function(options)}}, #{frequency})"
- javascript_tag(code)
- end
- end
作用的效果。当我们按Draw Point按钮时,我们会发现浏览器上部出现了一个输入表:
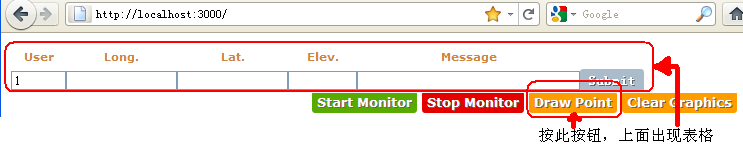
图9:locations/new的RJS实现
这又是另外一个Ajax的例子。读者可以自己在主页的源代码(index.html.erb)中揣摩(http://localhost:3000/locations/new)。
7 ArcGIS JavaScriptAPI编程
7.1 ArcGIS Online地图服务
本文用的地图是ESRI的在线地图服务的地图数据。使用这个服务不需要客户端装任何东西。ArcGIS Online Map Server使用REST(Representational State Transfer)的对象访问协议。REST,表述性状态转移,只要使用网址,就可以很容易地创建、发布和使用“REST风格”的网络服务。相比REST之前的简单对象访问协议(SOAP),REST是轻量级的,使用简便、灵活。REST是各层次开发者利用ArcGISServer创建自定义应用的最简便方法。其实质是用URI(统一的资源标识,它是以某种统一的标准化的方式标识资源的一串字符串)描述互联网上的资源,所以没有开发工具的限制。
使用ArcGIS JSAPI可以快速的创建交互式的地图RIA应用——RIA(Rich Internet Applications)富互联网应用,具有高度互动性、丰富用户体验以及功能强大的客户端。基于REST API,我们可以为用户提供查询,显示要素等服务。利用叠加GP服务,可以为用户提供专业的分析结果。
7.2 如何显示一个ArcGIS Online地图
更多的资源请参考:http://help.arcgis.com/en/webapi/javascript/arcgis/help/jsapi_start.htm
本文的例子在:C:\InstantRails-2.0-win\rails_apps\gis\app\views\home\index.html.erb。
1)创建一个文本文件,复制下面的代码到文件中,然后文件保存为:arcgis-demo.html。
清单14:arcgis-demo.html
- <!DOCTYPE HTML PUBLIC "-//W3C//DTD HTML 4.01//EN" "http://www.w3.org/TR/html4/strict.dtd">
- <html>
- <head>
- <meta http-equiv="Content-Type" content="text/html; charset=utf-8" />
- <title>ArcGIS Online Map Simplest Demo - cheungmine</title>
- <link rel="stylesheet" type="text/css" href="http://serverapi.arcgisonline.com/jsapi/arcgis/2.4/js/dojo/dijit/themes/claro/claro.css">
- <style type="text/css">
- html,body {
- height:100%;
- width:100%;
- margin:0;
- }
- body {
- background-color:#FFF;
- overflow:hidden;
- font-family:"Trebuchet MS";
- }
- #mainWindow {
- width:100%;
- height:100%;
- margin:0px;
- padding:0;
- }
- #mapDiv {
- background-color:#FFF;
- border:solid 1px #AEAEAE;
- margin:0px;
- padding:0;
- }
- </style>
- <%= javascript_include_tag :defaults %>
- <script type="text/javascript">
- var djConfig = {
- parseOnLoad: true
- };
- </script>
- <script type="text/javascript" src="http://serverapi.arcgisonline.com/jsapi/arcgis/?v=2.4">
- </script>
- <script type="text/javascript">
- dojo.require("dijit.dijit"); // optimize: load dijit layer
- dojo.require("dijit.layout.BorderContainer");
- dojo.require("dijit.layout.ContentPane");
- dojo.require("esri.map");
- dojo.require("esri.dijit.Scalebar");
- dojo.require("esri.toolbars.draw");
- dojo.require("esri.dijit.OverviewMap");
- var map, spatialRef, initExtent;
- // init on load
- function initGCS_WGS_1984() {
- // 4326 = GCS_WGS_1984
- spatialRef = new esri.SpatialReference({wkid:4326});
- // china extent: Longitude(65~145), Latitude(9~55)
- initExtent = new esri.geometry.Extent(65, 9, 145, 55, spatialRef);
- map = new esri.Map("mapDiv");
- map.setExtent(initExtent);
- dojo.connect(map, 'onLoad', function(map) {
- var scalebar = new esri.dijit.Scalebar({map: map, scalebarUnit: "metric"});
- dojo.connect(dijit.byId('mapDiv'), 'resize', resizeMap);
- initToolbar(map);
- // add the overview map
- var overviewMapDijit = new esri.dijit.OverviewMap({map: map, visible:false});
- overviewMapDijit.startup();
- }
- );
- var basemapUrl = "http://server.arcgisonline.com/ArcGIS/rest/services/ESRI_StreetMap_World_2D/MapServer";
- var basemap = new esri.layers.ArcGISTiledMapServiceLayer(basemapUrl);
- map.addLayer(basemap);
- }
- // init on load
- function initWGS_1984_Web_Mercator_Auxiliary_Sphere() {
- // 102100 = WGS_1984_Web_Mercator_Auxiliary_Sphere
- spatialRef = new esri.SpatialReference({"wkid": 102100});
- // china extent
- initExtent = new esri.geometry.Extent({
- "xmin":-32971876.5210848,
- "ymin":2044843.3806844242,
- "xmax":-23921732.37212246,
- "ymax":7127600.013534156,
- "spatialReference":{"wkid":102100}
- });
- map = new esri.Map("mapDiv", {extent:initExtent, wrapAround180:true});
- dojo.connect(map, 'onLoad', function(map) {
- var scalebar = new esri.dijit.Scalebar({map: map, scalebarUnit: "metric"});
- dojo.connect(dijit.byId('mapDiv'), 'resize', resizeMap);
- initToolbar(map);
- // add the overview map
- var overviewMapDijit = new esri.dijit.OverviewMap({map: map, visible:false});
- overviewMapDijit.startup();
- }
- );
- var basemapUrl = "http://server.arcgisonline.com/ArcGIS/rest/services/World_Imagery/MapServer";
- var basemap = new esri.layers.ArcGISTiledMapServiceLayer(basemapUrl);
- map.addLayer(basemap);
- var referenceUrl = "http://server.arcgisonline.com/ArcGIS/rest/services/Reference/World_Boundaries_and_Places/MapServer";
- var referenceLayer = new esri.layers.ArcGISTiledMapServiceLayer(referenceUrl);
- map.addLayer(referenceLayer);
- }
- // resize map
- function resizeMap() {
- var resizeTimer;
- clearTimeout(resizeTimer);
- resizeTimer =
- setTimeout(
- function(){map.resize(); map.reposition();}, 500
- );
- }
- // show map on load
- // dojo.addOnLoad(initGCS_WGS_1984);
- dojo.addOnLoad(initWGS_1984_Web_Mercator_Auxiliary_Sphere);
- </script>
- </head>
- <body class="claro">
- <div id="mainWindow" dojotype="dijit.layout.BorderContainer" design="headline" gutters="false">
- <div id="mapDiv" dojotype="dijit.layout.ContentPane" region="center">
- </div>
- <!-- mapDiv -->
- <!-- mainWindow -->
- </body>
- </html>

图10:arcgis-demo.html展示的ArcGIS Online Map
7.3 ArcGIS JSAPI 使用了Dojo这个著名的Ajax开源JavaScript库
为什么是dojo?1)Dojo宽松的使用许可
2)Dojo功能全面,事件设计模式、矢量图形支持、显示效果、widgets、Ajax、JSON等都是ArcServer客户端开发所需要的,并且Dojo利于扩展,方便Mashup应用
3)客户端有丰富的图表
参考:
http://dojotoolkit.org
8 安装和使用示例代码
本文的示例代码 下载地址:http://download.csdn.net/source/3459994
8.1 安装并配置RoR环境
1) 下载InstantRails-2.0-win.zip:
http://rubyforge.org/frs/download.php/29867/InstantRails-2.0-win.zip
2) 解压到 C:\ 下. 主目录名默认为:C:\InstantRails-2.0-win\InstantRails.exe
3) 此步可以忽略,下面的cpy-mysql-db.bat批处理中执行了这个过程:复制libmySQL.dll. 开始->运行 cmd:
copy C:\InstantRails-2.0-win\mysql\bin\libmySQL.dll C:\InstantRails-2.0-win\ruby\bin\4) 运行 C:\InstantRails-2.0-win\InstantRails.exe, 如果提示Apache端口被占用, 如下图:

图11:Apache端口错误消息
编辑修改下面的文件:
C:\InstantRails-2.0-win\apache\conf\httpd.conf将80改为81
Listen 80=>81
...
Port 80=>81
8.2 部署gis网站
1) 把gis.rar解压到 C:\InstantRails-2.0-win\rails_apps\ 目录下, 运行下面的批处理文件:
C:\InstantRails-2.0-win\rails_apps\gis\cpy-mysql-db.bat
这样我们的gis站点和MySQL数据库就部署好了.
2) 启动gis网站. 运行 C:\InstantRails-2.0-win\InstantRails.exe
图12:InstantRails主界面

图13:Rails程序管理器
3) 打开浏览器, 输入网址 http://localhost:3000/ 或http://127.0.0.1:3000/,即可看到网站主页.
8.3 使用gis网站
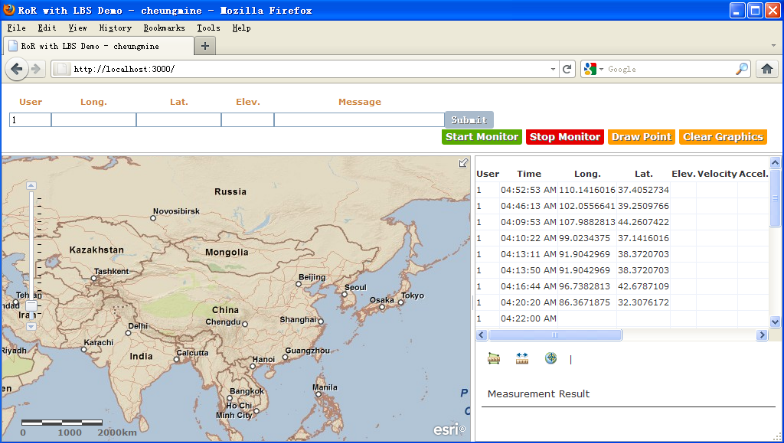
打开2个浏览器A和B, 都定位到网站主页: http://127.0.0.1:3000/1) 浏览器A(IE7)模拟GPS点生成过程
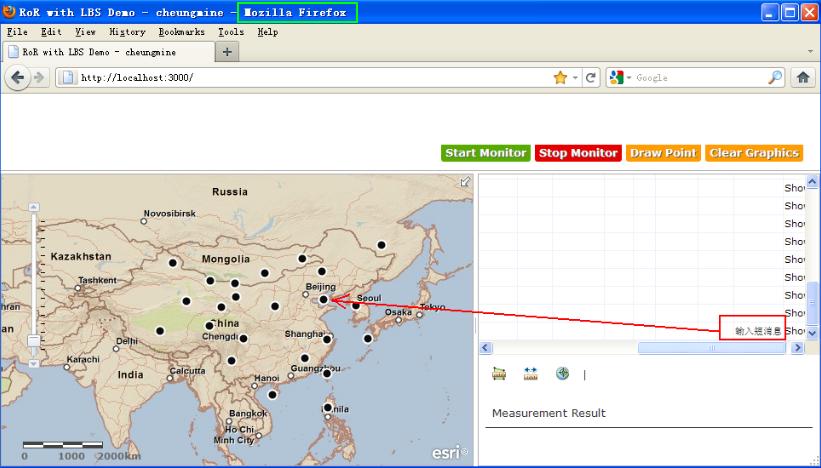
按浏览器A的页面上部的 Draw Point 按钮, 然后在地图上的某个位置处点击, 再按页面上部的 Sumbit 按钮, 即把当前的记录提交到了后台数据库, 过几秒, 就可以看到这个黑点出现在地图上的点击处, 同时右边的表格中多了一条记录.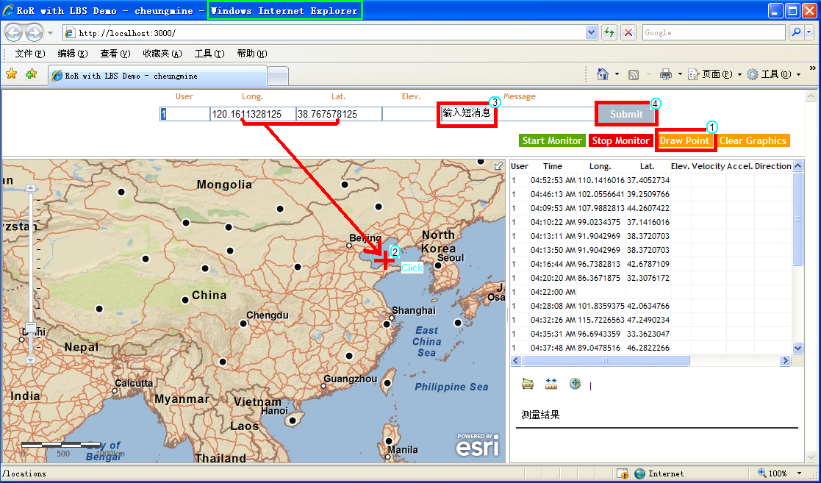
对于浏览器A中的操作, 5秒之后都会出现在浏览器B的主页上. 反之亦然.
9 关于Ruby、RoR的一些展望
本文写作时采用的是Ruby1.8.6和Rails2.0.2。显然这个版本已经过时了。但是因为InstantRails的存在,这个版本对于初学者特别合适。
Ruby是一门特别简单而功能强大的解释型语言。它一经推出,即风靡了整个业界。它是一个解释型语言。在脚本语言家族中,早期的Ruby版本,据说速度较慢。对于高性能、高度保密的需求上,可以用C语言的库来扩展它。2009年1月30日,ruby 1.9.1的正式版本如期发布! 1.9.1是ruby 1.9系列以来的第一个production ready的版本,这也标志着Ruby社区从此迈向了1.9的时代。ruby 1.9是ruby发展历史上的一个里程碑版本:
1)ruby 1.9首次引入字节码即时编译技术,可以大大提高ruby本身的性能。根据之前的综合评测来看,1.9的性能大约是1.8.6的三倍左右,性能追上了Python。
2)ruby 1.9正式支持内核多线程机制,可以大大提高ruby作为服务端程序的并发处理能力。
3)ruby 1.9还引入了纤程这样的多任务并发处理机制,提供了轻量级并发处理能力。
因此,Ruby的一门很有潜力的新语言。Ruby on Rails(RoR)是近几年开始流行的新一代Web开发框架语言,其易用、敏捷的特性受到很多Web开发人员的瞩目。Rails是基于Ruby之上的开发动态Web的首选框架。在Web2.0时代,RoR是快速开发RIA应用的首选语言。RoR尤其适合于快速架构跨平台的各种类型的Web网站、开发云计算平台的RIA入口等等。
Ruby可以用于书写RoR的服务页面程序;也可以用Ruby脚本管理网络、服务器;Ruby也用于对象胶,组合各种系统服务、功能模块等等。
RoR结合Nginx(Nginx已经成为世界第三大Web服务器)在Linux平台上,可以以极小的代价开发和部署支持海量并发请求的、高性能的、可扩展的网站和云计算服务。利用C语言扩展Ruby后台模块,利用多核、异步、线程池等技术,可以满足高可靠性、可扩展性、服务逻辑隐藏等需求,同时使实现异步的、长时间、高负载的Web后台运算或云计算服务成为可能。
附录1: gis 主页源代码
清单15: ...\gis\app\views\home\index.html.erb- <!DOCTYPE HTML PUBLIC "-//W3C//DTD HTML 4.01//EN" "http://www.w3.org/TR/html4/strict.dtd">
- <html>
- <head>
- <meta http-equiv="Content-Type" content="text/html; charset=utf-8" />
- <meta http-equiv="X-UA-Compatible" content="IE=7,IE=9" />
- <!--The viewport meta tag is used to improve the presentation and behavior of the samples on iOS devices-->
- <meta name="viewport" content="initial-scale=1, maximum-scale=1,user-scalable=no"/>
- <title>RoR with LBS Demo - cheungmine</title>
- <link rel="stylesheet" type="text/css" href="http://serverapi.arcgisonline.com/jsapi/arcgis/2.4/js/dojo/dijit/themes/claro/claro.css">
- <style type="text/css">
- html,body {
- height:100%;
- width:100%;
- margin:0;
- }
- body {
- background-color:#FFF;
- overflow:hidden;
- font-family:"Trebuchet MS";
- }
- #mainWindow {
- width:100%;
- height:100%;
- margin:0px;
- padding:0;
- }
- #header {
- border:solid 0px #FFF;
- border-bottom:1px solid #AEAEAE;
- background-color:#FFF;
- color:#CD853F;
- font-size:10pt;
- text-align:center;
- height:90px !important;
- height:80px;
- margin-bottom:3px;
- padding:0;
- }
- #new_location_div {
- border:solid 0px #FFF;
- background-color:#FFF;
- color:#CD853F;
- font-size:10pt;
- text-align:center;
- overflow:hidden;
- height:60px;
- margin-left:10px;
- padding:0;
- }
- #menusDiv {
- border:solid 0px #FFF;
- background-color:#FFF;
- color:#CD853F;
- font-size:10pt;
- text-align:right;
- height:30px;
- overflow:hidden;
- margin-right:20px;
- padding:0;
- }
- #rightPane {
- background-color:#FFF;
- border:solid 1px #AEAEAE;
- width:400px;
- overflow:hidden;
- margin:0px;
- padding:0;
- }
- #mapDiv {
- background-color:#FFF;
- border:solid 1px #AEAEAE;
- margin:0px;
- padding:0;
- }
- #measurementPaneDiv {
- background-color:#FFF;
- border:solid 0px #B8B8B8;
- height:130px;
- overflow:hidden;
- margin:0px;
- padding:0;
- display:yes;
- }
- #measurementDiv {
- background-color:#FFF;
- border:solid 0px #B8B8B8;
- font-size:10pt;
- height:100%;
- overflow:hidden;
- margin:0px;
- padding:0;
- }
- #locations_div {
- background-color:#FFF;
- height:100%;
- border: 0;
- margin: 0;
- padding:0;
- }
- #tb_users {
- border-collapse:collapse;
- }
- #tb_users th {
- font-size:8pt;
- white-space:nowrap;
- }
- #tb_users td {
- border:1px solid #EEF2FB;
- font-size:8pt;
- white-space:nowrap;
- }
- #new_users {
- border-collapse:collapse;
- height:48px;
- }
- #new_users th {
- font-color:#000;
- font-size:8pt;
- white-space:nowrap;
- height:16px;
- margin: 0;
- padding:0;
- }
- #new_users td {
- border:0px solid #EEF2FB;
- font-size:8pt;
- white-space:nowrap;
- height:22px;
- margin: 0;
- padding:0;
- }
- a { text-decoration: none; }
- h2, h3 { margin: 0 0 20px; text-shadow: 2px 2px #fff; }
- h2 { font-size: 28px; }
- h3 { font-size: 22px; }
- pre { background: #fff; width: 460px; padding: 10px 20px; border-left: 5px solid #ccc; margin: 0 0 20px; }
- input { margin: 0; padding: 0; }
- .button {
- padding: 3px 5px;
- display: inline;
- background: #ABC url(button.png) repeat-x bottom;
- border: none;
- color: #fff;
- cursor: pointer;
- font-weight: bold;
- border-radius: 3px;
- -moz-border-radius: 3px;
- -webkit-border-radius: 3px;
- text-shadow: 1px 1px #666;
- }
- .button:hover {
- background-position: 0 center;
- }
- .button:active {
- background-position: 0 top;
- position: relative;
- top: 1px;
- padding: 3px 5px 2px;
- }
- .button.red { background-color: #e50000; }
- .button.purple { background-color: #9400bf; }
- .button.green { background-color: #58aa00; }
- .button.orange { background-color: #ff9c00; }
- .button.blue { background-color: #2c6da0; }
- .button.black { background-color: #333; }
- .button.white { background-color: #fff; color: #000; text-shadow: 1px 1px #fff; }
- .button.small { font-size: 75%; padding: 3px 7px; }
- .button.small:active { padding: 4px 7px 2px; background-position: 0 top; }
- .button.large { font-size: 125%; padding: 7px 12px; }
- .button.large:active { padding: 8px 12px 6px; background-position: 0 top; }
- </style>
- <%= javascript_include_tag :defaults %>
- <script type="text/javascript">
- var djConfig = {
- parseOnLoad: true
- };
- </script>
- <script type="text/javascript" src="http://serverapi.arcgisonline.com/jsapi/arcgis/?v=2.4">
- </script>
- <script type="text/javascript">
- dojo.require("dijit.dijit"); // optimize: load dijit layer
- dojo.require("dijit.layout.BorderContainer");
- dojo.require("dijit.layout.ContentPane");
- dojo.require("esri.map");
- dojo.require("esri.dijit.Measurement");
- dojo.require("esri.dijit.Scalebar");
- dojo.require("esri.toolbars.draw");
- dojo.require("esri.dijit.OverviewMap");
- var map, toolbar, spatialRef, initExtent, defaultPointSymbol, defaultLineSymbol, defaultFillSymbol;
- // init on load
- function initGCS_WGS_1984() {
- // 4326 = GCS_WGS_1984
- spatialRef = new esri.SpatialReference({wkid:4326});
- // china extent
- initExtent = new esri.geometry.Extent(65, 9, 145, 55, spatialRef);
- map = new esri.Map("mapDiv");
- map.setExtent(initExtent);
- dojo.connect(map, 'onLoad', function(map) {
- var scalebar = new esri.dijit.Scalebar({map: map, scalebarUnit: "metric"});
- dojo.connect(dijit.byId('mapDiv'), 'resize', resizeMap);
- initToolbar(map);
- // add the overview map
- var overviewMapDijit = new esri.dijit.OverviewMap({map: map, visible:false});
- overviewMapDijit.startup();
- }
- );
- var basemapUrl = "http://server.arcgisonline.com/ArcGIS/rest/services/ESRI_StreetMap_World_2D/MapServer";
- var basemap = new esri.layers.ArcGISTiledMapServiceLayer(basemapUrl);
- map.addLayer(basemap);
- }
- // init on load
- function initWGS_1984_Web_Mercator_Auxiliary_Sphere() {
- // 102100 = WGS_1984_Web_Mercator_Auxiliary_Sphere
- spatialRef = new esri.SpatialReference({"wkid": 102100});
- // china extent
- initExtent = new esri.geometry.Extent({
- "xmin":-32971876.5210848,
- "ymin":2044843.3806844242,
- "xmax":-23921732.37212246,
- "ymax":7127600.013534156,
- "spatialReference":{"wkid":102100}
- });
- map = new esri.Map("mapDiv", {extent:initExtent, wrapAround180:true});
- dojo.connect(map, 'onLoad', function(map) {
- var scalebar = new esri.dijit.Scalebar({map: map, scalebarUnit: "metric"});
- dojo.connect(dijit.byId('mapDiv'), 'resize', resizeMap);
- initToolbar(map);
- // add the overview map
- var overviewMapDijit = new esri.dijit.OverviewMap({map: map, visible:false});
- overviewMapDijit.startup();
- }
- );
- var basemapUrl = "http://server.arcgisonline.com/ArcGIS/rest/services/World_Imagery/MapServer";
- var basemap = new esri.layers.ArcGISTiledMapServiceLayer(basemapUrl);
- map.addLayer(basemap);
- var referenceUrl = "http://server.arcgisonline.com/ArcGIS/rest/services/Reference/World_Boundaries_and_Places/MapServer";
- var referenceLayer = new esri.layers.ArcGISTiledMapServiceLayer(referenceUrl);
- map.addLayer(referenceLayer);
- }
- // resize map
- function resizeMap() {
- var resizeTimer;
- clearTimeout(resizeTimer);
- resizeTimer =
- setTimeout(
- function(){map.resize(); map.reposition();}, 500
- );
- }
- function initToolbar(map) {
- // create symbol for drawing
- defaultPointSymbol = new esri.symbol.SimpleMarkerSymbol(
- esri.symbol.SimpleMarkerSymbol.STYLE_CIRCLE, 11,
- new esri.symbol.SimpleLineSymbol(esri.symbol.SimpleLineSymbol.STYLE_SOLID,
- new dojo.Color([255,255,255]), 2),
- new dojo.Color([10,10,10, 1]));
- // create toolbar
- toolbar = new esri.toolbars.Draw(map);
- dojo.connect(toolbar, "onDrawEnd", addLocation);
- //define a new line symbol and point symbol to use for measure tools
- var pms = new esri.symbol.PictureMarkerSymbol("images/flag.png", 24, 24);
- pms.setOffset(9,11);
- var sls = new esri.symbol.SimpleLineSymbol(esri.symbol.SimpleLineSymbol.STYLE_DOT,
- new dojo.Color([255,0,0,.55]), 4);
- var measurement = new esri.dijit.Measurement({
- map: map,
- lineSymbol:sls,
- pointSymbol:pms
- },
- dojo.byId('measurementDiv')
- );
- measurement.startup();
- // measurement.setTool("distance", true);
- }
- // show map on load
- dojo.addOnLoad(initGCS_WGS_1984);
- // dojo.addOnLoad(initWGS_1984_Web_Mercator_Auxiliary_Sphere);
- // add location to database when onDrawEnd fired
- function addLocation(geometry) {
- dojo.byId("inLong").value = geometry.x;
- dojo.byId("inLat").value = geometry.y;
- var type = geometry.type;
- if (type === "point" || type === "multipoint") {
- symbol = toolbar.markerSymbol;
- }
- else if (type === "line" || type === "polyline") {
- symbol = toolbar.lineSymbol;
- }
- else {
- symbol = toolbar.fillSymbol;
- }
- map.graphics.add(new esri.Graphic(geometry, symbol));
- }
- function isValidValue(val) {
- if (val==null || val=="")
- return false;
- return true;
- }
- // user location class
- function userLocation(user_id, recv_time, x_long, y_lat, z_elev, message) {
- this.valid = false;
- this.id = user_id;
- this.recv = recv_time;
- this.x = x_long;
- this.y = y_lat;
- this.z = z_elev;
- this.msg = message;
- if (isValidValue(this.id) &&
- isValidValue(this.recv) &&
- isValidValue(this.x) &&
- isValidValue(this.y))
- {
- this.valid = true;
- }
- }
- // add user location to map
- function addMapGraphics(user) {
- if (!user.valid)
- return;
- var pt = new esri.geometry.Point(user.x, user.y, spatialRef);
- var graphic = new esri.Graphic(pt, defaultPointSymbol);
- map.graphics.add(graphic);
- }
- // refresh locations
- function refreshLocations(tb) {
- // clear old first
- clearMapGraphics();
- // we get table object and get its all tds
- var rows=tb.rows;
- for(i=1; i<rows.length; i++){
- cols = rows[i].cells;
- var user = new userLocation(cols[0].innerHTML,
- cols[1].innerHTML, cols[2].innerHTML, cols[3].innerHTML, cols[4].innerHTML, cols[12].innerHTML);
- addMapGraphics(user);
- }
- }
- function clearMapGraphics() {
- map.graphics.clear();
- }
- var myMonitor = true;
- var myUpdater = null;
- PeriodicalExecuter.prototype.resume = function(){
- if(!this.timer)
- this.registerCallback();
- };
- function startMonitor() {
- if (myUpdater != null)
- {
- myUpdater.resume();
- }
- }
- function stopMonitor() {
- if (myUpdater != null)
- {
- myUpdater.stop();
- }
- }
- </script>
- </head>
- <body class="claro">
- <%= periodically_call_remote(
- :variable => "myUpdater",
- :condition => "myMonitor == true",
- :update => "locations_div",
- :url => {:controller=>"locations", :action =>"list_by"},
- :frequency => 5,
- :complete => "new Effect.Highlight('locations_div');refreshLocations(dojo.byId('tb_users'));") %>
- <div id="mainWindow" dojotype="dijit.layout.BorderContainer" design="headline" gutters="false">
- <div id="header" dojotype="dijit.layout.ContentPane" region="top">
- <div id="new_location_div" dojotype="dijit.layout.ContentPane" region="center">
- </div>
- <div id="menusDiv" dojotype="dijit.layout.ContentPane" region="bottom">
- <a href="#" class="button green" onclick="startMonitor();">Start Monitor</a>
- <a href="#" class="button red" onclick="stopMonitor();">Stop Monitor</a>
- <%= link_to_remote("Draw Point",
- {
- :update => "new_location_div",
- :url => {:controller=>"locations", :action =>"new"},
- :complete => "toolbar.activate(esri.toolbars.Draw.POINT);"
- },
- { :class => "button orange"} ) %>
- <a href="#" class="button orange" onclick="clearMapGraphics();">Clear Graphics</a>
- </div>
- </div>
- <!-- header -->
- <div id="mapDiv" dojotype="dijit.layout.ContentPane" region="center">
- </div>
- <!-- mapDiv -->
- <div id="rightPane" dojotype="dijit.layout.BorderContainer" region="right" gutters="false" splitter="true">
- <div id="locations_div" dojotype="dijit.layout.ContentPane" region="center">
- </div>
- <!-- locations_div -->
- <div id="measurementPaneDiv" dojotype="dijit.layout.ContentPane" region="bottom">
- <div id="measurementDiv" style="height:100%;"></div>
- </div>
- <!-- measurementPaneDiv -->
- </div>
- <!-- rightPane -->
- </div>
- <!-- mainWindow -->
- </body>
- </html>
附录2: 参考文献
1) AgileWebDevelopmentWithRails-3rdEd.pdf2) building_dynamic_web_2.0_websites_with_ruby_on_rails.pdf
3) OReilly.Ajax.on.Rails.Dec.2006.chm
4) Enterprise Integration with Ruby - A Pragmatic Guide.pdf
5) OReilly.Dojo.The.Definitive.Guide.Jun.2008.pdf
6) ArcGIS JavaScript API开发—初级篇_白明.pdf


 被折叠的 条评论
为什么被折叠?
被折叠的 条评论
为什么被折叠?
 到【灌水乐园】发言


