


 该博客分享了一个用于实时观察应用启动后内存消耗的Python脚本,通过adb shell cpu_usage命令获取CPU和GPU使用率数据,适用于多线程监控场景。
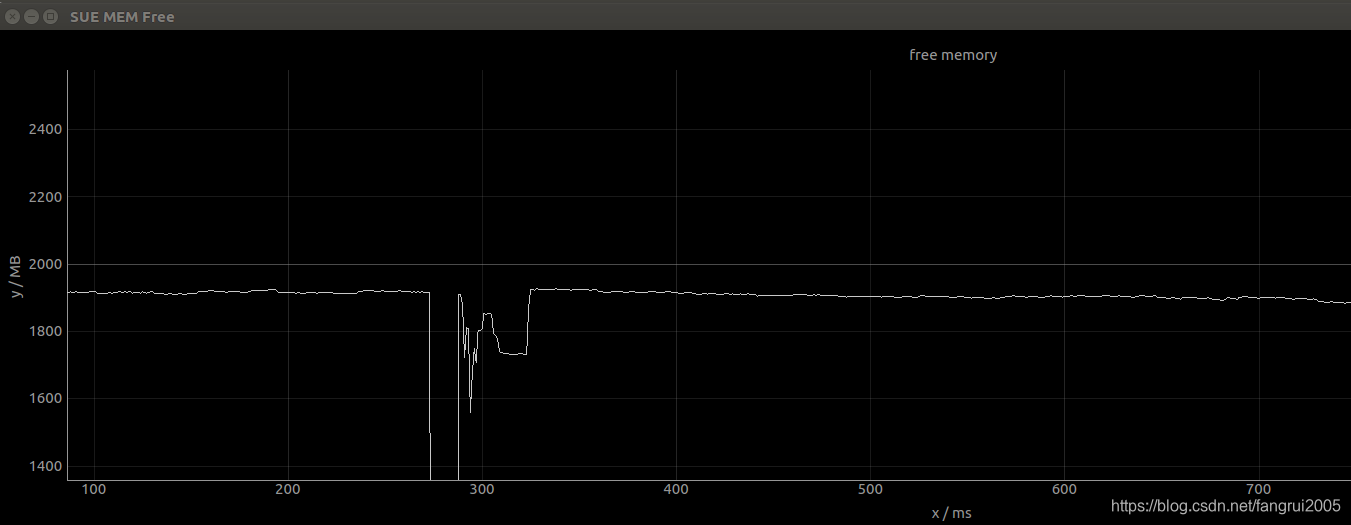
在工作中需要观测某个应用启动后对内存消耗的影响, 所以写了这个脚本,仅供参考:
# -- coding: utf-8 --
from __future__ import unicode_literals
# -- coding: utf-8 --
import array
import serial
import threading
import numpy as np
import time
import pyqtgraph as pg
import os


fp = 0
i = 0

def get_memfree():
    os.system("adb shell cat /proc/meminfo > ./meminfo")
    sum = 0
    with open("./meminfo") as mi:
        for line in mi:
            temp = filter(str.isdigit, line)
            if "MemFree:" in line:
                sum = sum + int(temp)
            if "Buffers:" in line:
                sum = sum + int(temp)
            if "Cached:" in line:
                sum = sum + int(temp)
            if "IonTotal:" in line:
            	ion = int(temp)
            if "IonInUse:" in line:
            	ion_use = int(temp)
                sum = sum + ion - ion_use
    os.system("rm ./meminfo")
    print str(sum/1024)+" MB"
    return sum

def plotData():
    global i;
    if i < historyLength:
        memfree = get_memfree()/1024
        data[i] = memfree
        i = i + 1
    else:
        memfree = get_memfree()/1024
        data[:-1] = data[1:]
        data[i - 1] = memfree
    curve.setData(data)

if __name__ == "__main__":
    app = pg.mkQApp()  # 建立app
    win = pg.GraphicsWindow()  # 建立窗口
    win.setWindowTitle(u'SUE MEM Free')
    win.resize(4000, 500)  # 小窗口大小
    data = array.array('i')  # 可动态改变数组的大小,uint16_t 型数组
    historyLength = 3000  # 横坐标长度
    a = 0
    data=np.zeros(historyLength).__array__('d')#把数组长度定下来
    p = win.addPlot()  # 把图p加入到窗口中
    p.showGrid(x=True, y=True)  # 把X和Y的表格打开
    p.setRange(xRange=[0, historyLength], yRange=[0, 4000], padding=0)
    p.setLabel(axis='left', text='y / MB')  # 靠左
    p.setLabel(axis='bottom', text='x / ms')
    p.setTitle('free memory')  # 表格的名字
    curve = p.plot()  # 绘制一个图形
    curve.setData(data)

    timer = pg.QtCore.QTimer()
    timer.timeout.connect(plotData)  # 定时刷新数据显示
    timer.start(100)  # 多少ms调用一次
    app.exec_()
如果要中同一个画面中画多条线:
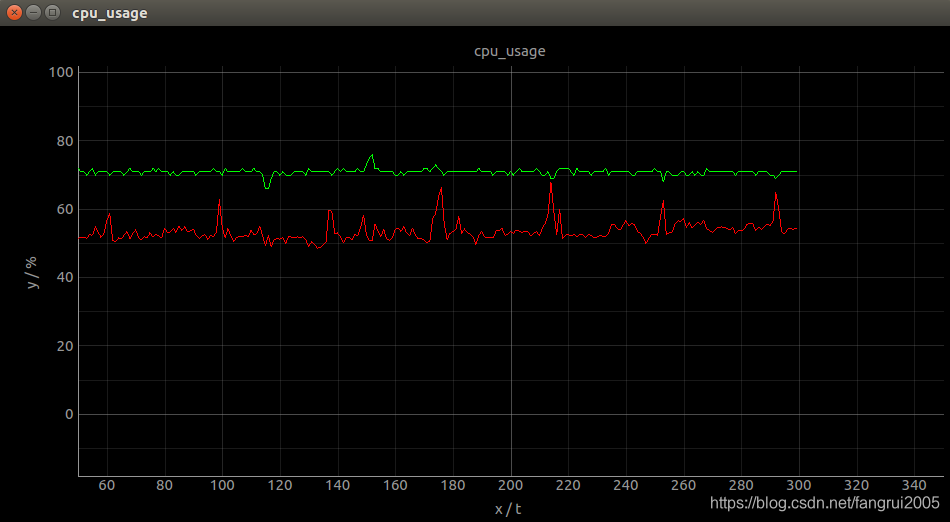
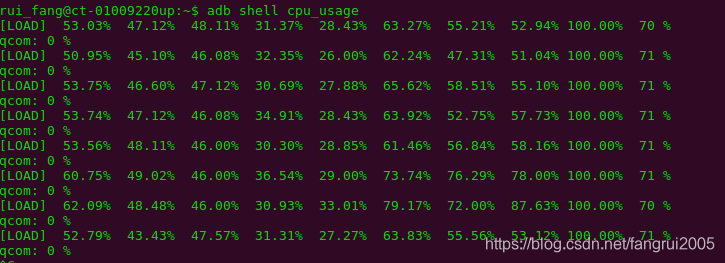
使用命令: adb shell cpu_usage 可以实时打印出每个cpu和gpu的使用率:
# -- coding: utf-8 --
from __future__ import unicode_literals
# -- coding: utf-8 --
import pyqtgraph as pg
import array
import threading
import numpy as np
# from queue import Queue
import time
import os

thread_runing = True

i = 0
# q = Queue(maxsize=0)
# def Serial():
#     global i;
#     global q;
#     while(True):
#         n = mSerial.inWaiting()
#         if(n):
#             dat = int.from_bytes(mSerial.readline(1),byteorder='little')  # 格式转换
#             if(dat>>7):
#                 dat =256-dat
#                 dat =0-dat
#             q.put(dat)

# def plotData():
#     global i;
#     if i < historyLength:
#         data[i] = q.get()
#         i = i+1
#     else:
#         data[:-1] = data[1:]
#         data[i-1] = q.get()
#     curve.setData(data)

def cpu_usage():
    global i;

    cpu_output=os.popen('adb shell "cpu_usage"')
    while(thread_runing):
        line = cpu_output.readline()
        if "LOAD" in line:
            # print line
            list_cpu=line.replace("[LOAD]","").split("%")
            avg_cpu = list_cpu[0]
            gpu = list_cpu[-2]

            if i < historyLength:
                data[i] = avg_cpu
                data2[i] = gpu
                i = i+1
            else:
                data[:-1] = data[1:]
                data[i-1] = avg_cpu
                data2[:-1] = data2[1:]
                data2[i-1] = gpu

def plotData():
    curve.setData(data)
    curve2.setData(data2)

if __name__ == "__main__":
    app = pg.mkQApp()  # 建立app
    win = pg.GraphicsWindow()  # 建立窗口
    win.setWindowTitle(u'cpu_usage')
    win.resize(800, 500)  # 小窗口大小
    label = pg.LabelItem(justify='right')  # 设置label用于跟随鼠标显示横纵坐标有效值
    win.addItem(label)  # 定义了label之后,要addItem之后才会真正加进去
    data = array.array('i')  # 可动态改变数组的大小,double型数组
    historyLength = 300  # 横坐标长度
    a = 0
    data=np.zeros(historyLength).__array__('d')#把数组长度定下来
    p = win.addPlot()  # 把图p加入到窗口中
    p.showGrid(x=True, y=True)  # 把X和Y的表格打开
    p.setRange(xRange=[0, historyLength], yRange=[-10, 110], padding=0)
    p.setLabel(axis='left', text='y / %')  # 靠左
    p.setLabel(axis='bottom', text='x / t')
    p.setTitle('cpu_usage')  # 表格的名字
    curve = p.plot(pen='r')  # 绘制一个图形
    curve.setData(data)

    data2 = array.array('i')  # 可动态改变数组的大小,double型数组
    data2=np.zeros(historyLength).__array__('d')#把数组长度定下来
    curve2 = p.plot(pen='g')  # 绘制一个图形
    curve2.setData(data2)

    th1 = threading.Thread(target=cpu_usage)
    th1.setDaemon(True)
    th1.start()
    timer = pg.QtCore.QTimer()
    timer.timeout.connect(plotData)  # 定时刷新数据显示
    timer.start(500)  # 多少ms调用一次
    app.exec_()

    try :
        while thread_runing:
            pass
    except KeyboardInterrupt,e:
        print " exit"
    th1.stop()
    timer.stop()


 848
848

 被折叠的 条评论
为什么被折叠?
被折叠的 条评论
为什么被折叠?
 到【灌水乐园】发言


