根据地址生成客户地图及热力图(百度地图API)

先看效果图:

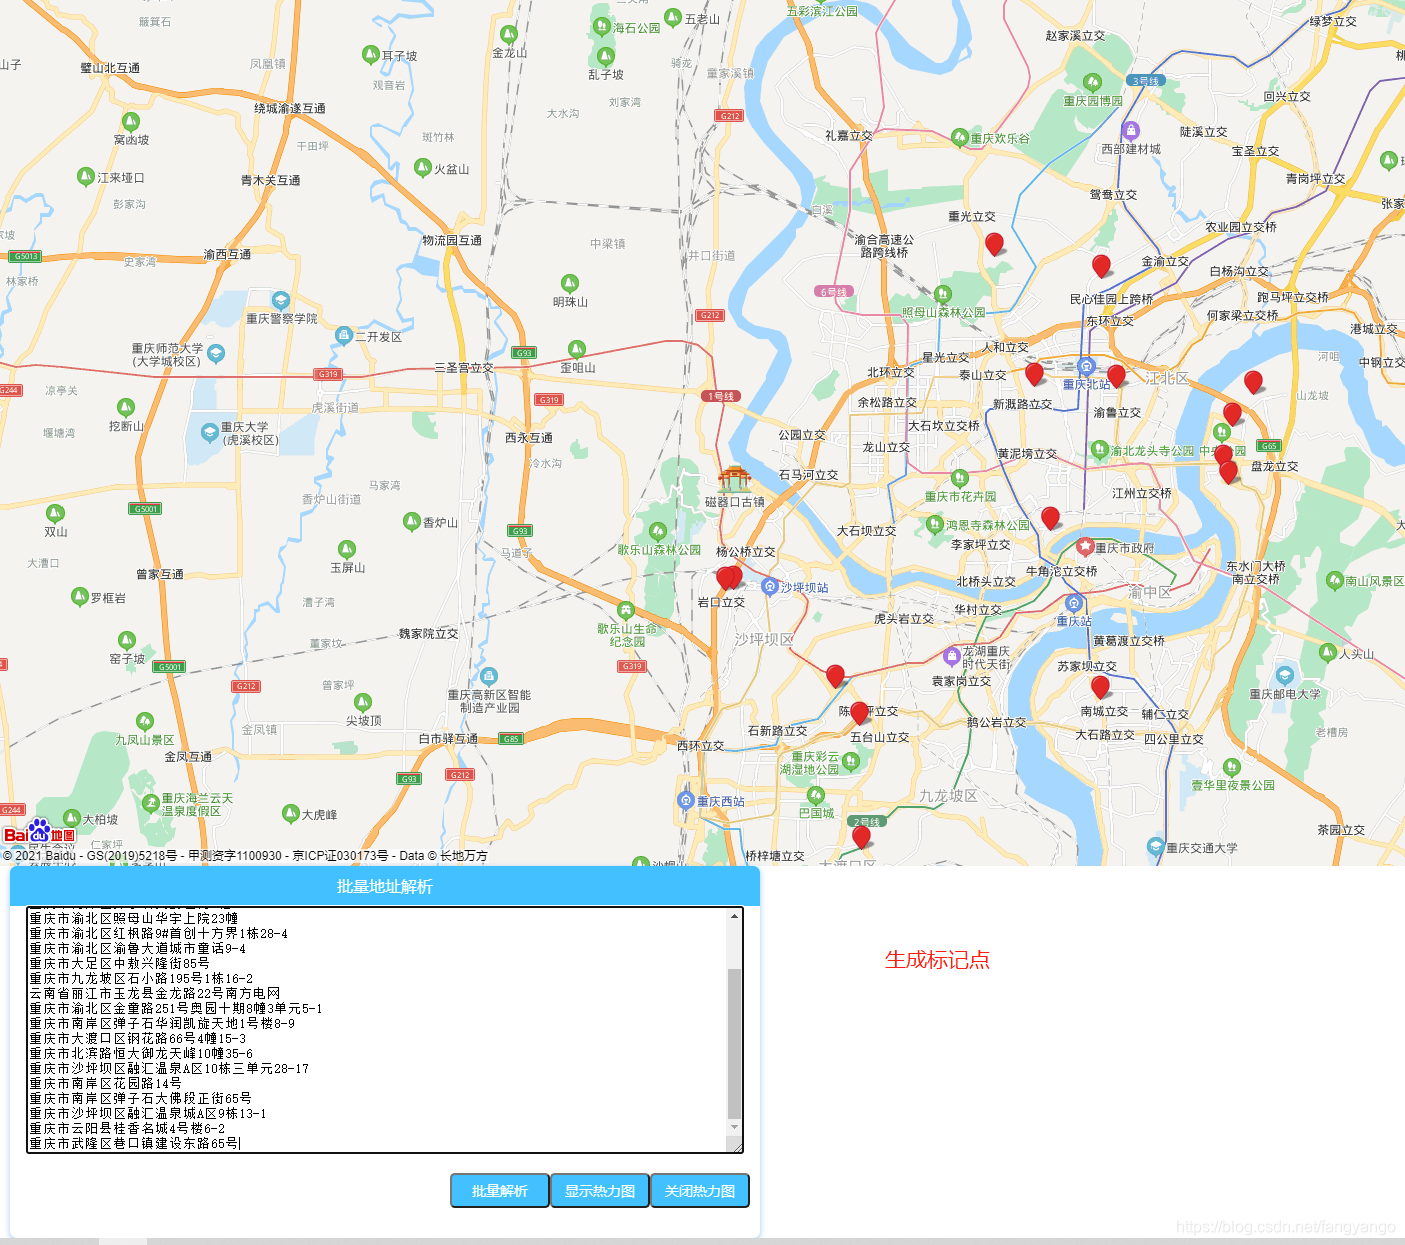
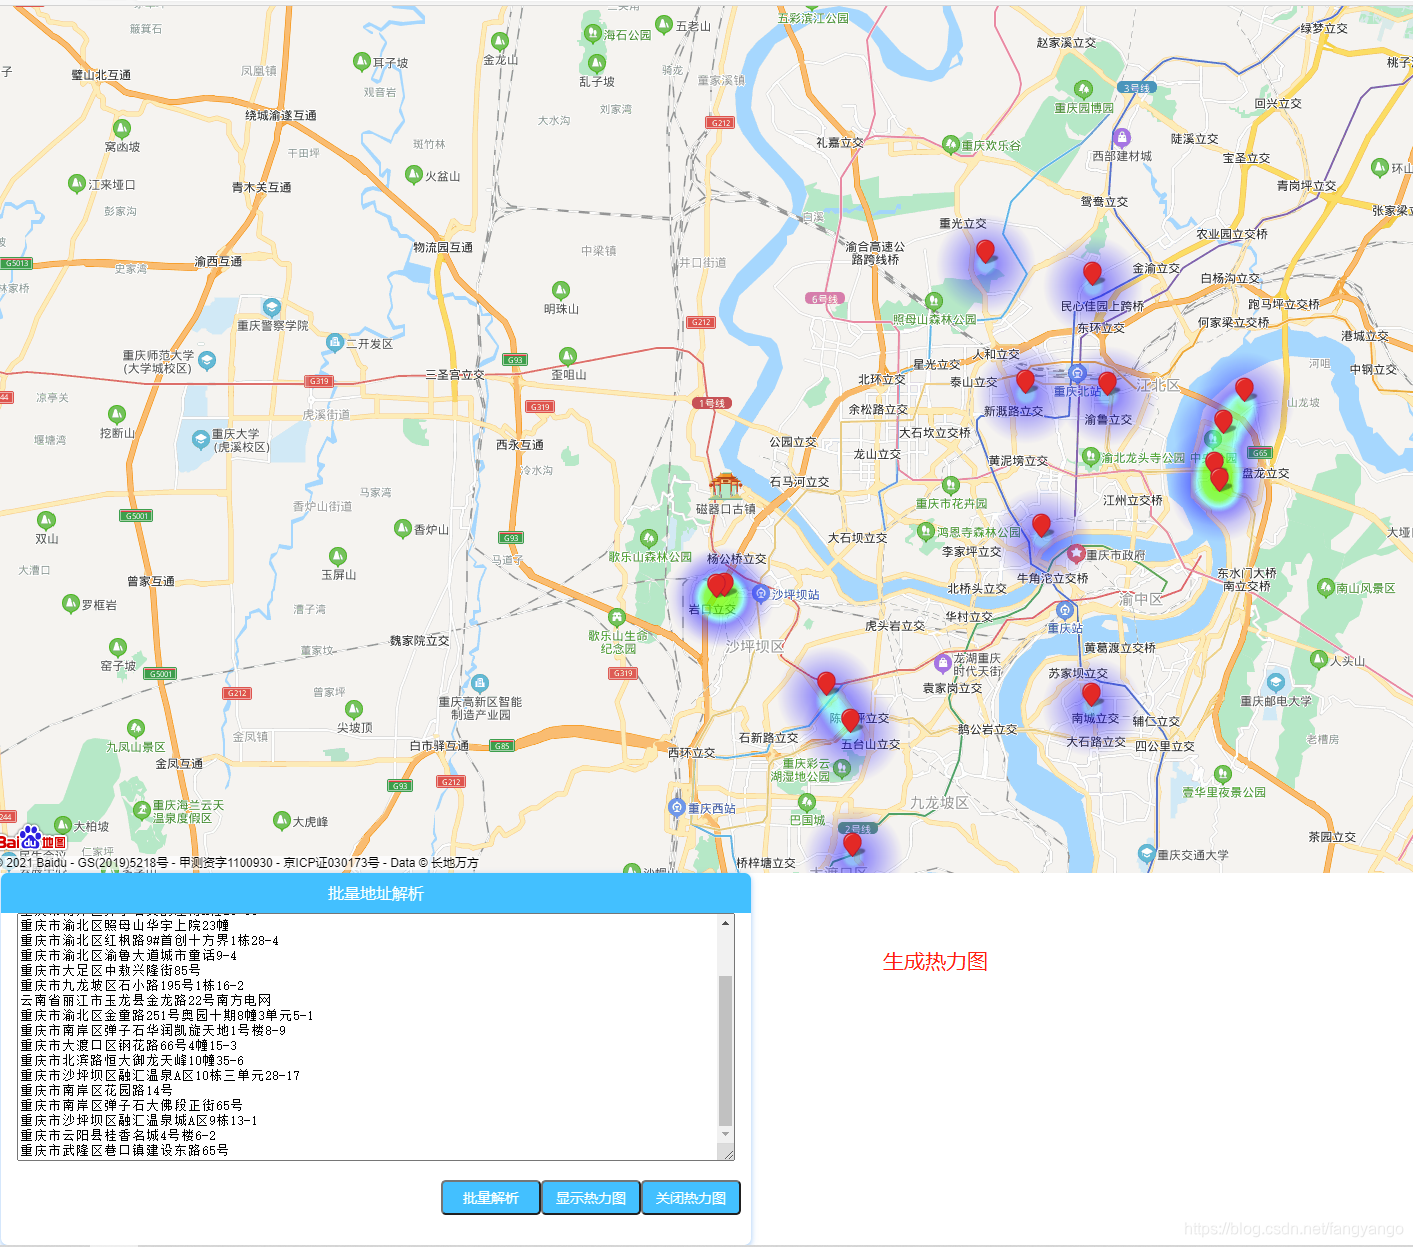
 使用百度地图API实现,目的很简单,因为经常会分析客户地图,通过客户居住/工作地址,自动生成标记点和热力图,做销售的朋友都懂,这可能是家常便饭。

要用到两个百度的API

	<script type="text/javascript" src="http://api.map.baidu.com/api?v=2.0&ak=你的KEY"></script>
    <script type="text/javascript" src="http://api.map.baidu.com/library/Heatmap/2.0/src/Heatmap_min.js"></script>
  • 2
    点赞
  • 4
    收藏
    觉得还不错? 一键收藏
  • 打赏
    打赏
  • 0
    评论
(function(w){     // the heatmapFactory creates heatmap instances     var heatmapFactory = (function(){     // store object constructor     // a heatmap contains a store     // the store has to know about the heatmap in order to trigger heatmap updates when datapoints get added     var store = function store(hmap){         var _ = {             // data is a two dimensional array             // a datapoint gets saved as data[point-x-value][point-y-value]             // the value at [point-x-value][point-y-value] is the occurrence of the datapoint             data: [],             // tight coupling of the heatmap object             heatmap: hmap         };         // the max occurrence - the heatmaps radial gradient alpha transition is based on it         this.max = 1;         this.get = function(key){             return _[key];         };         this.set = function(key, value){             _[key] = value;         };     }设置热力图展现的详细数据, 实现之后,即可以立刻展现 @param {Json Object } data{"<b>max</b>" : {Number} 权重的最大值,<br />"<b>data</b>" : {Array} 坐标详细数据,格式如下 <br/>{"lng":116.421969,"lat":39.913527,"count":3}, 其中<br/>lng lat分别为经纬度, count权重值添加势力图的详细坐标点@param {Number} lng 经度坐标@param {Number} lat 经度坐标@param {Number} count 经度坐标

“相关推荐”对你有帮助么?

  • 非常没帮助
  • 没帮助
  • 一般
  • 有帮助
  • 非常有帮助
提交
评论
添加红包

请填写红包祝福语或标题

红包个数最小为10个

红包金额最低5元

当前余额3.43前往充值 >
需支付:10.00
成就一亿技术人!
领取后你会自动成为博主和红包主的粉丝 规则
hope_wisdom
发出的红包

打赏作者

fangyango

你的鼓励将是我创作的最大动力

¥1 ¥2 ¥4 ¥6 ¥10 ¥20
扫码支付:¥1
获取中
扫码支付

您的余额不足,请更换扫码支付或充值

打赏作者

实付
使用余额支付
点击重新获取
扫码支付
钱包余额 0

抵扣说明:

1.余额是钱包充值的虚拟货币,按照1:1的比例进行支付金额的抵扣。
2.余额无法直接购买下载,可以购买VIP、付费专栏及课程。

余额充值