


 文章介绍了在使用Vue和Echarts结合渲染航线图时遇到的问题,即在切换数据时浏览器崩溃。原因在于将Echarts实例定义在了Vue的data中。为解决此问题,文章提出应将Echarts实例定义为全局变量,通过在`mounted`生命周期钩子中初始化,并在数据切换时使用`clear`方法和`setOption`更新图表,避免了浏览器崩溃。
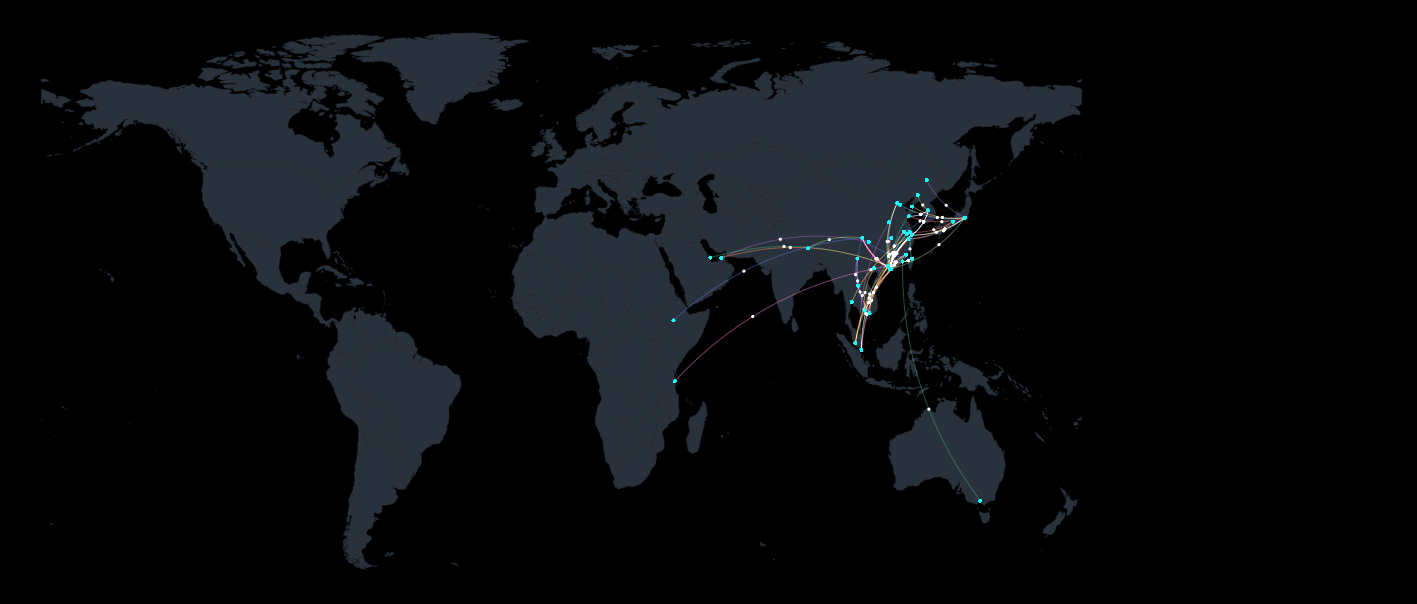
1、需求:根据数据渲染航线图
-
通过vue+echarts 实现
-
过程中遇到bug:切换数据时,浏览器出现崩溃,原因是将echarts 实例定义在了vue的data 中
-
需要将echarts 实例定在script标签中,定义为全局变量
<template>
  <div class="container">
    <div @click="handleChangeDate()">切换日期</div>
    <div id="echarts-map"></div>
  </div>
</template>
<script>
import world from "@/assets/world.json";
import tradeData1 from "@/assets/libs/data1.json";
import tradeData2 from "@/assets/libs/data2.json";
import * as echarts from "echarts";
let list = [];
let myChart = null;
export default {
  data() {
    return {
      pointArr:[],
      option:{},
      serieslinesData:[]
    };
  },
  beforeMount(){ },
  mounted() {
    var chartDom = document.getElementById("echarts-map");
    myChart = echarts.init(chartDom);
    // 1号json
    list = tradeData1
    this.getSerieslines()
    this.drawChart();
  },

  methods: {
    // 切换日期
    handleChangeDate(){
      // 2号json
      list = tradeData2
      myChart.clear()
      this.getSerieslines()
      this.$nextTick(()=>{
        this.option.series = this.serieslinesData;
        myChart.setOption(this.option,true);
      })
    },
    // 处理数据
    getSerieslines() {
      let res = [];
      list.forEach((item) => {
        this.pointArr.push({ value: item.source, },{ value: item.target,});
        res.push(this.getPontLine(item.flightNumber, [item.source, item.target]));
        res.push(this.getPoint())
      });
      this.serieslinesData = res;
    },

    // init chart
    drawChart() {
      // 画背景
      echarts.registerMap("world", world);

      this.option = {
        backgroundColor: "#000", //背景色
        geo: {
          id: "world",
          map: "world",
          // 是否开启鼠标缩放和平移漫游 默认不开启 如果只想要开启缩放或者平移,可以设置成 'scale' 或者 'move' 设置成 true 为都开启
          roam: false,
          // 图形上的文本标签
          label: {
            show: false, // 是否显示对应地名
          },
          zoom: 1,
          // 地图区域的多边形 图形样式
          itemStyle: {
            borderWidth: 0.5, // 描边线宽 为 0 时无描边
            normal: {
              areaColor: "#29323c", //地图前景色
              borderColor: "#29323c", // 国界边框色
            },
          },
          legend: {
            selectedMode: false,
          },
          // 高亮状态下的多边形和标签样式
          emphasis: {
            label: {
              show: false, // 是否显示标签
              color: "#29323c", // 文字的颜色 如果设置为 'auto',则为视觉映射得到的颜色,如系列色
            },
            itemStyle: {
              areaColor: "#29323c", // 地图悬浮颜色
            },
            lineStyle: {
              color: ''
            }
          },
          // 自定义地区的名称映射
          nameMap: name,
          // 地图系列中的数据内容数组 数组项可以为单个数值
        },
        series: this.serieslinesData,
        tooltip: {
          trigger: "item",
          show: false
        },
      };
      myChart.clear();
      myChart.setOption(this.option,true);
    },
    getPoint() {
      return {
        type: "scatter",
        coordinateSystem: "geo",
        geoIndex: 0,
        zlevel: 4,
        label: {
          formatter: "{b}",
          position: "bottom",
          color: "#fff",
          fontSize: 12,
          distance: 10,
          show: true,
        },
        symbol: "circle",
        symbolSize: 3,
        itemStyle: {
          color: "rgb(22,255,255, 1)",
          // color: "#9F98FA",
          opacity: 1,
        },
        silent: true,
        data: this.pointArr,
      }
    },
    getPontLine(flightNumber, coords, color = "", width = 1) {
      return {
        name: flightNumber,
        type: "lines", //  飞行的路径线
        zlevel: 1,
        large: true,
        effect: {
          //  尾迹特效 需要单独 放在一个层
          show: true,
          period: 3, // 动画时间  -- 设置后 同时到达
          // constantSpeed:50,//配置特效图形的移动动画是否是固定速度,单位像素/秒,设置为大于 0 的值后会忽略 period 配置项
          trailLength: 0, // 特效尾迹的长度
          color: "#fff",
          symbolSize: 3,

        },
        blendMode: 'lighter',
        lineStyle: {
          normal: {
            color,
            width,
            curveness: 0.17, // 边的 曲度
          },
          emphasis: {
            color,
          }
        },
        data: [
          {
            fromName: "",
            toName: "",
            coords,
          },
        ],
      }

    },
  },
};
</script>

<style lang="scss" scoped>
.container {
  height: 100%;
  width: 100%;
}

#echarts-map {
  background-color: #333333;
  height: 100%;
  width: 100%;
}
</style>


 1万+
1万+

 被折叠的 条评论
为什么被折叠?
被折叠的 条评论
为什么被折叠?
 到【灌水乐园】发言


