出自公司Chief Architect:Peter Chui
转载必须经过本人同意并且注明
Ever gotten any "Out of memory" errors? Or applications running slower and slower over time? It's time to investigate whether your app is leaking resources.
There are many kinds of resource leak. The most common one is memory leak. You can detect memory leak by observing your app's memory usage under Performance Monitor.
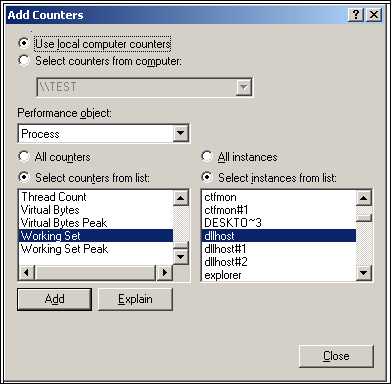
Here are the steps (see P1.BMP):
1) Run "perfmon"
2) Add the following counter:
- Performance Object: Process
- Counter: Working Set
- Instance: select the processes you want to monitor. For IIS, it would be DLLHOST
Monitor the trend over a couple days (if the leak is slow), or run stress test to force the leak to show up sooner. If you observes working set keeps increasing and does not go down, it's likely you have a mem leak.
P2.BMP shows a slow memory leak in one of the components installed on Actinia (IIS server for Dimension in China). As you can see, the working set keeps increasing slowly over the duration of 1 day and 22 hours. Eventually, the server will run out of memory and cannot handle any more requests. And network team will have to restart the IIS service to recover from the problem.


 3882
3882

 被折叠的 条评论
为什么被折叠?


