


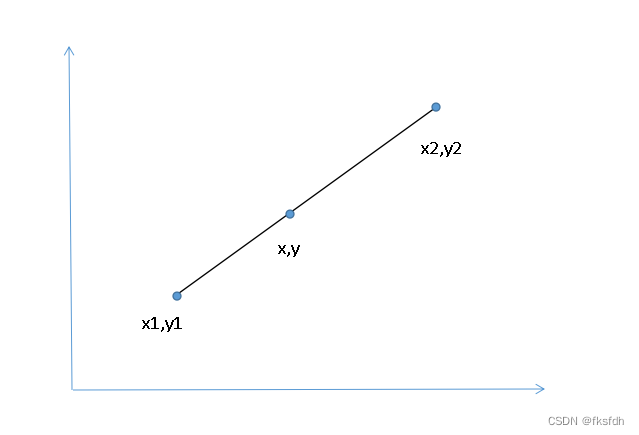
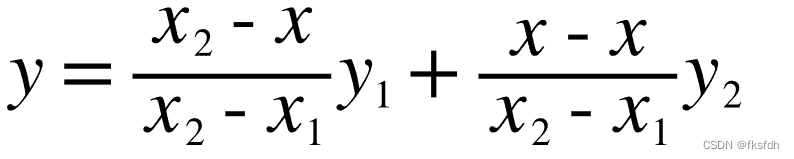
1、单线性插值

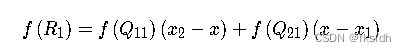
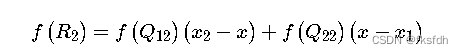
化简得:
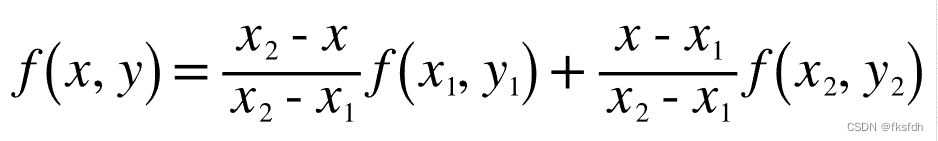
重要公式
将y视为像素值的函数;
2、双线性插值
问题:求P点的像素值?
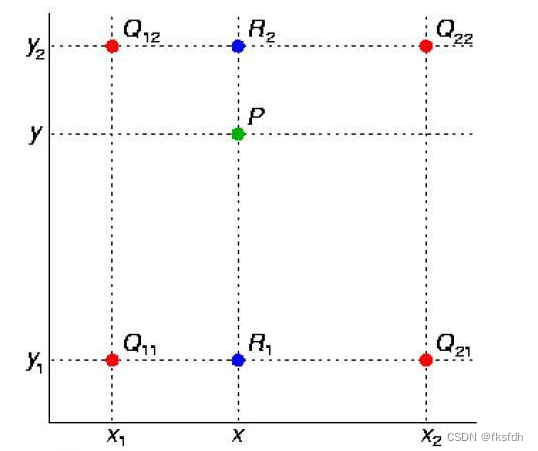
根据单线性插值公式:
1、得到R1和R2点的像素值:
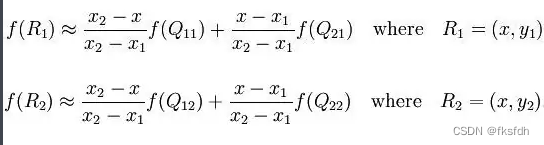
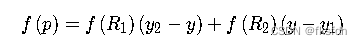
2、然后通过R1和R2线性插值得到P点的像素值:
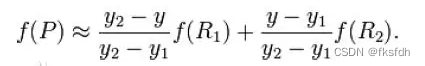
所以,一共使用了三次单线性插值得到,最终的像素值。
另外,其中由于相邻像素点差1,所以y2 - y1 = 1 ,和x2-x1 = 1,所以分母就为1.
最终得到的计算公式为:
3、最近邻法
使用下面公式,寻找最近一个像素值
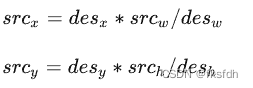
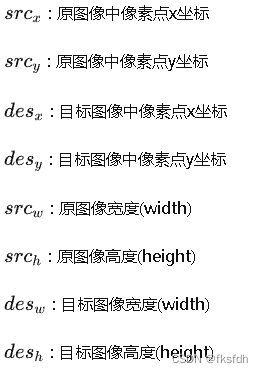
其中:
存在问题:右偏移
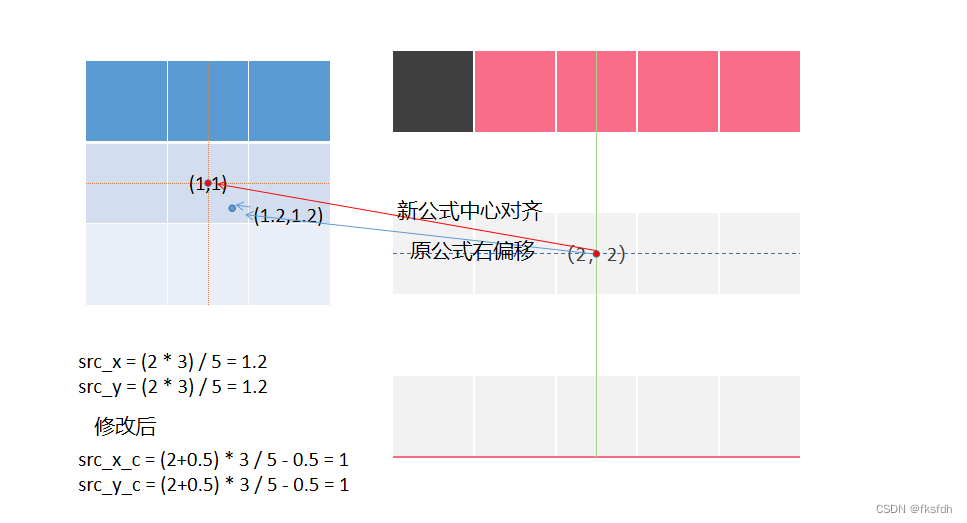
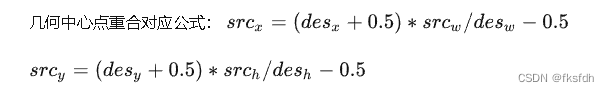
原公式是右偏移的,新公式中心对其了。
因为在原公式中是右偏移的,所以使用中心点重合来消除一下。
下面是优化公式:
4、双线性插值简单实现
通过最邻近找到P点,然后需要找到出四个相邻像素点。
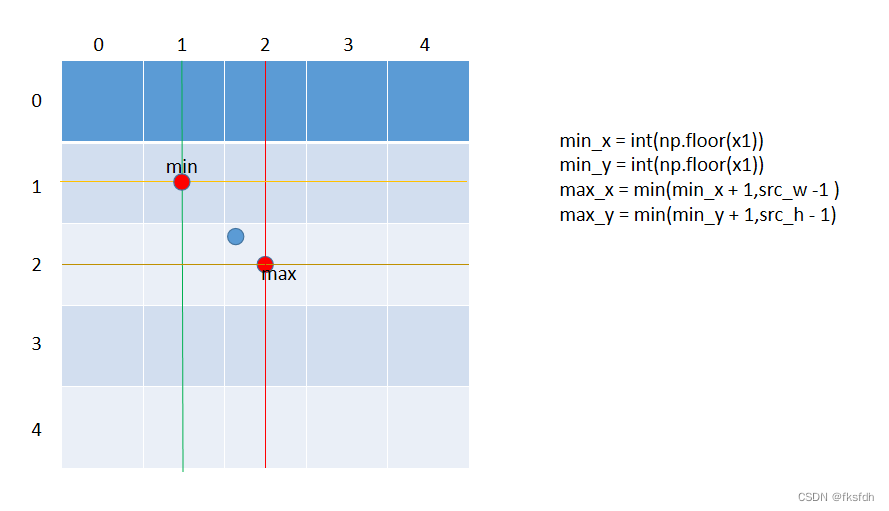
通过floor函数找到下限,floor +1 找到上限,但是要防止超过图像的像素坐标值
import numpy as np
import matplotlib.pyplot as plt
from PIL import Image


def Bilinear(dst,des_w,des_h,src_w,src_h):

    for c in range(3):
        for dst_x in range(des_w):
            for dst_y in range(des_h):
                src_x = (dst_x + 0.5)*src_w/des_w - 0.5
                src_y = (dst_y + 0.5)*src_h/des_h - 0.5

                #四个临近点
                src_x_1 = int(np.floor(src_x))
                src_y_1 = int(np.floor(src_y))
                src_x_2 = min(src_x_1 + 1,src_w -1)
                src_y_2 = min(src_y_1 + 1,src_h -1)

                R1 = (src_x_2 - src_x) * src[src_y_1,src_x_1,c] + (src_x - src_x_1) * src[src_y_1,src_x_2,c]
                R2 = (src_x_2 - src_x) * src[src_y_2,src_x_1,c] + (src_x - src_x_1) * src[src_y_2,src_x_2,c]
                P = int((src_y_2 - src_y) * R1 + (src_y - src_y_1) * R2)
                dst[dst_y, dst_x, c] = P

    return dst


def show_img(dst):
    dst = dst.astype(np.uint8)
    plt.figure()
    plt.subplot(121)
    plt.imshow(src)
    plt.subplot(122)
    plt.imshow(dst)
    # plt.imsave("./img.png",dst)
    plt.show()


if __name__ == '__main__':

    src = Image.open("./img_1.png")
    src_w = src.width
    src_h = src.height
    src = np.array(src)

    dst = np.ones((960, 1280, 3))
    des_w = dst.shape[1]
    des_h = dst.shape[0]
    # print(des_w,des_h)

    dst = Bilinear(dst,des_w,des_h,src_w,src_h)
    show_img(dst)

5、pytorch中双线性插值
import torch
from torch.nn import functional as F
from PIL import Image
import numpy as np
import matplotlib.pyplot as plt

img = Image.open("./img.png")
img = np.array(img,dtype=float)
print(img.shape)
img = torch.from_numpy(img)
print(img.shape)
img = img.unsqueeze(0).permute(0,3,1,2) #[b,c,h,w]

img = F.interpolate(img,scale_factor=(2,2),mode='bilinear')
# print(img.shape)
img = img.squeeze(0).permute(1,2,0)
print(img.shape)

a = torch.tensor(img, dtype=torch.uint8)
print(a.shape)
plt.figure()
plt.imshow(a)
plt.show()


 1万+
1万+


 被折叠的 条评论
为什么被折叠?
被折叠的 条评论
为什么被折叠?
 到【灌水乐园】发言


