


图数据库的可视化
Nebula本身自带的Studio
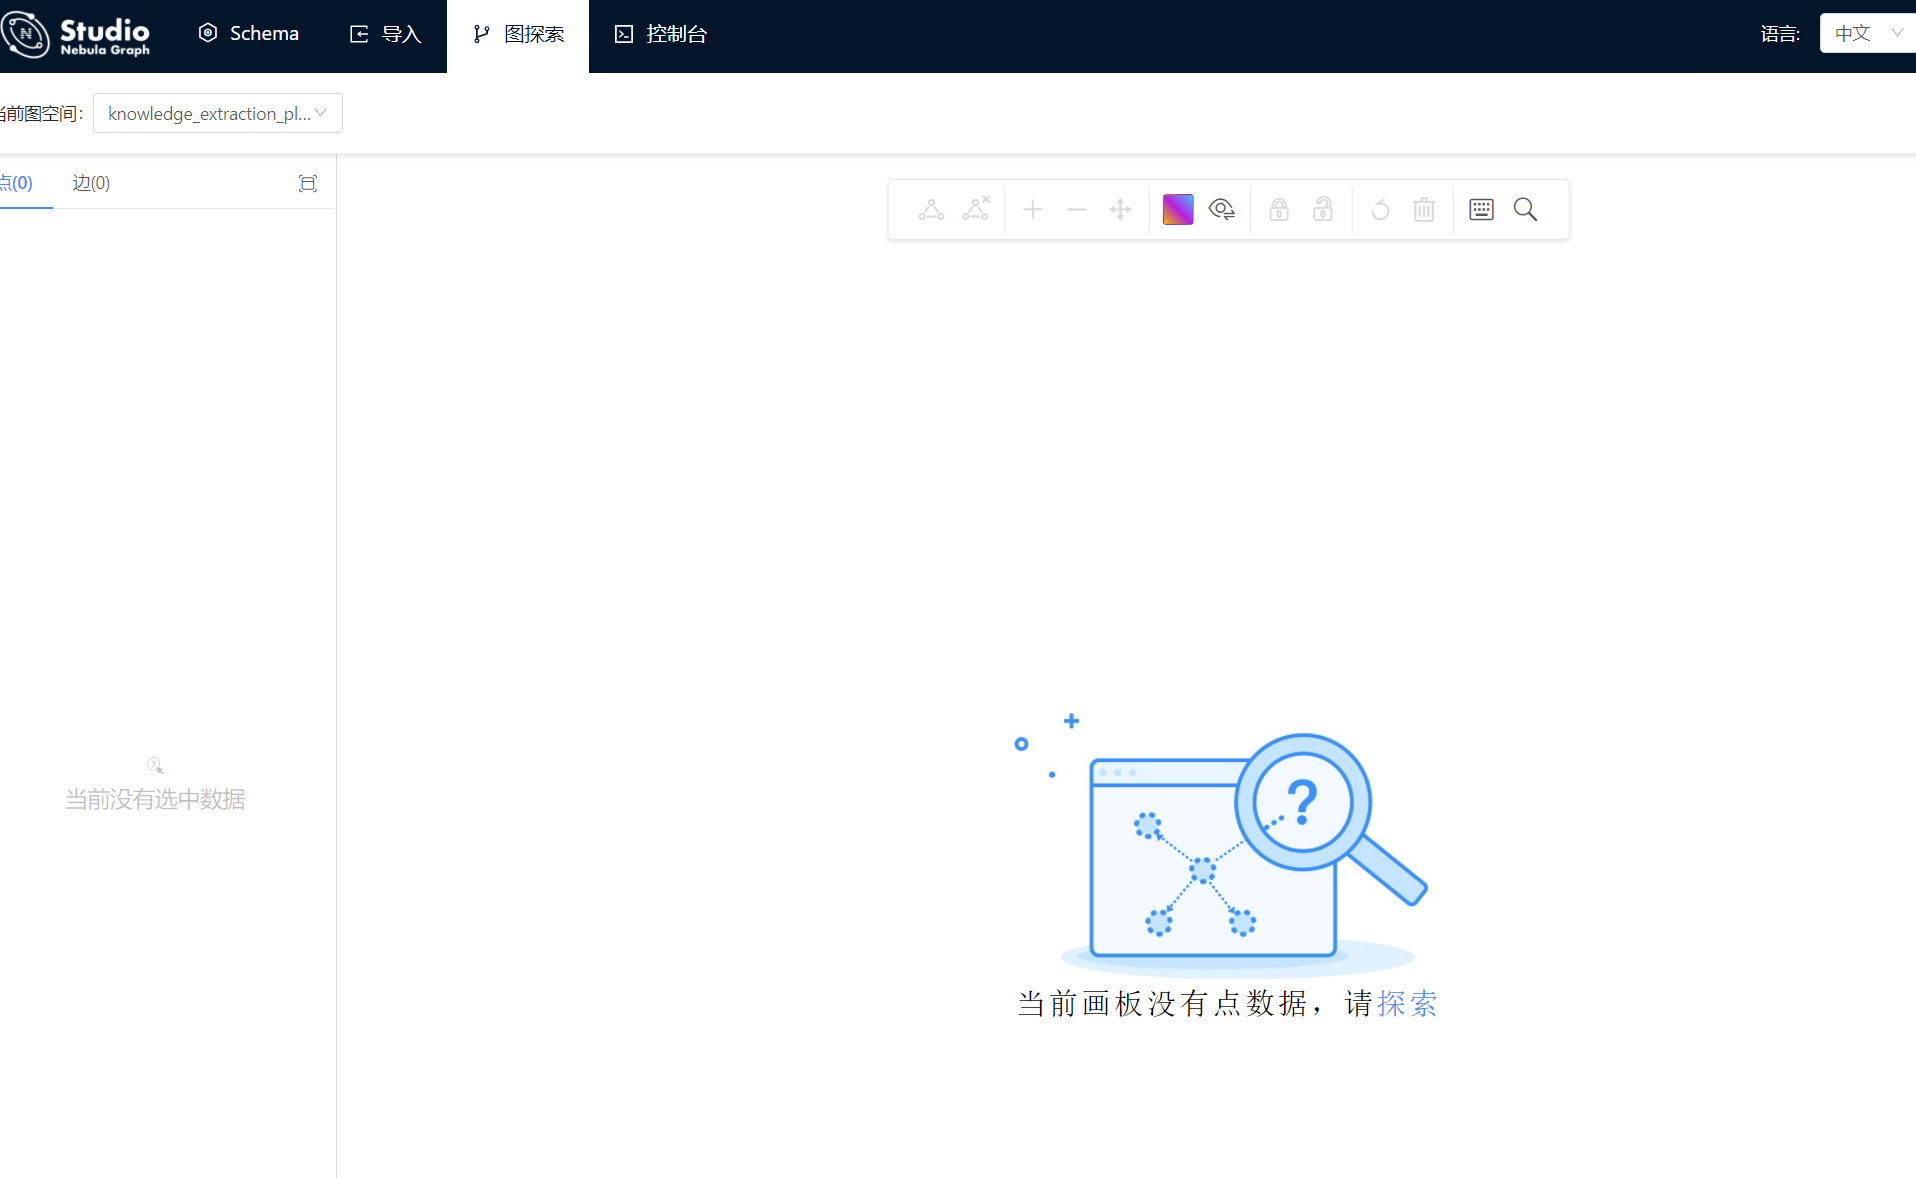
虽然很好用, 但是并不能直接嵌入到业务系统中, 也不能直接给客户用, 所以我找了好多也没有说直接能展示图关系的, 但是我看网上好多都说是基于D3.js就可以做, 但是我是一个后端呀, D3相对复杂, 但是需求刚在眼前还是要做的..
基于D3开发Nebula的关系可视化
前端
前端在网上找到了一个基于React+antd做的一个Demo, 为此我还特意去学习了React+Antd+D3
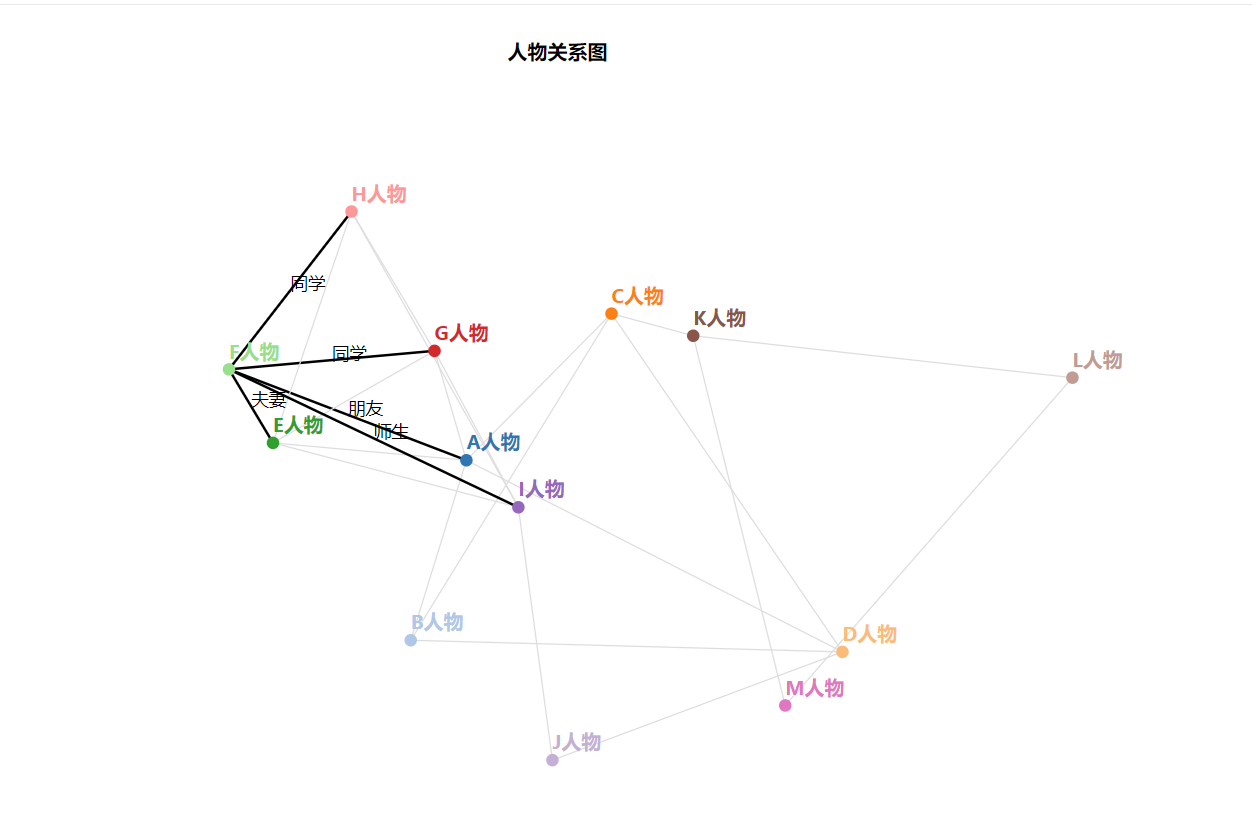
这个就可以用于做Nebula的可视化
于是我把这个代码从Git上拿了下来
看了一下, 发现大佬写的非常好
前端需要的数据结构
<Route exact path="/simple-force-chart" component={SimpleForceChart} />
import React from 'react'
import {Row, Col, Card} from 'antd'
import D3SimpleForceChart from '../components/charts/D3SimpleForceChart'

class SimpleForceChart extends React.Component {
    render() {
        const data = {
            nodes:[
                {
                    "i": 0,
                    "name": "test3",
                    "description": "this is desc!",
                    "id": "186415162885763072"
                },
                {
                    "i": 1,
                    "name": "test4",
                    "description": "this is desc!",
                    "id": "186415329756147712"
                },
                {
                    "i": 2,
                    "name": "test7",
                    "description": "this is desc!",
                    "id": "186420276928757760"
                },
                {
                    "i": 3,
                    "name": "test6",
                    "description": "this is desc!",
                    "id": "186417155309998080"
                }
            ],
            edges:[
                {
                    "source": 0,
                    "target": 1,
                    "relation": "类-类",
                    "id": "1",
                    "value": 2
                },
                {
                    "source": 1,
                    "target": 2,
                    "relation": "类-类",
                    "id": "1",
                    "value": 3
                },
                {
                    "source": 1,
                    "target": 3,
                    "relation": "类-类",
                    "id": "1",
                    "value": 3
                }
            ]
        }
        return (
            <div className="gutter-example simple-force-chart-demo">
                <Row gutter={10}>
                    <Col className="gutter-row" md={24}>
                        <div className="gutter-box">
                            <Card title="D3 简单力导向图" bordered={
     false}>
                                <D3SimpleForceChart data={data}/>
                            </Card>
                        </div>
                    </Col>
                </Row>
            </div>
        )
    }
}

export default SimpleForceChart
D3渲染
import React from 'react'
import PropTypes from 'prop-types'
import * as d3 from 'd3'

class D3SimpleForceChart extends React.Component {
  componentDidMount() {
    // 容器宽度
    const containerWidth = this.chartRef.parentElement.offsetWidth
    // 数据
    const data = this.props.data
    // 外边距
    const margin = { top: 60, right: 60, bottom: 60, left: 60 }
    // 计算宽度
    const width = containerWidth - margin.left - margin.right
    // 固定高度
    const height = 700 - mar
最低0.47元/天 解锁文章


 482
482


 被折叠的 条评论
为什么被折叠?
被折叠的 条评论
为什么被折叠?
 到【灌水乐园】发言


