


文章目录
配置prometheus
1.安装prometheus(9090)并设置配置文件
(config/prometheus.yml 配置数据源pushgateway,node_exporter等)
2. 要使用pushgateway:将数据提交到网关,prometheus再去端口拉取(端口:9091需要为监控目标安装)
3. 使用node_exporter:在服务器上安装exporter,并启动exporter,所有的监控数据就在端口9100/metric上可见
理解时间序列
时许数据库(TSDB)
所有采集到的样本数据会以时间序列的方式保存。
time-series以时间戳和value序列顺序存放,称为向量。并且每条time-series通过**指标名称(metrics name)和一组标签(labelset)**命名
坐标轴:
1.时间戳(timestamp)
2.值(value)
坐标轴名:
3.time-series命名:指标名(metrics name )+ 标签( labelset)
^
│ . . . . . . . . . . . . . . . . . . . node_cpu{cpu=“cpu0”,mode=“idle”}
│ . . . . . . . . . . . . . . . . . . . node_cpu{cpu=“cpu0”,mode=“system”}
│ . . . . . . . . . . . . . . . . . . node_load1{}
│ . . . . . . . . . . . . . . . . . .
v
<------------------ 时间 ---------------->
在time-series中的每一个点称为一个样本(sample),样本由以下三部分组成:
指标(metric):metric name和描述当前样本特征的labelsets;
时间戳(timestamp):一个精确到毫秒的时间戳;
样本值(value): 一个float64的浮点型数据表示当前样本的值。
<--------------- metric ---------------------------------------------------><------timestamp -----><-value->
http_request_total{status=“200”, method=“GET”}@1434417560938 => 94355
http_request_total{status=“200”, method=“GET”}@1434417561287 => 94334
http_request_total{status=“404”, method=“GET”}@1434417560938 => 38473
http_request_total{status=“404”, method=“GET”}@1434417561287 => 38544
http_request_total{status=“200”, method=“POST”}@1434417560938 => 4748
http_request_total{status=“200”, method=“POST”}@1434417561287 => 4785
也可以写成
{name=“api_http_requests_total”,method=“POST”, handler=“/messages”}
底层数据结构
type Metric LabelSet
type LabelSet map[LabelName]LabelValue
type LabelName string
type LabelValue string
Metric类型
counter
只增不减的计数器,记录事件发生次数,一般以_total结尾
Guage
反应系统当前状态,可增可减的仪表盘
Histogram,Summary
获取量化指标的平局值,
PromQL
直接使用监控指标查询
http_requests_total
http_requests_total{}
在{}中使用=或!=匹配模式筛选
http_requests_total{instance=“localhost:9090”}
正则表达式?
PromQL还可以支持使用正则表达式作为匹配条件,多个表达式之间使用|进行分离:
使用label=~regx表示选择那些标签符合正则表达式定义的时间序列;
反之使用label!~regx进行排除;
例如,如果想查询多个环节下的时间序列序列可以使用如下表达式:
http_requests_total{environment=~“staging|testing|development”,method!=“GET”}
范围查询(范围选择器[], s,m,h,d,w,y)
http_requests_total{}[5m]:返回最近5分钟的所有样本数据
时间位移
在瞬时向量表达式或者区间向量表达式中,都是以当前时间为基准:
可以使用offset时间位移操作:http_request_total{} offset 5m
聚合
#查询系统所有http请求的总量
sum(http_request_total)
#按照mode计算主机CPU的平均使用时间
avg(node_cpu) by (mode)
#按照主机查询各个主机的CPU使用率
sum(sum(irate(node_cpu{mode!=‘idle’}[5m])) / sum(irate(node_cpu[5m]))) by (instance)
标量和字符串
标量为数字,没有时序
字符串作为表达式,会直接返回
合法PromQL
1.包含指标名称 metric name
2.或者不会批评空字符串的标签过滤器 {label = value}
满足一个就行。
PromQL操作符号
数学运算
(+) (-) (*) (/) (%) (^)
node_memory_free_bytes_total / (1024 * 1024)
时间序列(瞬时向量)可以理解为(二维,横轴为时间,纵轴为数值,图表名为metricname{label:value…})的一条曲线。
运算原则
1.当瞬时向量和标量(数值)之间进行数学运算,会作用于曲线上的每一个点。
2.当瞬时向量和瞬时向量之间进行数学运算时,会更加复杂,
例如:node_disk_bytes_written + node_disk_bytes_read
会依次找到与左边向量元素匹配(标签完全一致)的右边元素进行运算,如果没找到则直接丢弃。同时新的时间序列不包含指标名称
该表达式返回结果如下:
{device=“sda”,instance=“localhost:9100”,job=“node_exporter”}=>1634967552@1518146427.807 + 864551424@1518146427.807
{device=“sdb”,instance=“localhost:9100”,job=“node_exporter”}=>0@1518146427.807 + 1744384@1518146427.807
匹配原则
一对一
从操作符两边表达式获取的瞬时向量依次比较并找到唯一匹配(标签完全一致)的样本值。
在两边表达式标签不一致的情况下,可以使用on(label)或ignoring(label list)修改表情的匹配行为,on用于限定,ignoring可以忽略。
样本:
method_code:http_errors:rate5m{method="get", code="500"}  24
method_code:http_errors:rate5m{method="get", code="404"}  30
method_code:http_errors:rate5m{method="put", code="501"}  3
method_code:http_errors:rate5m{method="post", code="500"} 6
method_code:http_errors:rate5m{method="post", code="404"} 21

method:http_requests:rate5m{method="get"}  600
method:http_requests:rate5m{method="del"}  34
method:http_requests:rate5m{method="post"} 120

PromQL表达式:
method_code:http_errors:rate5m{code="500"} / ignoring(code) method:http_requests:rate5m

返回:
{method="get"}  0.04            //  24 / 600
{method="post"} 0.05            //   6 / 120
多对一和一对多
多对一和一对多两种匹配模式指的是“一”侧的每一个向量元素可以与"多"侧的多个元素匹配的情况。在这种情况下,必须使用group修饰符:group_left或者group_right来确定哪一个向量具有更高的基数(充当“多”的角色)。
表达式:
method_code:http_errors:rate5m / ignoring(code) group_left method:http_requests:rate5m

返回:
{method="get", code="500"}  0.04            //  24 / 600
{method="get", code="404"}  0.05            //  30 / 600
{method="post", code="500"} 0.05            //   6 / 120
{method="post", code="404"} 0.175           //  21 / 120
bool运算进行过滤
==; !=; >; <; >=; <=
(node_memory_bytes_total - node_memory_free_bytes_total) / node_memory_bytes_total > 0.95
不希望过滤,返回bool值,用bool修饰
http_requests_total > bool 1000
集合运算符
and(并且);or(或);unless(排除)
vector1 and vector2 会产生一个由vector1的元素组成的新的向量。该向量包含vector1中完全匹配vector2中的元素组成。
vector1 or vector2 会产生一个新的向量,该向量包含vector1中所有的样本数据,以及vector2中没有与vector1匹配到的样本数据。
vector1 unless vector2 会产生一个新的向量,新向量中的元素由vector1中没有与vector2匹配的元素组成
运算符优先级
^
*, /, %
+, -
==, !=, <=, <, >=, >
and, unless
or
匹配模式
向量与向量之间进行运算操作时会基于默认的匹配规则:依次找到与左边向量元素匹配(标签完全一致)的右边向量元素进行运算,如果没找到匹配元素,则直接丢弃。
一对一
多对一和一对多
内置聚合函数
增长率
1.increase(node_cpu[2m]) / 120 <=> rate(node_cpu[2m]) 长尾问题
increase为何出现小数点:1.外推法。2.并不是在整的间隔的头尾取点
2.irate函数是通过区间向量中最后两个样本数据来计算区间向量的增长速率:irate(node_cpu[2m]);但是对于长趋势和告警中容易造成干扰
预测Gauge指标变化趋势
predict_linear(v range-vector, t scalar): t的单位为秒=>4*3600
基于2小时的样本数据,来预测主机可用磁盘空间的是否在4个小时候被占满,可以使用如下表达式:
predict_linear(node_filesystem_free{job=“node”}[2h], 4 * 3600) < 0
统计Histogram指标的分位数
Histogram的分位数计算需要通过histogram_quantile(φ float, b instant-vector)函数进行计算。其中φ(0<φ<1)表示需要计算的分位数,如果需要计算中位数φ取值为0.5,以此类推即可。
histogram_quantile(0.5, http_request_duration_seconds_bucket)
黄金指标和USE方法
监控所有
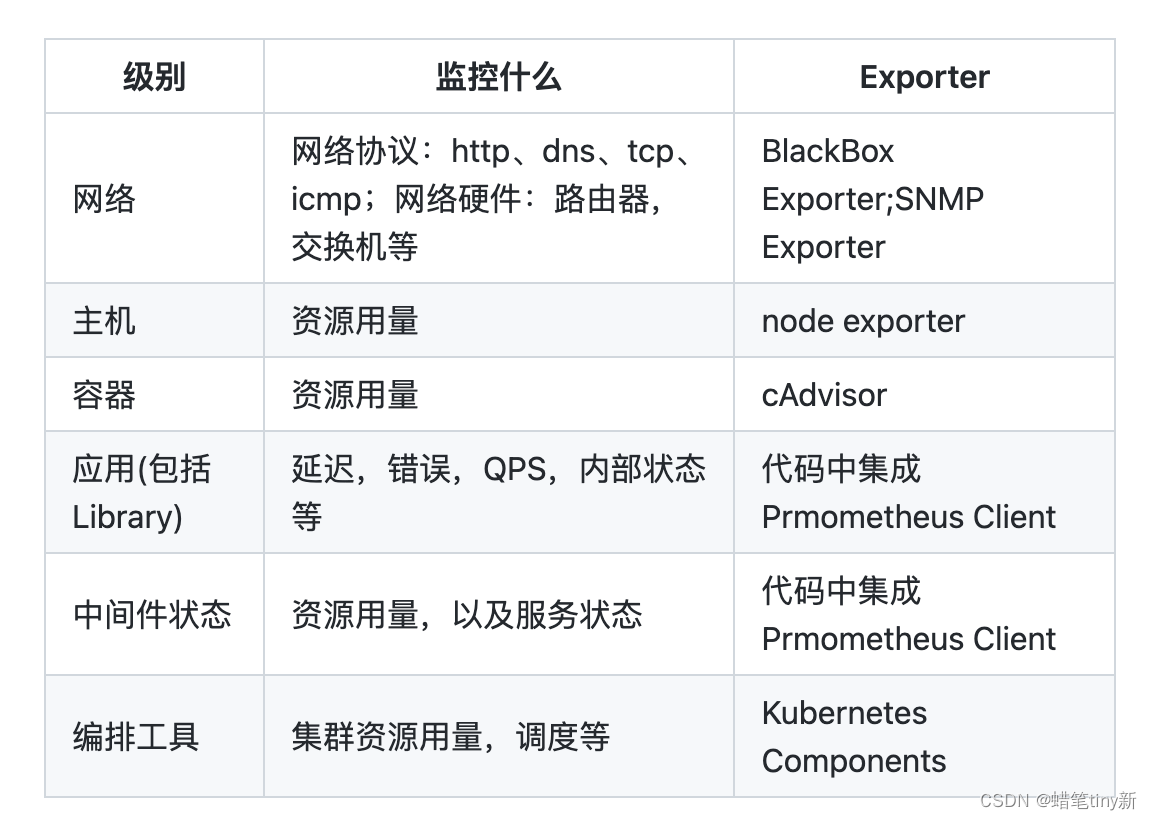
4个黄金指标
1.延迟:服务请求所需时间
2.通讯量:当前系统流量,衡量服务的容量需求
3.错误:发生的错误请求,衡量错误发生的速率
4.饱和度:衡量当前服务的饱和度
RED方法
(请求)速率:服务每秒接收的请求数。
(请求)错误:每秒失败的请求数。
(请求)耗时:每个请求的耗时


 9866
9866


 被折叠的 条评论
为什么被折叠?
被折叠的 条评论
为什么被折叠?
 到【灌水乐园】发言


