


一、Matplotlib基本概念
Matplotlib is a comprehensive library for creating static, animated, and interactive visualizations in Python.
Figure
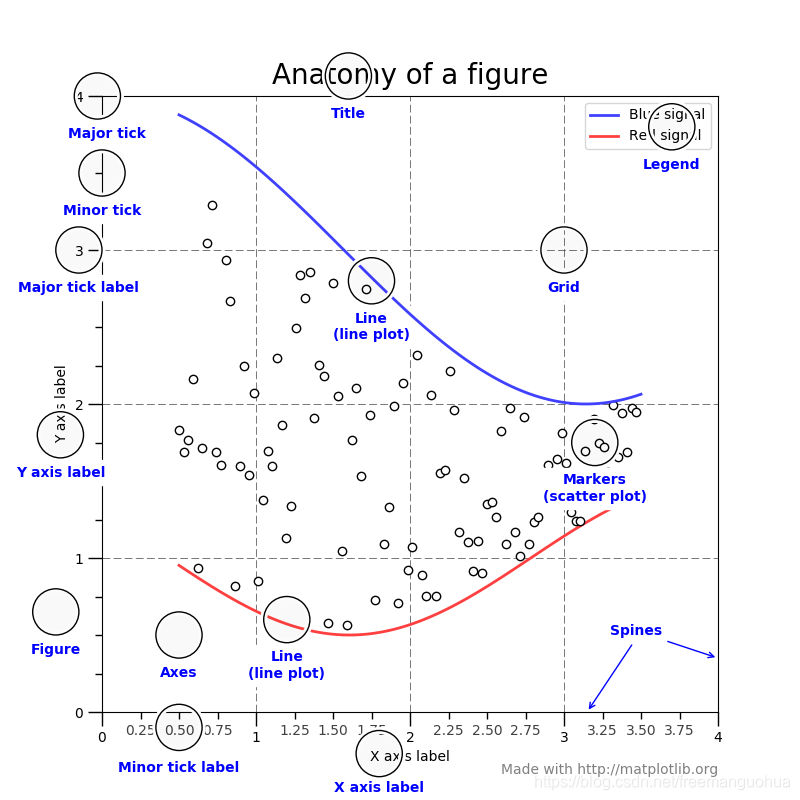
Figure通常包含Axes和canvas。最简单绘制Figure的方法有:
fig = plt.figure() # an empty figure with no Axes
fig, ax = plt.subplots() # a figure with a single Axes
fig, axs = plt.subplots(2, 2) # a figure with a 2x2 grid of Axes
Axes
This is what you think of as ‘a plot’, it is the region of the image with the data space. A given figure can contain many Axes, but a given Axes object can only be in one Figure.
 最低0.47元/天 解锁文章


 8903
8903


 被折叠的 条评论
为什么被折叠?
被折叠的 条评论
为什么被折叠?
 到【灌水乐园】发言


