d3学习之(Data Visualization with d3.js Cookbook )(第三章)-3

第三章 处理数据

  3.绑定函数作为数据

       D3所支持的优秀的方法(函数)编程风格,其中也包括了对数据也可以使用函数。这种特征能提供非常强大的能力在某种特定的环境下。下面将介绍的是更高级的d3编程,如果你的刚接触d3,不用担心你没有完全理解,随着学习的深入,你将对这种运用非常的熟悉。

       我们直接来看下面的代码:

<!DOCTYPE html>
<html>
<head>
    <meta charset="utf-8">
    <title>Function as Data</title>
    <link rel="stylesheet" type="text/css" href="styles.css"/>
    <script type="text/javascript" src="http://d3js.org/d3.v3.min.js"></script>
</head>

<body>
<div id="container"></div>

<script type="text/javascript">
    var data = []; // <- A

    var next = function (x) { // <- B
        return 15 + x * x;
    };
    
    var newData = function () { // <- C        
        data.push(next);
        return data;
    };

    function render(){
        var selection = d3.select("#container")
                    .selectAll("div")
                    .data(newData); // <- D

        selection.enter().append("div").append("span");

        selection.exit().remove();

        selection.attr("class", "v-bar")
            .style("height", function (d, i) {
                return d(i) + "px"; // <- E
            })
            .select("span")
                .text(function(d, i){ 
                    return d(i); // <- F
                }); 
    }
    
    setInterval(function () {
        render();
    }, 1500);

    render();
</script>

</body>

</html>

           在上面的代码中,我们展示了如何使用函数来作为数据绑定相应的可视化元素,这种功能非常强大便捷。上面的代码在浏览器中运行后会隔一段时间就自动产生一个新的div,运行一段时间后的效果如下图:


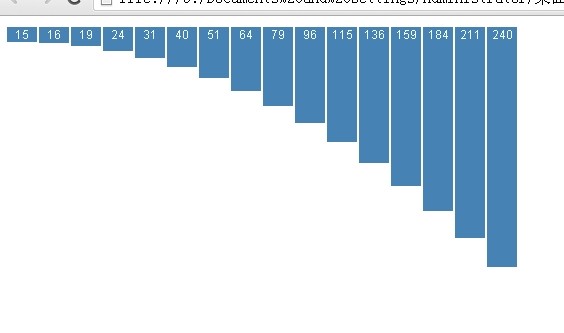
          那么程序是如何工作的呢? 在上面的例子中我们看到每隔1.5s页面就会增加一个长条型的div,要实现这种方式其实我们可以通过前面讲到的2个例子的方法,比如我们可以通过方程式产生一个整数数组,然后每隔1.5秒在数组在最后插入一个新的整数,然后再重新执行可视化。不过,在这个例子中我们用到了一个新的方法。

         这次我们首先定义了一个空的数组在A处,然后在B处定义了一个简单的方法,他的返回值就是方程15+x*x,紧接着又定义了一个方法,将B处生成的数据插入到A处定义的空数组中,我们来看详细代码:

  var data = []; // <- A


    var next = function (x) { // <- B
        return 15 + x * x;
    };
    
    var newData = function () { // <- C        
        data.push(next);
        return data;
    };

(这里有个疑问,在B处的代码中x为函数的参数,x在整个源码中并没有定义和赋值,在后面的代码中也找不到对x的操作,但是整个程序却能正常运行,通过结果我们可以看出,x实际是从0开始递增加1的,比如最开始div的长度是15=15+0*0,然后就是16=15+1*1,19=15+2*2……  )

         这个结构看起来非常奇怪对我们的可视化程序来说,来看看是如何实现对这个方法进行可视化的,在D处我们像前面的两个例子一样将可视化元素集和数据集进行绑定,不同的是现在的数据不再是一个数组而是一个newData函数。D3对数据的处理非常的灵活,如果你提供给data方法一个函数,D3会首先执行这个函数然后将函数的返回值作为data方法的参数。在这种情况下前面的疑问待会也会解开了,

先看代码:

  function render(){
        var selection = d3.select("#container")
                    .selectAll("div")
                    .data(newData); // <- D


        selection.enter().append("div").append("span");


        selection.exit().remove();


        selection.attr("class", "v-bar")
            .style("height", function (d, i) {
                return d(i) + "px"; // <- E
            })
            .select("span")
                .text(function(d, i){ 
                    return d(i); // <- F
                }); 
    }

         当第一次执行render()函数时newData函数返回的是一个next函数,因为这里函数都没有传递参数,当再次执行render()时,newData的返回值变成了有两个next函数的数组。那么通过我们对前面讲过的function(d,i)函数的理解,这里的数据d实际上就代表了一个next函数,而i则是代表的这个函数在整个newData数组中的索引,所以在E处和F处用d(i)实际上的效果就是将i作为参数传递给next函数,然后返回相应的数值。这里就解决了我们前面的疑问了。


        提示:

        在javascript中,function是特殊的对象,所以在语法上以上的方式同样也适用于以对象为数据绑定可视化元素,这一节中另一个需要注意的地方是函数也能够被用作数据,恒量比如说一个整数可以被看成一个不作任何操作的静态函数。

       这种方式在数据可视化中可能不会经常用到,但是一旦被适当的使用,这种功能会非常灵活和强大,特别是对待流动的数据集。

        还有一点值得注意的是可以被用作数据的函数必须是幂等的,

   在数学里,幂等有两种主要的定义。
   在某二元运算下,幂等元素是指被自己重复运算(或对于函数是为复合)的结果等于它自己的元素。例如,乘法下唯一两个幂等实数为0和1。
   某一元运算为幂等的时,其作用在任一元素两次后会和其作用一次的结果相同。例如,高斯符号便是幂等的。
一元运算的定义是二元运算定义的特例。


  • 0
    点赞
  • 0
    收藏
    觉得还不错? 一键收藏
  • 0
    评论
Book Description Mold your data into beautiful visualizations with d3.js Overview Build blocks of web visualizations Learn visualization with detailed walkthroughs Learn to use data more effectively Animate with d3.js Design good visualizations In Detail d3.js. provides a platform that help you create your own beautiful visualization and bring data to life using HTML, SVG and CSS. It emphasis on web standards that will fully utilize the capabilities of your web browser. Data Visualization with d3.js walks you through 20 examples in great detail. You can finally stop struggling to piece together examples you've found online. With this book in hand, you will learn enough of the core concepts to conceive of and build your own visualizations from scratch. The book begins with the basics of putting lines on the screen, and builds on this foundation all the way to creating interactive animated visualizations using d3.js layouts. You will learn how to use d3.js to manipulate vector graphics with SVG, layout with HTML, and styling with CSS. You'll take a look at the basics of functional programming and using data structures effectively – everything from handling time to doing geographic projections. The book will also help make your visualizations interactive and teach you how automated layouts really work. Data Visualization with d3.js will unveil the mystery behind all those beautiful examples you've been admiring. What you will learn from this book Draw with SVG shapes and path generators Add styles with HTML and CSS Use data structures effectively Dynamically update visualizations as data changes Animate visualizations Let the user explore your data Use layouts to create complex drawings Learn to identify what makes a good visualization good Approach This book is a mini tutorial with plenty of code examples and strategies to give you many options when building your own visualizations. Who this book is written for This book is ideal for anyone interested in data visualization. Some rudimentary knowledge of JavaScript is required. Product Details Paperback: 194 pages Publisher: Packt Publishing (October 25, 2013) Language: English ISBN-10: 1782160000 ISBN-13: 978-1782160007 Product Dimensions: 9.2 x 7.5 x 0.4 inches
评论
添加红包

请填写红包祝福语或标题

红包个数最小为10个

红包金额最低5元

当前余额3.43前往充值 >
需支付:10.00
成就一亿技术人!
领取后你会自动成为博主和红包主的粉丝 规则
hope_wisdom
发出的红包
实付
使用余额支付
点击重新获取
扫码支付
钱包余额 0

抵扣说明:

1.余额是钱包充值的虚拟货币,按照1:1的比例进行支付金额的抵扣。
2.余额无法直接购买下载,可以购买VIP、付费专栏及课程。

余额充值