


第三章案例代码总结与修改分析
【有问题或错误,请私信我将及时改正;借鉴文章标明出处,谢谢】
每个案例代码全部为书中源代码,出现错误按照每个案例下面给出的代码错误,原因,及怎样修改进行修改即可解决每个案例错误
3-1
#-*- coding: utf-8 -*-
import pandas as pd
catering_sale = 'F:/大二下合集/Python数据分析与挖掘/catering_sale.xls' #餐饮数据
data = pd.read_excel(catering_sale, index_col = u'日期') #读取数据,指定“日期”列为索引列
import matplotlib.pyplot as plt #导入图像库
plt.rcParams['font.sans-serif'] = ['SimHei'] #用来正常显示中文标签
plt.rcParams['axes.unicode_minus'] = False #用来正常显示负号
plt.figure() #建立图像
p = data.boxplot() #画箱线图,直接使用DataFrame的方法
x = p['fliers'][0].get_xdata() # 'flies'即为异常值的标签
y = p['fliers'][0].get_ydata()
y.sort() #从小到大排序,该方法直接改变原对象
#用annotate添加注释
#其中有些相近的点,注解会出现重叠,难以看清,需要一些技巧来控制。
#以下参数都是经过调试的,需要具体问题具体调试。
for i in range(len(x)):
  if i>0:
    plt.annotate(y[i], xy = (x[i],y[i]), xytext=(x[i]+0.05 -0.8/(y[i]-y[i-1]),y[i]))
  else:
    plt.annotate(y[i], xy = (x[i],y[i]), xytext=(x[i]+0.08,y[i]))
plt.show() #展示箱线图
代码错误:
TypeError: 'AxesSubplot' object is not subscriptable
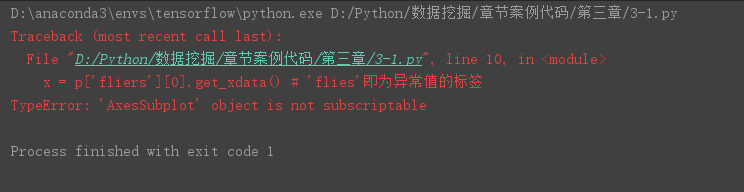
原因:
p=data.boxplot()
修改为:
p=data.boxplot(return_type='dict')
3-2
#-*- coding: utf-8 -*-
#餐饮销量数据统计量分析
from __future__ import print_function
import pandas as pd
catering_sale = 'F:/大二下合集/Python数据分析与挖掘/catering_sale.xls' #餐饮数据
data = pd.read_excel(catering_sale, index_col = u'日期') #读取数据,指定“日期”列为索引列
data = data[(data[u'销量'] > 400)&(data[u'销量'] < 5000)] #过滤异常数据
statistics = data.describe() #保存基本统计量
statistics.loc['range'] = statistics.loc['max']-statistics.loc['min'] #极差
statistics.loc['var'] = statistics.loc['std']/statistics.loc['mean'] #变异系数
statistics.loc['dis'] = statistics.loc['75%']-statistics.loc['25%'] #四分位数间距
print(statistics)
这个案例代码没问题
3-3
#-*- coding: utf-8 -*-
#菜品盈利数据 帕累托图
from __future__ import print_function
import pandas as pd
#初始化参数
dish_profit = 'F:/大二下合集/Python数据分析与挖掘/catering_dish_profit.xls' #餐饮菜品盈利数据
data = pd.read_excel(dish_profit, index_col = u'菜品名')
data = data[u'盈利'].copy()
data.sort(ascending = False)
import matplotlib.pyplot as plt #导入图像库
plt.rcParams['font.sans-serif'] = ['SimHei'] #用来正常显示中文标签
plt.rcParams['axes.unicode_minus'] = False #用来正常显示负号
plt.figure()
data.plot(kind='bar')
plt.ylabel(u'盈利(元)')
p = 1.0*data.cumsum()/data.sum()
p.plot(color = 'r', secondary_y = True, style = '-o',linewidth = 2)
plt.annotate(format(p[6], '.4%'), xy = (6, p[6]), xytext=(6*0.9, p[6]*0.9), arrowprops=dict(arrowstyle="->", connectionstyle="arc3,rad=.2")) #添加注释,即85%处的标记。这里包括了指定箭头样式。
plt.ylabel(u'盈利(比例)')
plt.show()
代码错误:
AttributeError: 'Series' object has no attribute 'sort'

原因:
data.sort(ascending = False)
修改为:
data.sort_values(ascending = False)
3-4
#-*- coding: utf-8 -*-
#餐饮销量数据相关性分析
from __future__ import print_function
import pandas as pd
catering_sale = 'F:/大二下合集/Python数据分析与挖掘/catering_sale_all.xls' #餐饮数据,含有其他属性
data = pd.read_excel(catering_sale, index_col = u'日期') #读取数据,指定“日期”列为索引列
data.corr() #相关系数矩阵,即给出了任意两款菜式之间的相关系数
data.corr()[u'百合酱蒸凤爪'] #只显示“百合酱蒸凤爪”与其他菜式的相关系数
data[u'百合酱蒸凤爪'].corr(data[u'翡翠蒸香茜饺']) #计算“百合酱蒸凤爪”与“翡翠蒸香茜饺”的相关系数
代码错误:
没有报错,但是在idea中运行没有结果
原因:
data.corr() #相关系数矩阵,即给出了任意两款菜式之间的相关系数
data.corr()[u'百合酱蒸凤爪'] #只显示“百合酱蒸凤爪”与其他菜式的相关系数
data[u'百合酱蒸凤爪'].corr(data[u'翡翠蒸香茜饺']) #计算“百合酱蒸凤爪”与“翡翠蒸香茜饺”的相关系数
修改为:(即添加print)
print(data.corr()) #相关系数矩阵,即给出了任意两款菜式之间的相关系数
print(data.corr()[u'百合酱蒸凤爪']) #只显示“百合酱蒸凤爪”与其他菜式的相关系数
print(data[u'百合酱蒸凤爪'].corr(data[u'翡翠蒸香茜饺'])) #计算“百合酱蒸凤爪”与“翡翠蒸香茜饺”的相关系数
3-5(是3.3节的各个实例)
import numpy as np
import pandas as pd
print("-----1.corr---------")
D = pd.DataFrame([range(1, 8), range(2, 9)])
print(D.corr(method='pearson'))
S1 = D.loc[0]
S2 = D.loc[1]
print(S1.corr(S2, method='pearson'))
print("----2.cov----------")
D = pd.DataFrame(np.random.randn(6, 5))
print(D.cov())
print(D[0].cov(D[1]))
print("----3.skew/kurt----------")
D = pd.DataFrame(np.random.randn(6, 5))
print(D.skew())
print("----4.describe----------")
D = pd.DataFrame(np.random.randn(6, 5))
print(D.describe())
print("----拓展统计特征函数1.1----------")
D=pd.Series(range(0, 10))
print(D.cumsum())
print("----拓展统计特征函数1.2----")
pd.rolling_sum(D, 2)
print("----统计作图函数1.1(作图之前步骤)----------")
import matplotlib.pyplot as  plt #导入作图库
plt.rcParams['font.sans-serif'] = ['SimHei'] #用来正常显示中文标签
plt.rcParams['axes.unicode_minus'] = False #用来正常显示负号
plt.figure(figsize = (7, 5)) #创建图像区域,指定比例
plt.show()
print("----统计作图函数1.2(plot示例)----------")
x = np.linspace(0,2*np.pi,50) #x坐标输入
y = np.sin(x) #计算对应x的正弦值
plt.plot(x, y, 'bp--') #控制图形格式为蓝色带星虚线,显示正弦曲线
plt.show()
print("----统计作图函数1.3(pie示例)----------")
labels = 'Frogs', 'Hogs', 'Dogs', 'Logs' #定义标签
sizes = [15, 30, 45, 10] #每一块的比例
colors = ['yellowgreen', 'gold', 'lightskyblue', 'lightcoral'] #每一块的颜色
explode = (0, 0.1, 0, 0) #突出显示,这里仅仅突出显示第二块(即'Hogs')
plt.pie(sizes, explode=explode, labels=labels, colors=colors, autopct='%1.1f%%', shadow=True, startangle=90)
plt.axis('equal') #显示为圆(避免比例压缩为椭圆)
plt.show()
print("----统计作图函数1.4(hist示例)----------")
x = np.random.randn(1000) #1000个服从正态分布的随机数
plt.hist(x, 10) #分成10组进行绘制直方图
plt.show()
print("----统计作图函数1.5(boxplot示例)----------")
x = np.random.randn(1000) #1000个服从正态分布的随机数
D = pd.DataFrame([x, x+1]).T #构造两列的DataFrame
D.plot(kind = 'box') #调用Series内置的作图方法画图,用kind参数指定箱形图box
plt.show()
print("----统计作图函数1.6(plot(logx=True)/plot(logy=True)示例,改数字)----------")
plt.rcParams['font.sans-serif'] = ['SimHei'] #用来正常显示中文标签
plt.rcParams['axes.unicode_minus'] = False #用来正常显示负号
x = pd.Series(np.exp(np.arange(10))) #原始数据
x.plot(label = u'原始数据图', legend = True)
plt.show()
x.plot(logy = True, label = u'对数数据图', legend = True)
plt.show()
print("----统计作图函数1.7(plot(yerr = error))示例,改数字)----------")
error = np.random.randn(10) #定义误差列
y = pd.Series(np.sin(np.arange(10))) #均值数据列
y.plot(yerr = error) #绘制误差图
plt.show()
代码错误:
拓展统计特征函数1.2(即第二个例子),没有rolling_sum标红运行至此行就停止运行
原因:
书中依次对相邻两项求和代码例子代码为:pd.rolling_sum(D,2)
修改为:
D=D.rolling(2).sum()
并且要想输出得加:print(D)
【有问题或错误,请私信我将及时改正;借鉴文章标明出处,谢谢】


 1450
1450


 被折叠的 条评论
为什么被折叠?
被折叠的 条评论
为什么被折叠?
 到【灌水乐园】发言


