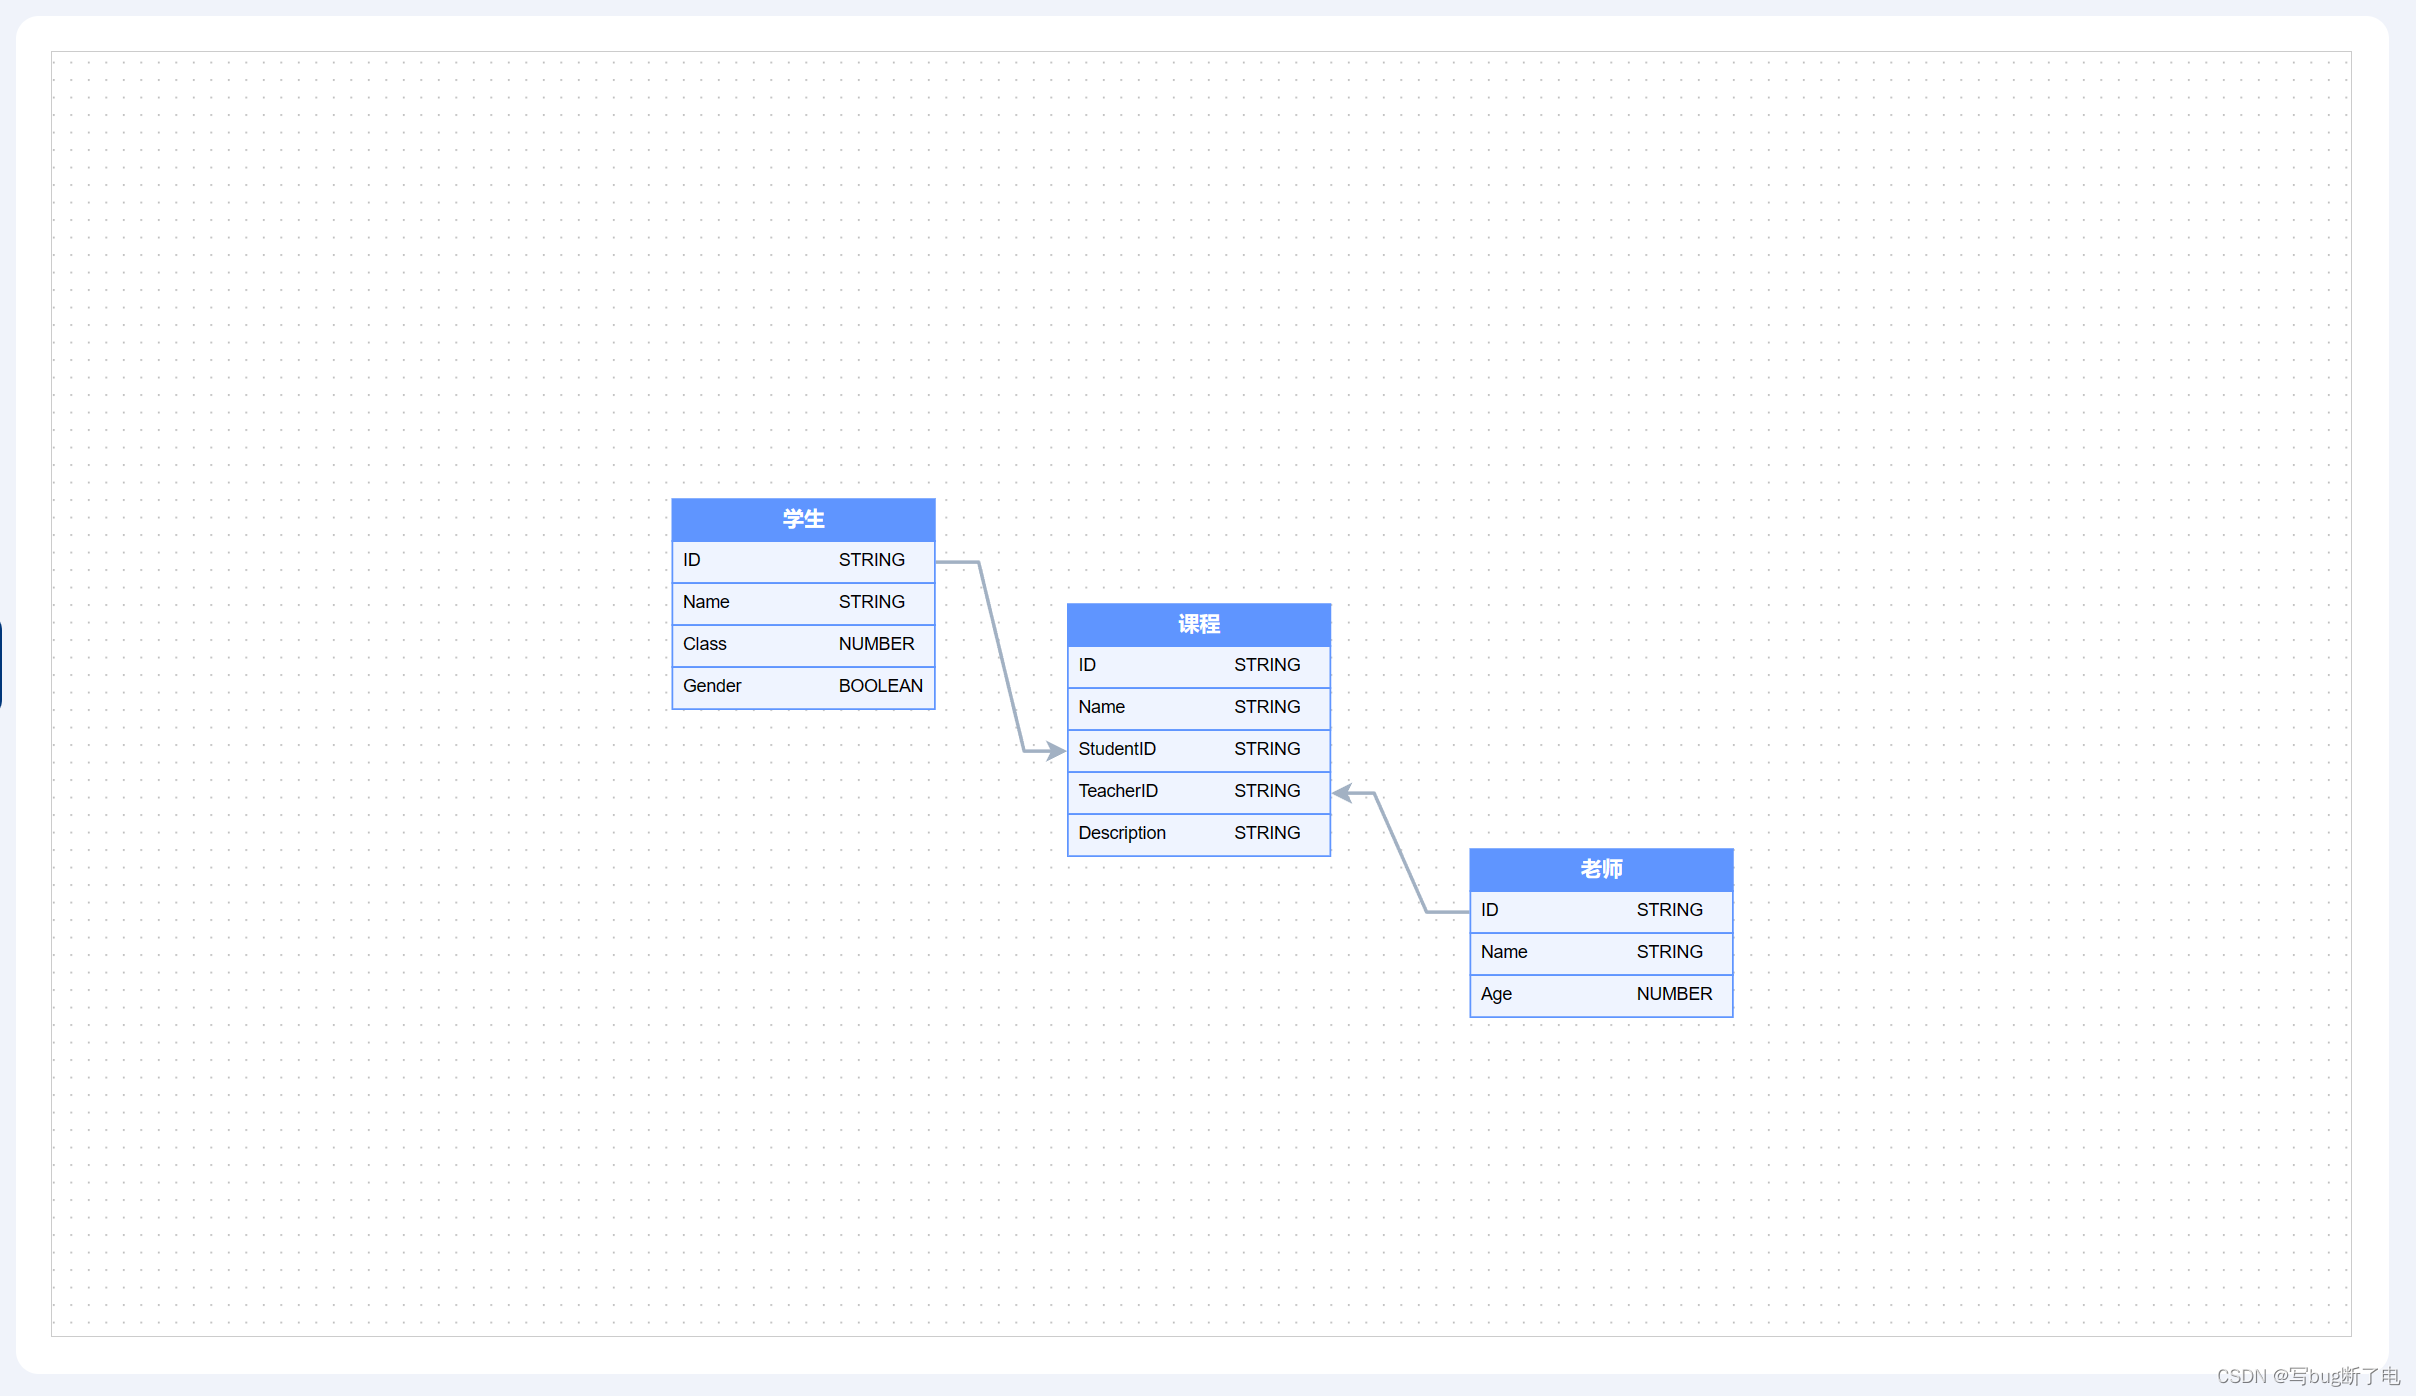
vue2+antv/x6实现er图

效果图

 安装依赖 

npm install @antv/x6 --save

我目前的项目安装的版本是@antv/x6 2.18.1

人狠话不多,直接上代码

<template>
  <div class="er-graph-container">
    <!-- 画布容器 -->
    <div ref="graphContainerRef" id="graphContainer"></div>
  </div>
</template>

<script>
import { Graph, Shape } from "@antv/x6";

const LINE_HEIGHT = 24;
const NODE_WIDTH = 150;

export default {
  name: "X6GraphComponent",
  data() {
    return {
      graph: null,
      // 画布数据
      graphData: [
        {
          id: "1",
          shape: "er-rect",
          label: "学生",
          width: 150,
          height: 24,
          position: {
            x: 24,
            y: 150,
          },
          ports: [
            {
              id: "1-1",
              group: "list",
              attrs: {
                portNameLabel: {
                  text: "ID",
                },
                portTypeLabel: {
                  text: "STRING",
                },
              },
            },
            {
              id: "1-2",
              group: "list",
              attrs: {
                portNameLabel: {
                  text: "Name",
                },
                portTypeLabel: {
                  text: "STRING",
                },
              },
            },
            {
              id: "1-3",
              group: "list",
              attrs: {
                portNameLabel: {
                  text: "Class",
                },
                portTypeLabel: {
                  text: "NUMBER",
                },
              },
            },
            {
              id: "1-4",
              group: "list",
              attrs: {
                portNameLabel: {
                  text: "Gender",
                },
                portTypeLabel: {
                  text: "BOOLEAN",
                },
              },
            },
          ],
        },
        {
          id: "2",
          shape: "er-rect",
          label: "课程",
          width: 150,
          height: 24,
          position: {
            x: 250,
            y: 210,
          },
          ports: [
            {
              id: "2-1",
              group: "list",
              attrs: {
                portNameLabel: {
                  text: "ID",
                },
                portTypeLabel: {
                  text: "STRING",
                },
              },
            },
            {
              id: "2-2",
              group: "list",
              attrs: {
                portNameLabel: {
                  text: "Name",
                },
                portTypeLabel: {
                  text: "STRING",
                },
              },
            },
            {
              id: "2-3",
              group: "list",
              attrs: {
                portNameLabel: {
                  text: "StudentID",
                },
                portTypeLabel: {
                  text: "STRING",
                },
              },
            },
            {
              id: "2-4",
              group: "list",
              attrs: {
                portNameLabel: {
                  text: "TeacherID",
                },
                portTypeLabel: {
                  text: "STRING",
                },
              },
            },
            {
              id: "2-5",
              group: "list",
              attrs: {
                portNameLabel: {
                  text: "Description",
                },
                portTypeLabel: {
                  text: "STRING",
                },
              },
            },
          ],
        },
        {
          id: "3",
          shape: "er-rect",
          label: "老师",
          width: 150,
          height: 24,
          position: {
            x: 480,
            y: 350,
          },
          ports: [
            {
              id: "3-1",
              group: "list",
              attrs: {
                portNameLabel: {
                  text: "ID",
                },
                portTypeLabel: {
                  text: "STRING",
                },
              },
            },
            {
              id: "3-2",
              group: "list",
              attrs: {
                portNameLabel: {
                  text: "Name",
                },
                portTypeLabel: {
                  text: "STRING",
                },
              },
            },
            {
              id: "3-3",
              group: "list",
              attrs: {
                portNameLabel: {
                  text: "Age",
                },
                portTypeLabel: {
                  text: "NUMBER",
                },
              },
            },
          ],
        },
        {
          id: "4",
          shape: "edge",
          source: {
            cell: "1",
            port: "1-1",
          },
          target: {
            cell: "2",
            port: "2-3",
          },
          attrs: {
            line: {
              stroke: "#A2B1C3",
              strokeWidth: 2,
            },
          },
          zIndex: 0,
        },
        {
          id: "5",
          shape: "edge",
          source: {
            cell: "3",
            port: "3-1",
          },
          target: {
            cell: "2",
            port: "2-4",
          },
          attrs: {
            line: {
              stroke: "#A2B1C3",
              strokeWidth: 2,
            },
          },
          zIndex: 0,
        },
      ],
    };
  },
  mounted() {
    this.initGraph();
  },
  methods: {
    initGraph() {
      Graph.registerPortLayout(
        "erPortPosition",
        (portsPositionArgs) => {
          return portsPositionArgs.map((_, index) => {
            return {
              position: {
                x: 0,
                y: (index + 1) * LINE_HEIGHT,
              },
              angle: 0,
            };
          });
        },
        true
      );

      Graph.registerNode(
        "er-rect",
        {
          inherit: "rect",
          markup: [
            {
              tagName: "rect",
              selector: "body",
            },
            {
              tagName: "text",
              selector: "label",
            },
          ],
          attrs: {
            rect: {
              strokeWidth: 1,
              stroke: "#5F95FF",
              fill: "#5F95FF",
            },
            label: {
              fontWeight: "bold",
              fill: "#ffffff",
              fontSize: 12,
            },
          },
          ports: {
            groups: {
              list: {
                markup: [
                  {
                    tagName: "rect",
                    selector: "portBody",
                  },
                  {
                    tagName: "text",
                    selector: "portNameLabel",
                  },
                  {
                    tagName: "text",
                    selector: "portTypeLabel",
                  },
                ],
                attrs: {
                  portBody: {
                    width: NODE_WIDTH,
                    height: LINE_HEIGHT,
                    strokeWidth: 1,
                    stroke: "#5F95FF",
                    fill: "#EFF4FF",
                    magnet: true,
                  },
                  portNameLabel: {
                    ref: "portBody",
                    refX: 6,
                    refY: 6,
                    fontSize: 10,
                  },
                  portTypeLabel: {
                    ref: "portBody",
                    refX: 95,
                    refY: 6,
                    fontSize: 10,
                  },
                },
                position: "erPortPosition",
              },
            },
          },
        },
        true
      );

      this.graph = new Graph({
        container: this.$refs.graphContainerRef,
        grid: true,
        connecting: {
          router: {
            name: "er",
            args: {
              offset: 25,
              direction: "H",
            },
          },
          createEdge() {
            return new Shape.Edge({
              attrs: {
                line: {
                  stroke: "#A2B1C3",
                  strokeWidth: 2,
                },
              },
            });
          },
        },
      });

      let cells = [];
      this.graphData.forEach((item) => {
        if (item.shape === "edge") {
          cells.push(this.graph.createEdge(item));
        } else {
          cells.push(this.graph.createNode(item));
        }
      });
      this.graph.resetCells(cells);
      this.graph.zoomToFit({ padding: 10, maxScale: 1 });
    },
  },
  beforeDestroy() {
    this.graph && this.graph.dispose();
  },
};
</script>

<style>
/* 确保图表可以在容器内正确显示 */
.er-graph-container {
  min-width: 300px;
  min-height: 200px;
}
.er-graph-container,
#graphContainer {
  width: 100%;
  height: 100%;
}
</style>

 O了

  • 2
    点赞
  • 1
    收藏
    觉得还不错? 一键收藏
  • 打赏
    打赏
  • 0
    评论
Vue 3是Vue.js的最新版本,它具有更好的性能、更好的TypeScript支持、更好的开发者体验等特点。Vite是一个轻量级的Web应用程序构建工具,它可以快速地构建Vue项目,同时支持TypeScript。AntV X6是一个强大的形可视化库,它可以帮助开发人员快速地创建各种类型的表和流程。 下面是一个使用Vue 3、Vite、TypeScript和AntV X6的自定义节点元素案例代码: ``` <template> <div class="app"> <x6-graph :graph="graph" :width="800" :height="600"> <template #default="{ node }"> <x6-rect v-if="node.data.type === 'rect'" :node="node" :width="node.getSize().width" :height="node.getSize().height" :fill="node.getStyle().fillColor" :stroke="node.getStyle().strokeColor" /> <x6-circle v-else-if="node.data.type === 'circle'" :node="node" :r="node.getSize().width / 2" :fill="node.getStyle().fillColor" :stroke="node.getStyle().strokeColor" /> </template> </x6-graph> </div> </template> <script lang="ts"> import { defineComponent, ref } from 'vue' import { Graph, Node, Rect, Circle } from '@antv/x6' import { useUndoRedo } from '@antv/x6-vue' export default defineComponent({ setup() { const graph = ref<Graph>() useUndoRedo({ graph }) const nodes = [ { type: 'rect', x: 100, y: 100, width: 100, height: 50, style: { fillColor: '#ffffff', strokeColor: '#000000', }, }, { type: 'circle', x: 300, y: 100, width: 100, height: 100, style: { fillColor: '#ffffff', strokeColor: '#000000', }, }, ] graph.value = new Graph({ container: document.querySelector('.app')!, }) nodes.forEach((node) => { const shape = node.type === 'rect' ? Rect : Circle const newNode = new Node({ x: node.x, y: node.y, width: node.width, height: node.height, shape, data: node, }) newNode.setStyle(node.style) graph.value.addNode(newNode) }) return { graph } }, }) </script> ``` 此代码演示了如何在Vue 3项目中使用AntV X6创建自定义节点元素。在这个示例中,我们创建了两个不同类型的节点:一个矩形和一个圆形。我们通过给每个节点添加一个"type"属性来区分它们的类型。然后,我们在Vue模板中使用了`x6-rect`和`x6-circle`组件来渲染节点元素,这些组件分别对应于`Rect`和`Circle`节点形状。

“相关推荐”对你有帮助么?

  • 非常没帮助
  • 没帮助
  • 一般
  • 有帮助
  • 非常有帮助
提交
评论
添加红包

请填写红包祝福语或标题

红包个数最小为10个

红包金额最低5元

当前余额3.43前往充值 >
需支付:10.00
成就一亿技术人!
领取后你会自动成为博主和红包主的粉丝 规则
hope_wisdom
发出的红包

打赏作者

写bug断了电

你的鼓励将是我创作的最大动力

¥1 ¥2 ¥4 ¥6 ¥10 ¥20
扫码支付:¥1
获取中
扫码支付

您的余额不足,请更换扫码支付或充值

打赏作者

实付
使用余额支付
点击重新获取
扫码支付
钱包余额 0

抵扣说明:

1.余额是钱包充值的虚拟货币,按照1:1的比例进行支付金额的抵扣。
2.余额无法直接购买下载,可以购买VIP、付费专栏及课程。

余额充值