


| IP | 安装软件 |
| 192.168.50.128 | Prometheus、grafana 、alertmanager |
| 192.168.50.191 | node_exporter |
一、前景准备
# 关闭防火墙和内核安全机制
[root@localhost ~]# systemctl stop firewalld
[root@localhost ~]# systemctl disable firewalld
[root@localhost ~]# setenforce 0
[root@localhost ~]# sed -i 's/enforcing/disabled/' /etc/selinux/config

# 创建工作目录
[root@localhost ~]# mkdir /opt/server
[root@localhost ~]# cd /opt/server/
[root@localhost server]# mkdir target

# 远程下载软件包
# prometheus
[root@localhost server]# wget https://github.com/prometheus/prometheus/releases/download/v2.42.0/prometheus-2.42.0.linux-amd64.tar.gz
# grafana
[root@localhost server]# wget wget https://dl.grafana.com/oss/release/grafana-5.4.3.linux-amd64.tar.gz
# alertmanager
[root@localhost server]# wget https://github.com/prometheus/alertmanager/releases/download/v0.25.0/alertmanager-0.25.0.linux-amd64.tar.gz
# prometheus-webhook-dingtalk
[root@localhost server]# wget https://github.com/timonwong/prometheus-webhook-dingtalk/releases/download/v2.1.0/prometheus-webhook-dingtalk-2.1.0.linux-amd64.tar.gz

#查看
[root@localhost server]# ls
alertmanager-0.25.0.linux-amd64.tar.gz  prometheus-webhook-dingtalk-2.1.0.linux-amd64.tar.gz
grafana-9.4.3.linux-amd64.tar.gz        prometheus-2.42.0.linux-amd64.tar.gz  target

# 解压缩
[root@localhost server]# tar zxf prometheus-2.42.0.linux-amd64.tar.gz
[root@localhost server]# tar zxf grafana-9.4.3.linux-amd64.tar.gz
[root@localhost server]# tar zxf alertmanager-0.25.0.linux-amd64.tar.gz
[root@localhost server]# tar zxf prometheus-webhook-dingtalk-2.1.0.linux-amd64.tar.gz

# 查看
[root@localhost server]# mv prometheus-2.42.0.linux-amd64.tar.gz grafana-9.4.3.linux-amd64.tar.gz alertmanager-0.25.0.linux-amd64.tar.gz prometheus-webhook-dingtalk-2.1.0.linux-amd64.tar.gz target/
[root@localhost server]# ls
alertmanager-0.25.0.linux-amd64  grafana-9.4.3  prometheus-2.42.0.linux-amd64  prometheus-webhook-dingtalk-2.1.0.linux-amd64  target
二、Prometheus
# 后台启动prometheus
[root@localhost server]# cd prometheus-2.42.0.linux-amd64/
[root@localhost prometheus-2.42.0.linux-amd64]# ls
console_libraries  consoles  LICENSE  NOTICE  prometheus  prometheus.yml  promtool
[root@localhost prometheus-2.42.0.linux-amd64]# nohup ./prometheus &

# 查看端口
[root@localhost prometheus-2.42.0.linux-amd64]# netstat -tnpl | grep 9090
tcp6       0      0 :::9090                 :::*                    LISTEN      9559/./prometheus

# prometheus server是可以获取到本机数据的,可用以下命令查看
[root@localhost prometheus-2.42.0.linux-amd64]# curl localhost:9090/metrics

# Web页面
http://192.168.20.135:9090/targets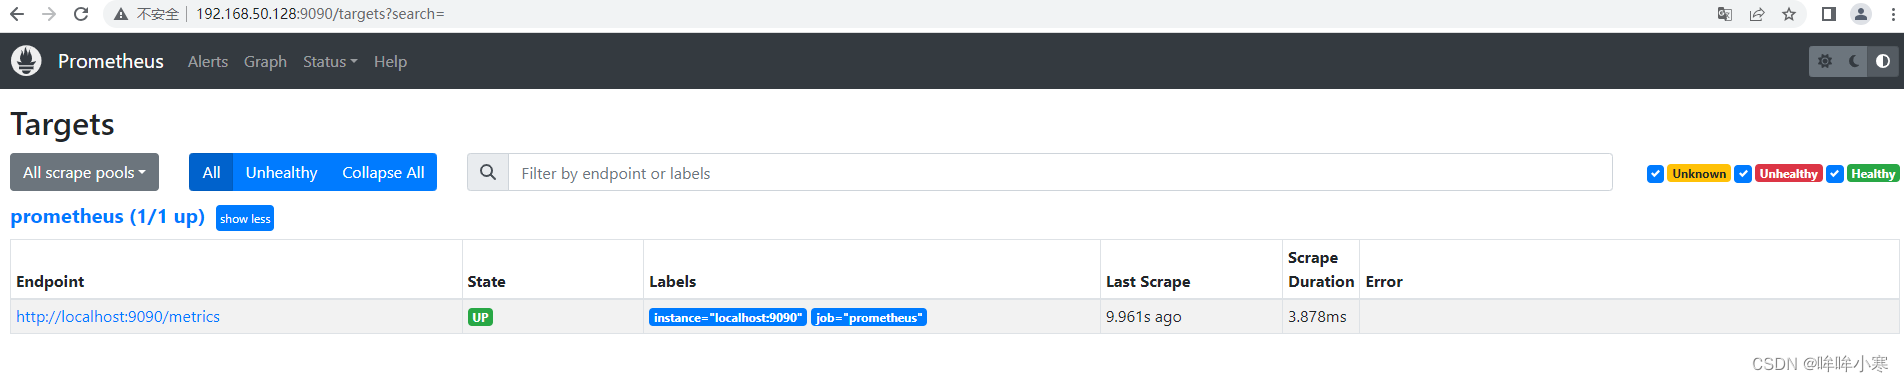
三、安装node_exporter
# node_exporter我安装在192.168.50.191上,你也可以安装在server上,采集server数据。
# 远程下载软件包
[root@localhost2 ~]# wget https://github.com/prometheus/node_exporter/releases/download/v0.16.0-rc.3/node_exporter-0.16.0-rc.3.linux-amd64.tar.gz

# 解压并启动服务
[root@localhost2 ~]# tar zxf node_exporter-1.6.0.linux-amd64.tar.gz
[root@localhost2 ~]# cd node_exporter-1.6.0.linux-amd64
[root@localhost2 node_exporter-1.6.0.linux-amd64]# nohup node_exporter &

# 查看端口
[root@localhost2 node_exporter-1.6.0.linux-amd64]# netstat -tnpl | grep 9100
tcp6       0      0 :::9100                 :::*                    LISTEN      8995/./node_exporte

# 查看各项监控指标是否有数据了:
[root@localhost2 node_exporter-1.6.0.linux-amd64]# curl localhost:9100/metrics

# Web页面访问
http://192.168.50.191:9100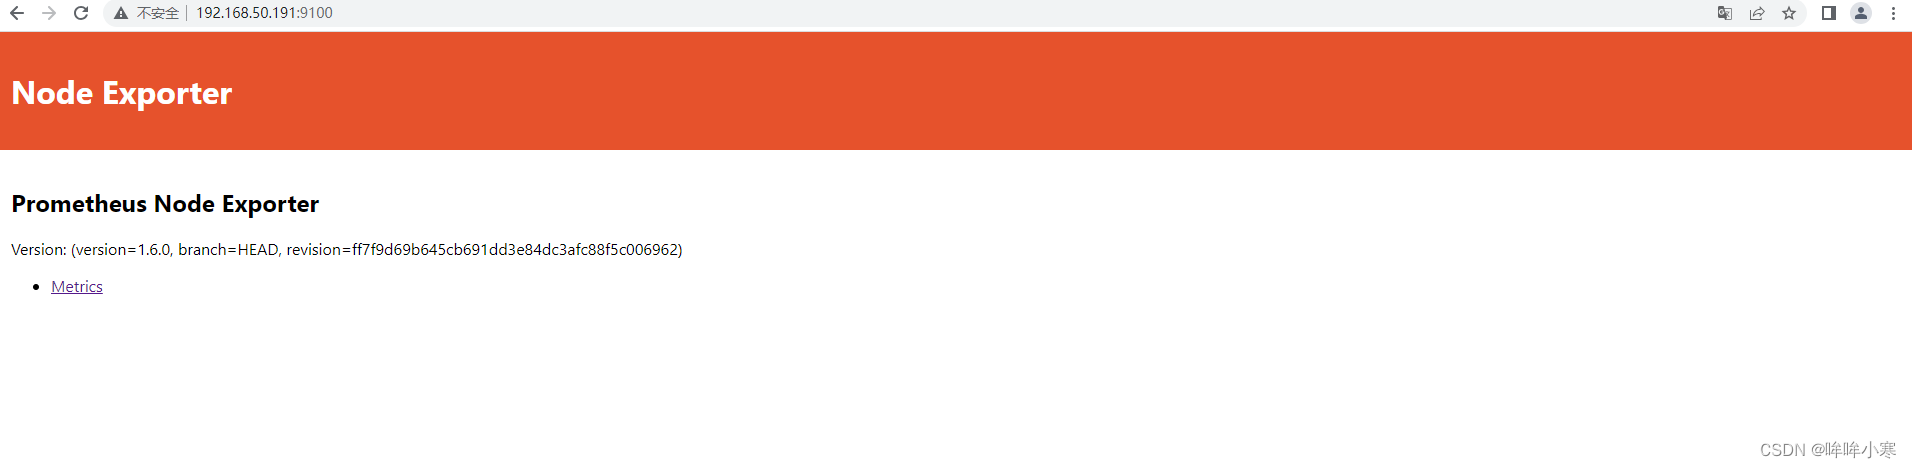
# 在50.128端prometheus.yml末尾添加job,添加最后9行
[root@localhost prometheus-2.42.0.linux-amd64]# vim prometheus.yml
    static_configs:
      - targets: ["localhost:9090"]

  - job_name: 'export_node1'
    static_configs:
      - targets: ['192.168.50.128:9100',
                  '192.168.50.138:9100'
                  ]
    metric_relabel_configs:
      - source_labels: [__name__]
        regex: 'your_warning_alert_name'
        action: drop


# 重启prometheus
[root@localhost prometheus-2.42.0.linux-amd64]# kill 9559
[root@localhost prometheus-2.42.0.linux-amd64]# nohup ./prometheus &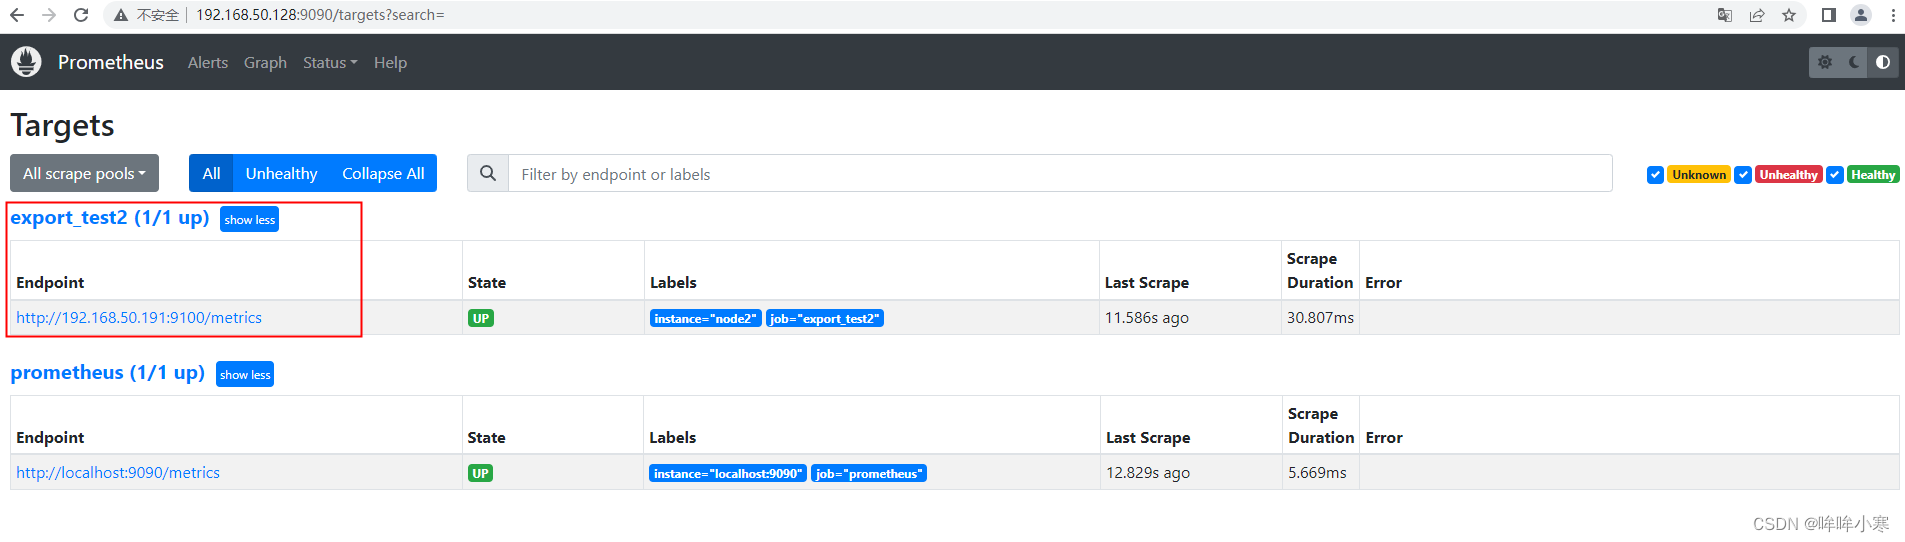
四、安装Grafana
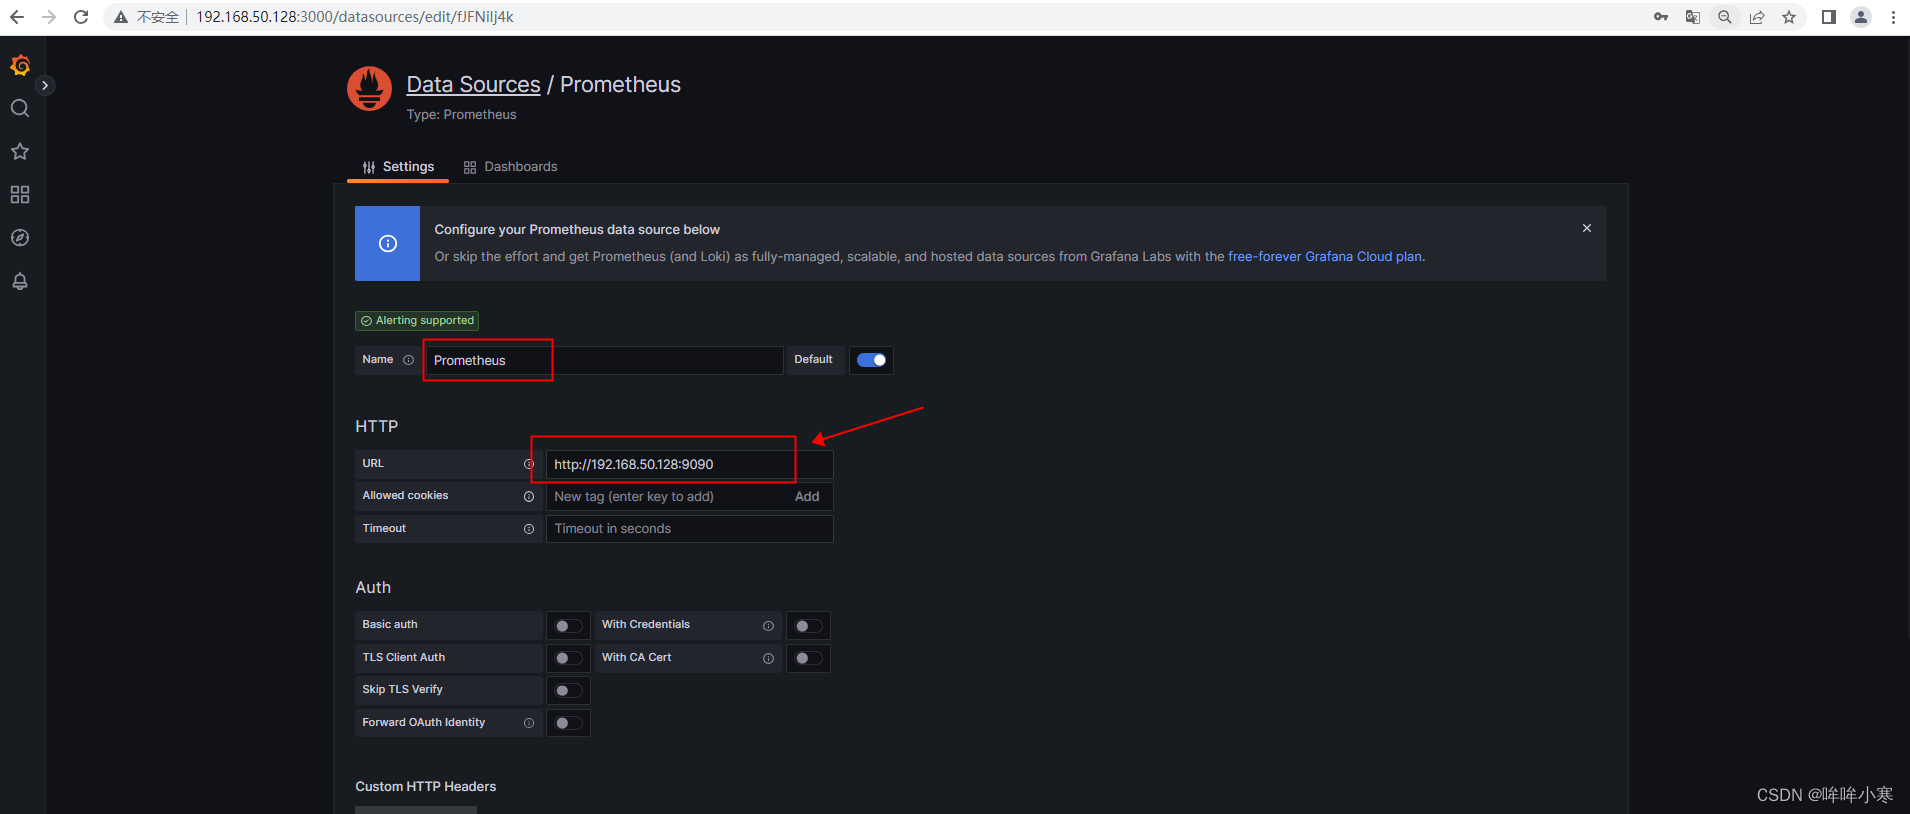
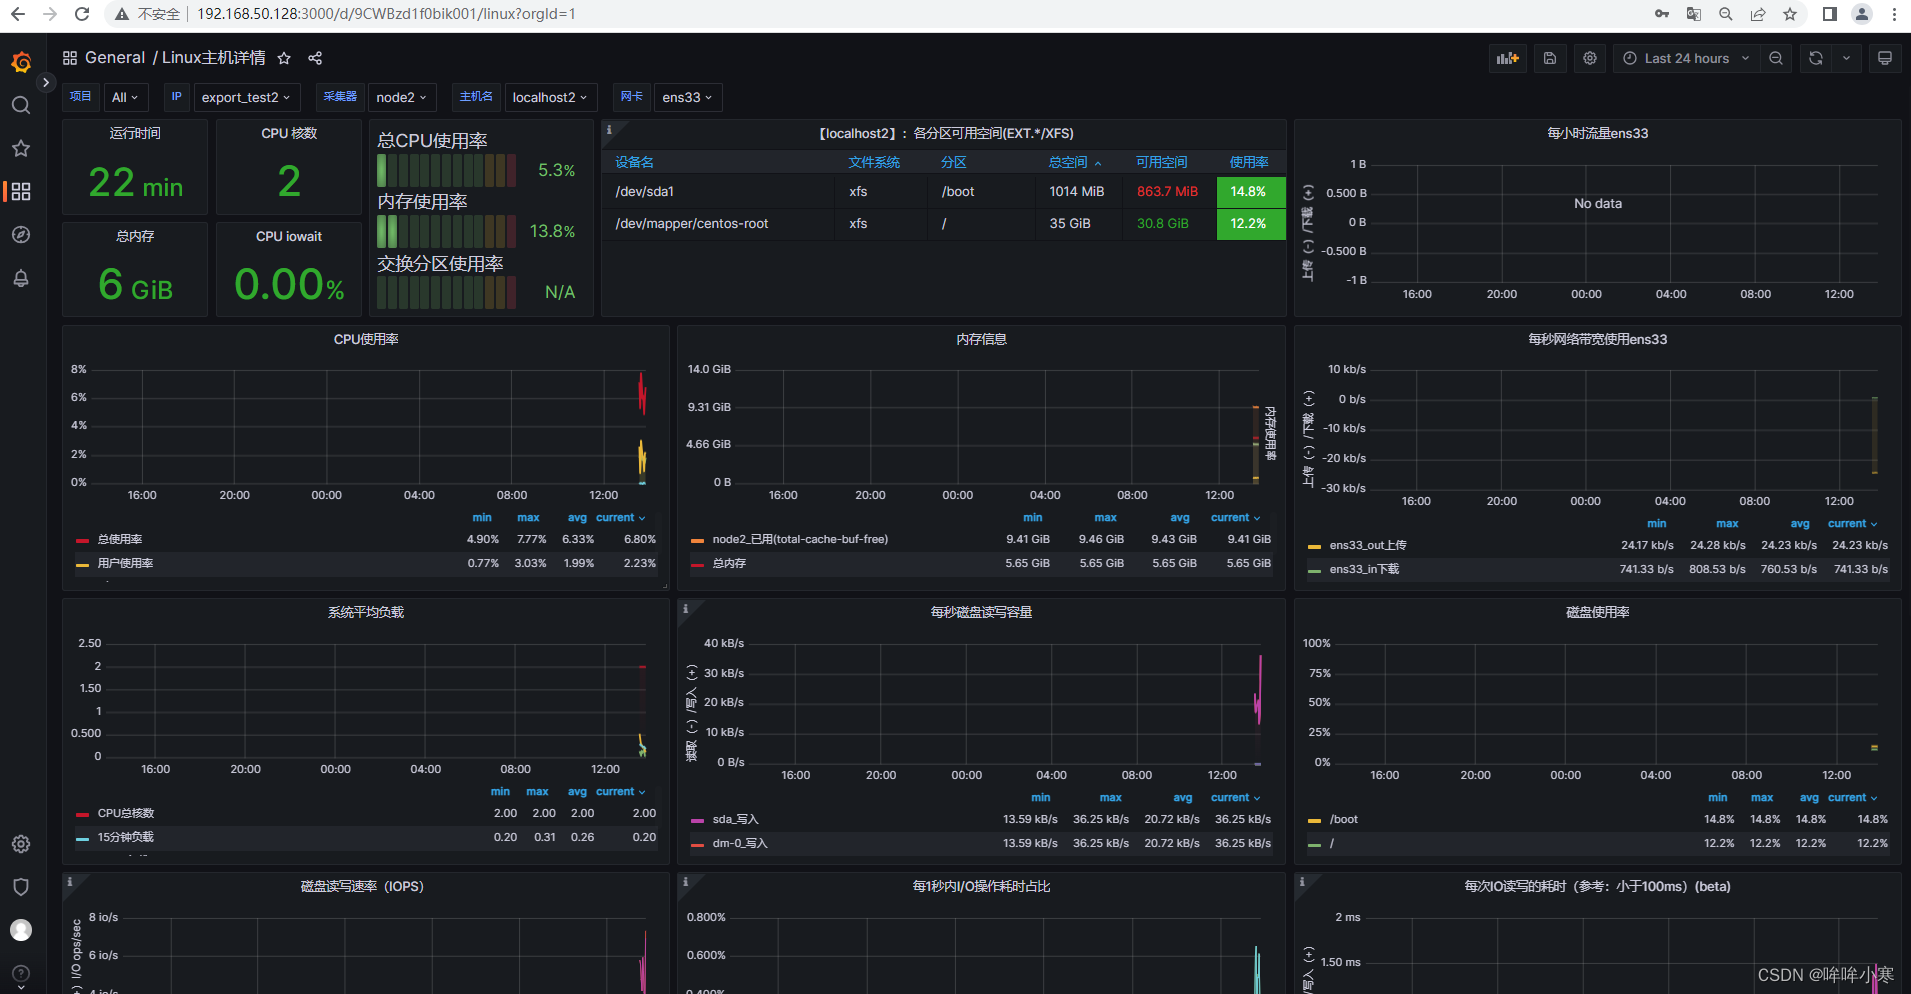
# grafana与prometheus进行对接,可以对数据进行更好的展示
[root@localhost server]# cd /opt/server/grafana-9.4.3/
[root@localhost grafana-9.4.3]# nohup ./bin/grafana-server &
# 查看
[root@localhost grafana-9.4.3]# netstat -tnpl | grep 3000
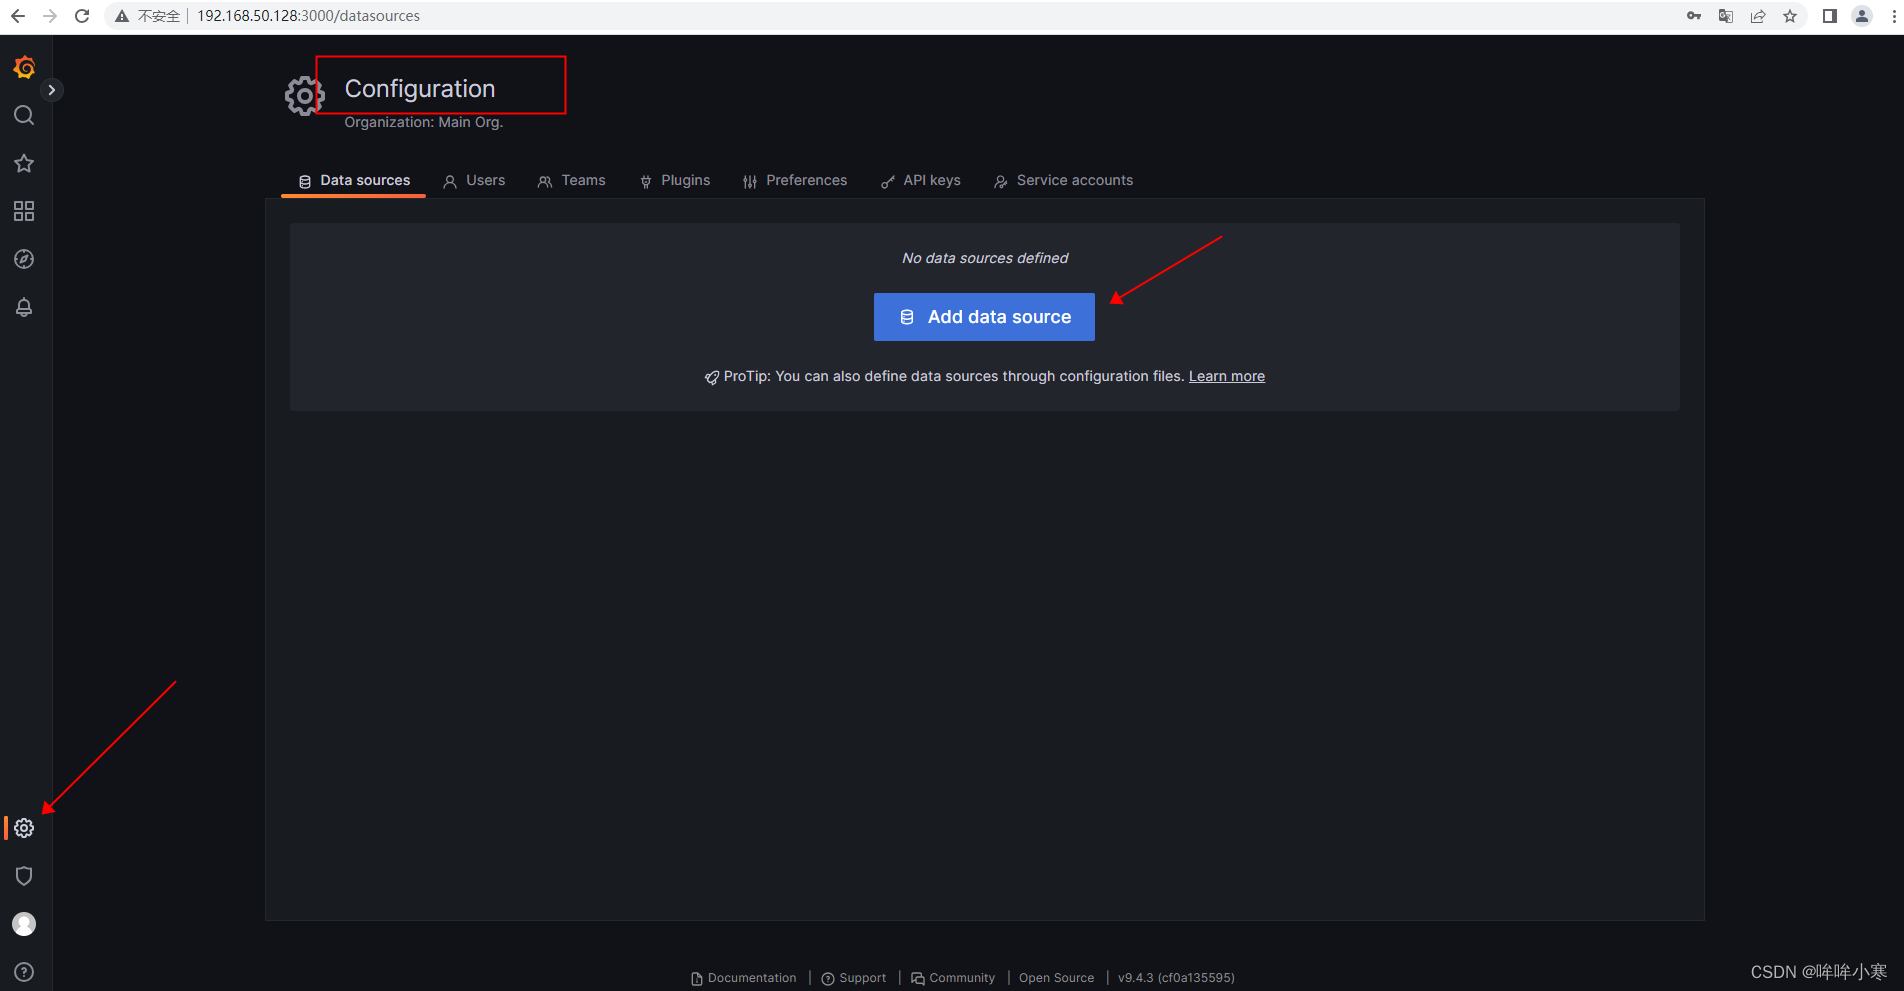
# 登录grafana的web页面
http://192.168.50.128:3000/
账号密码:admin/admin 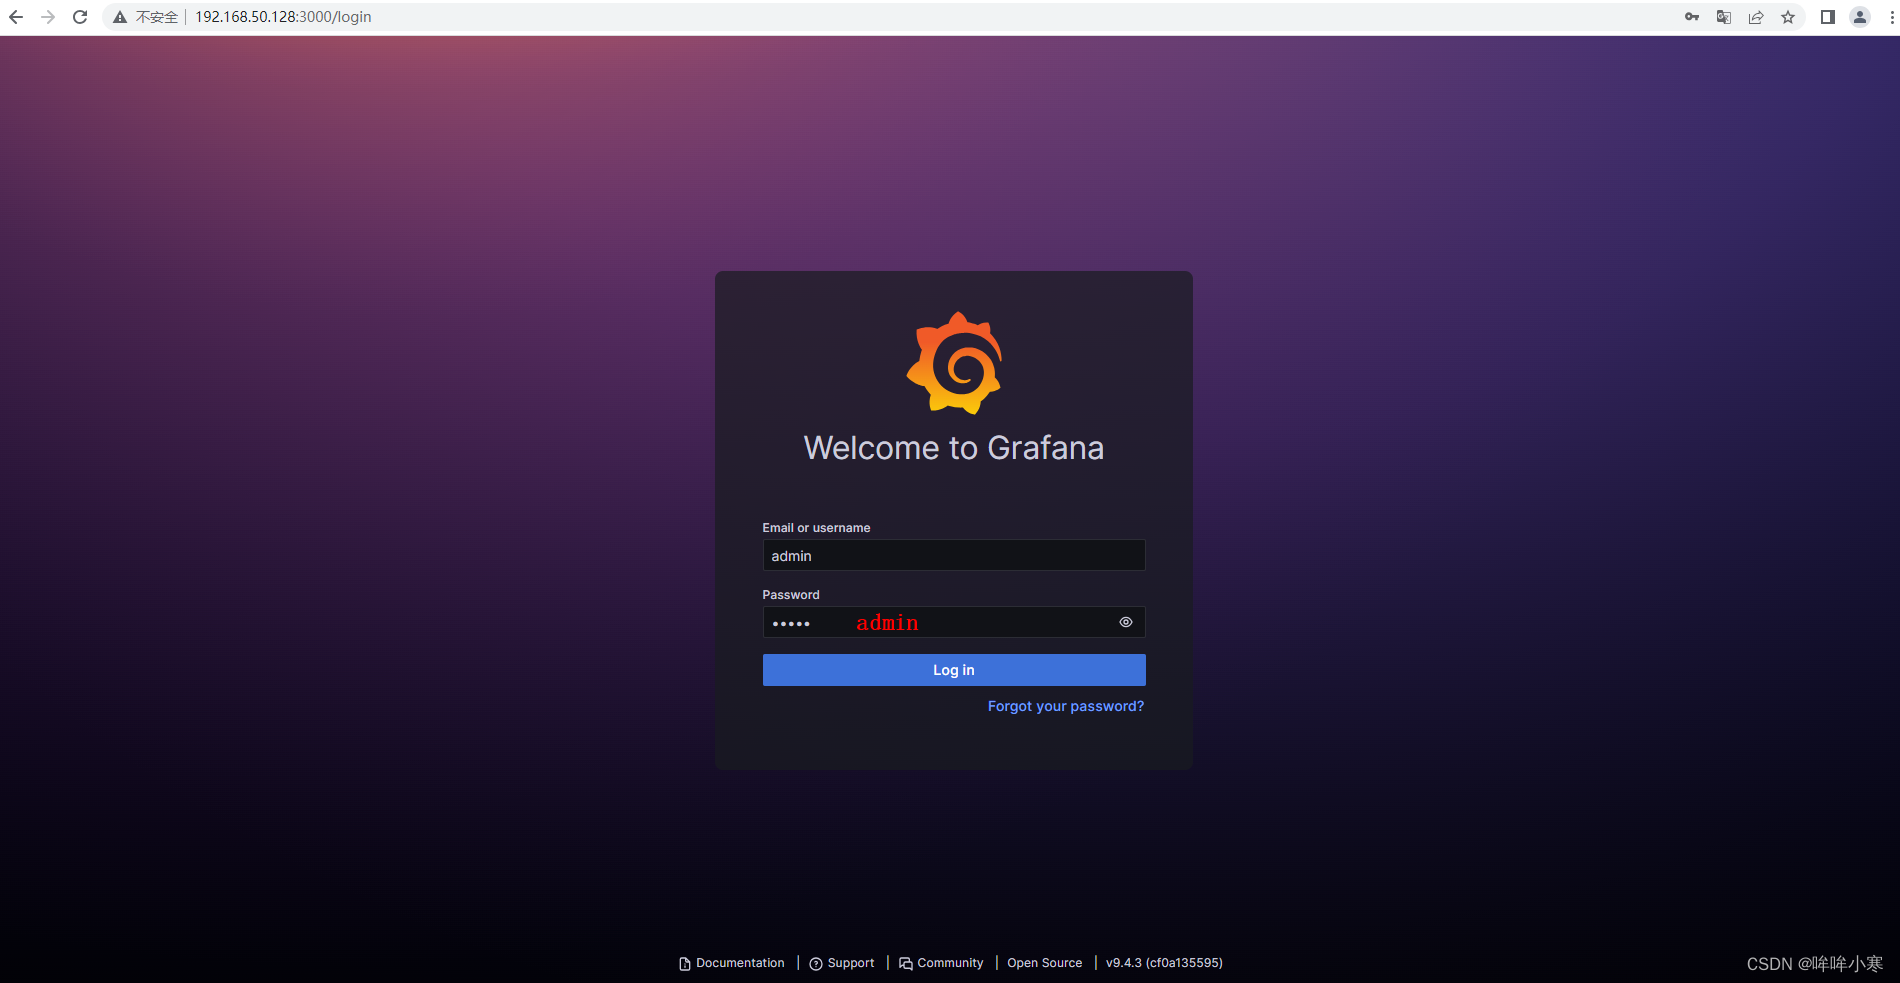
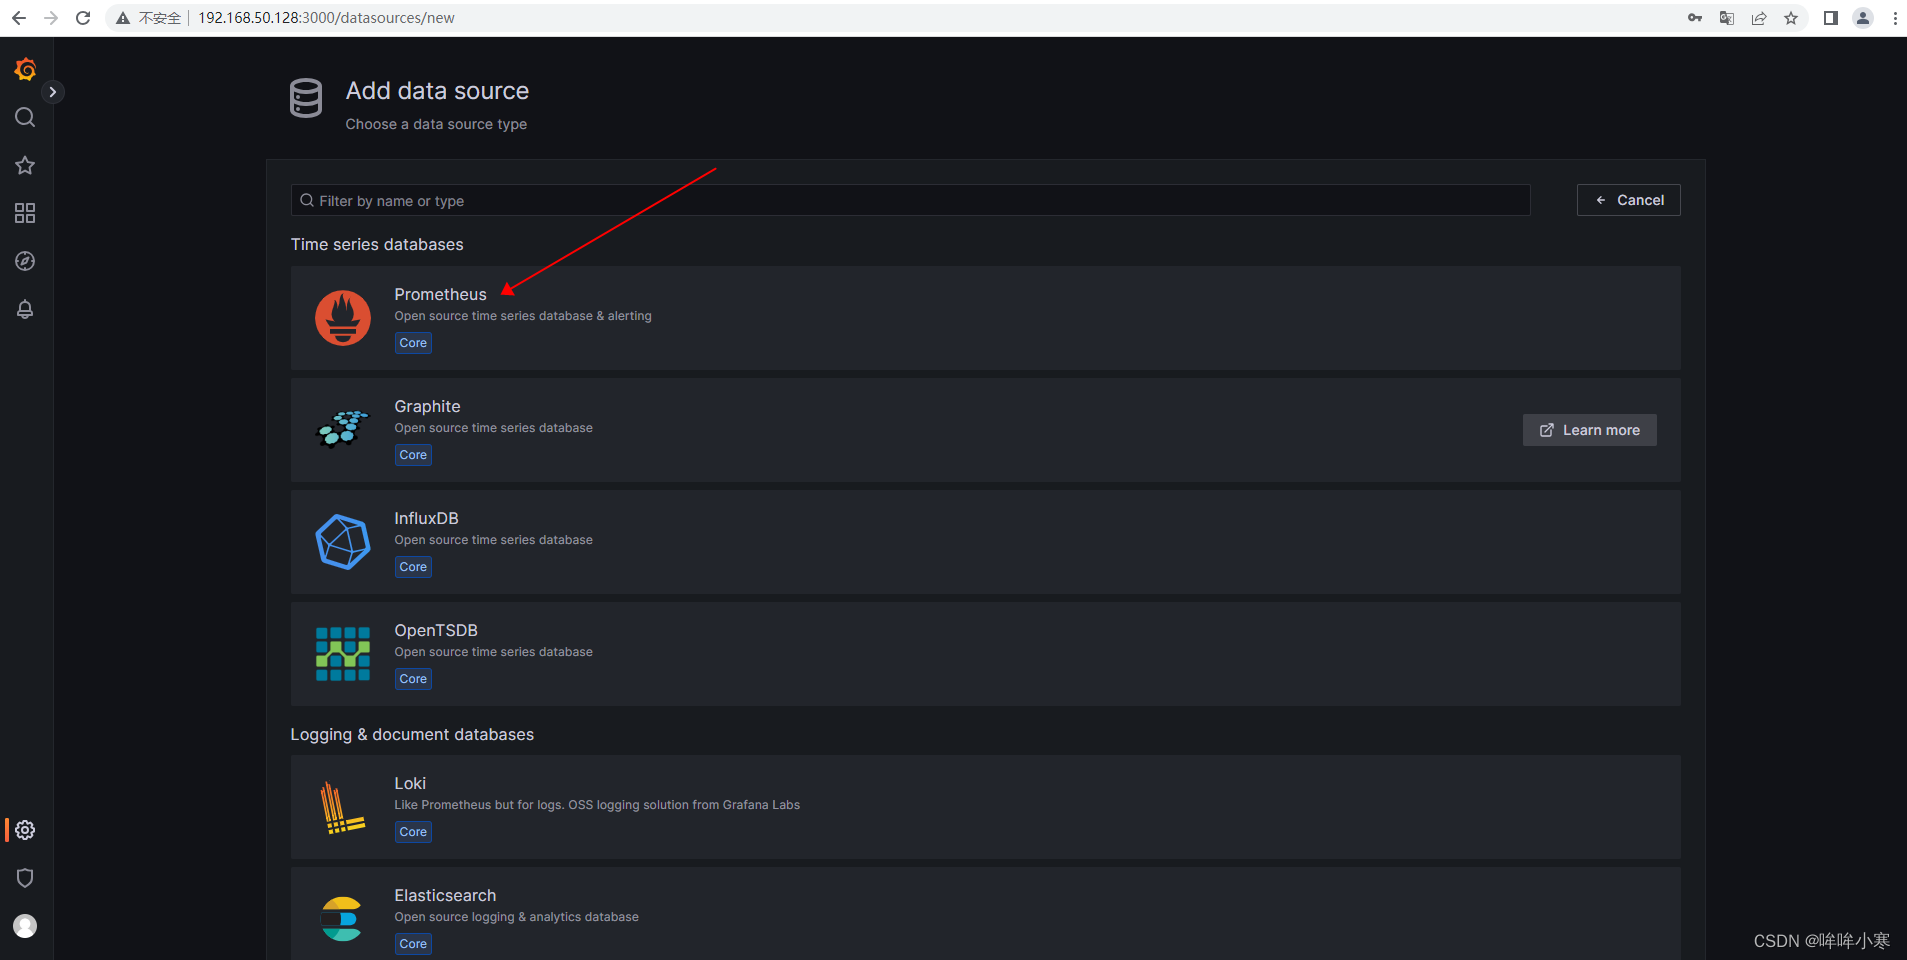
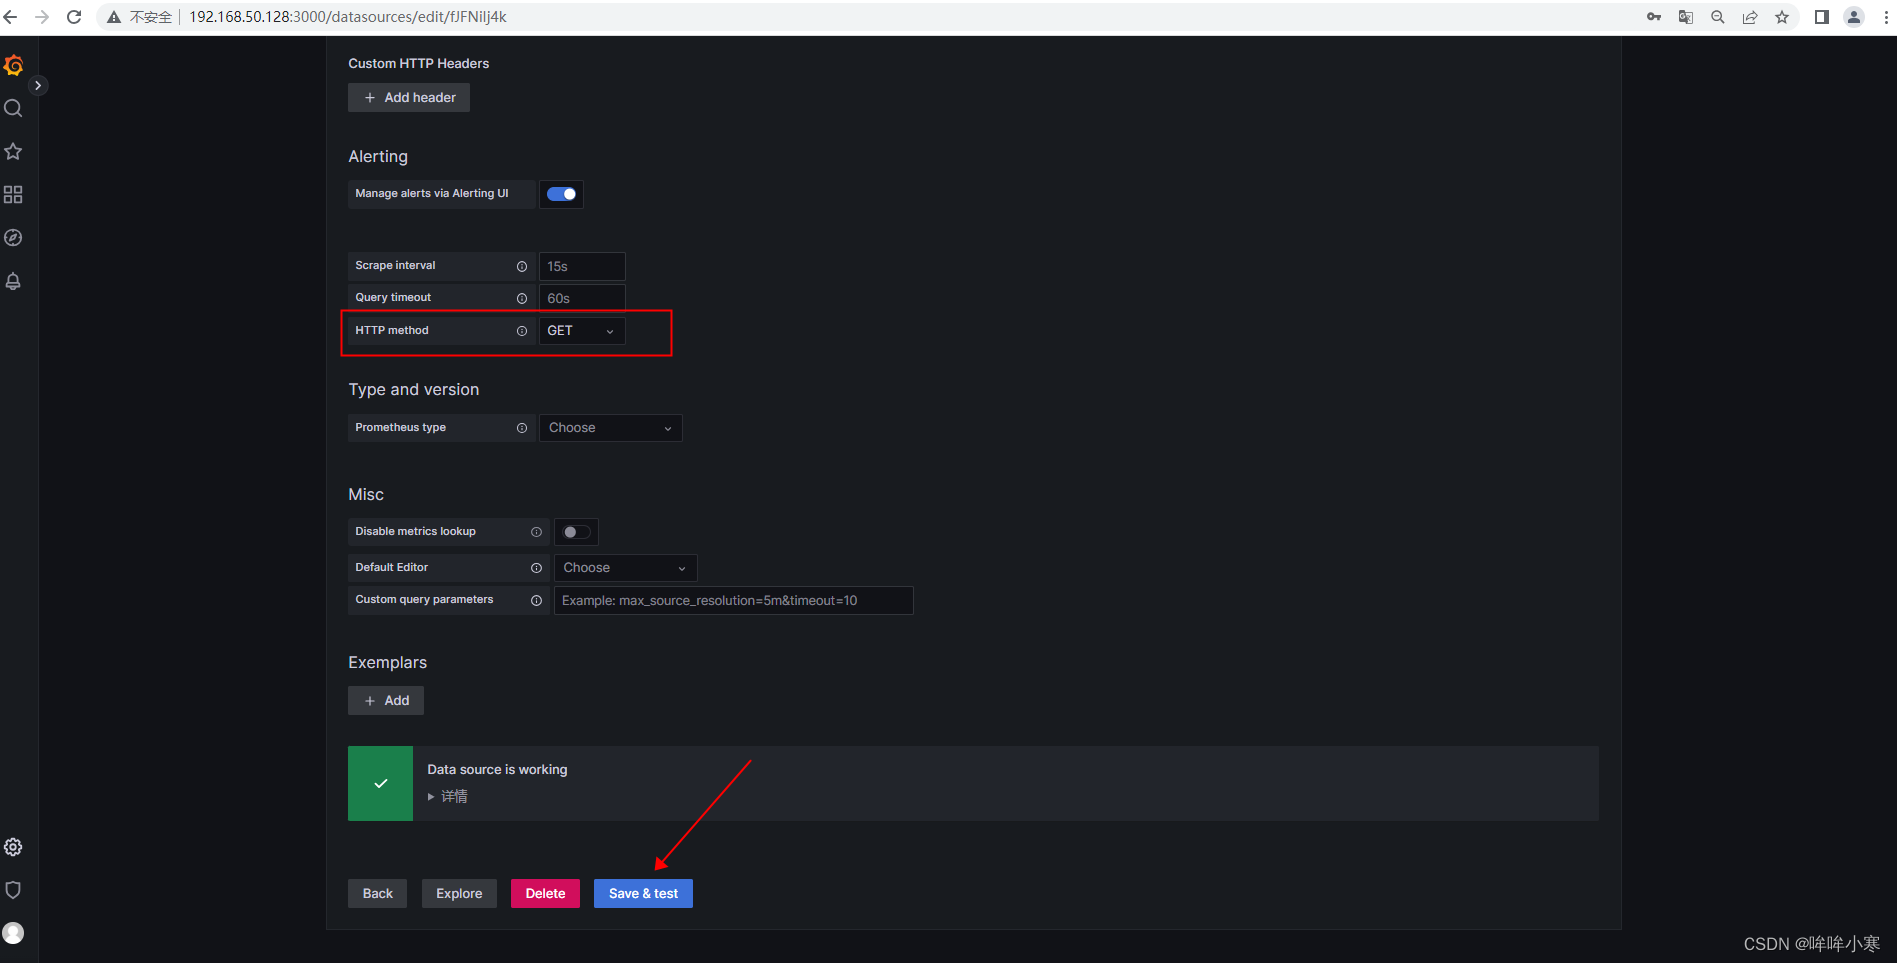
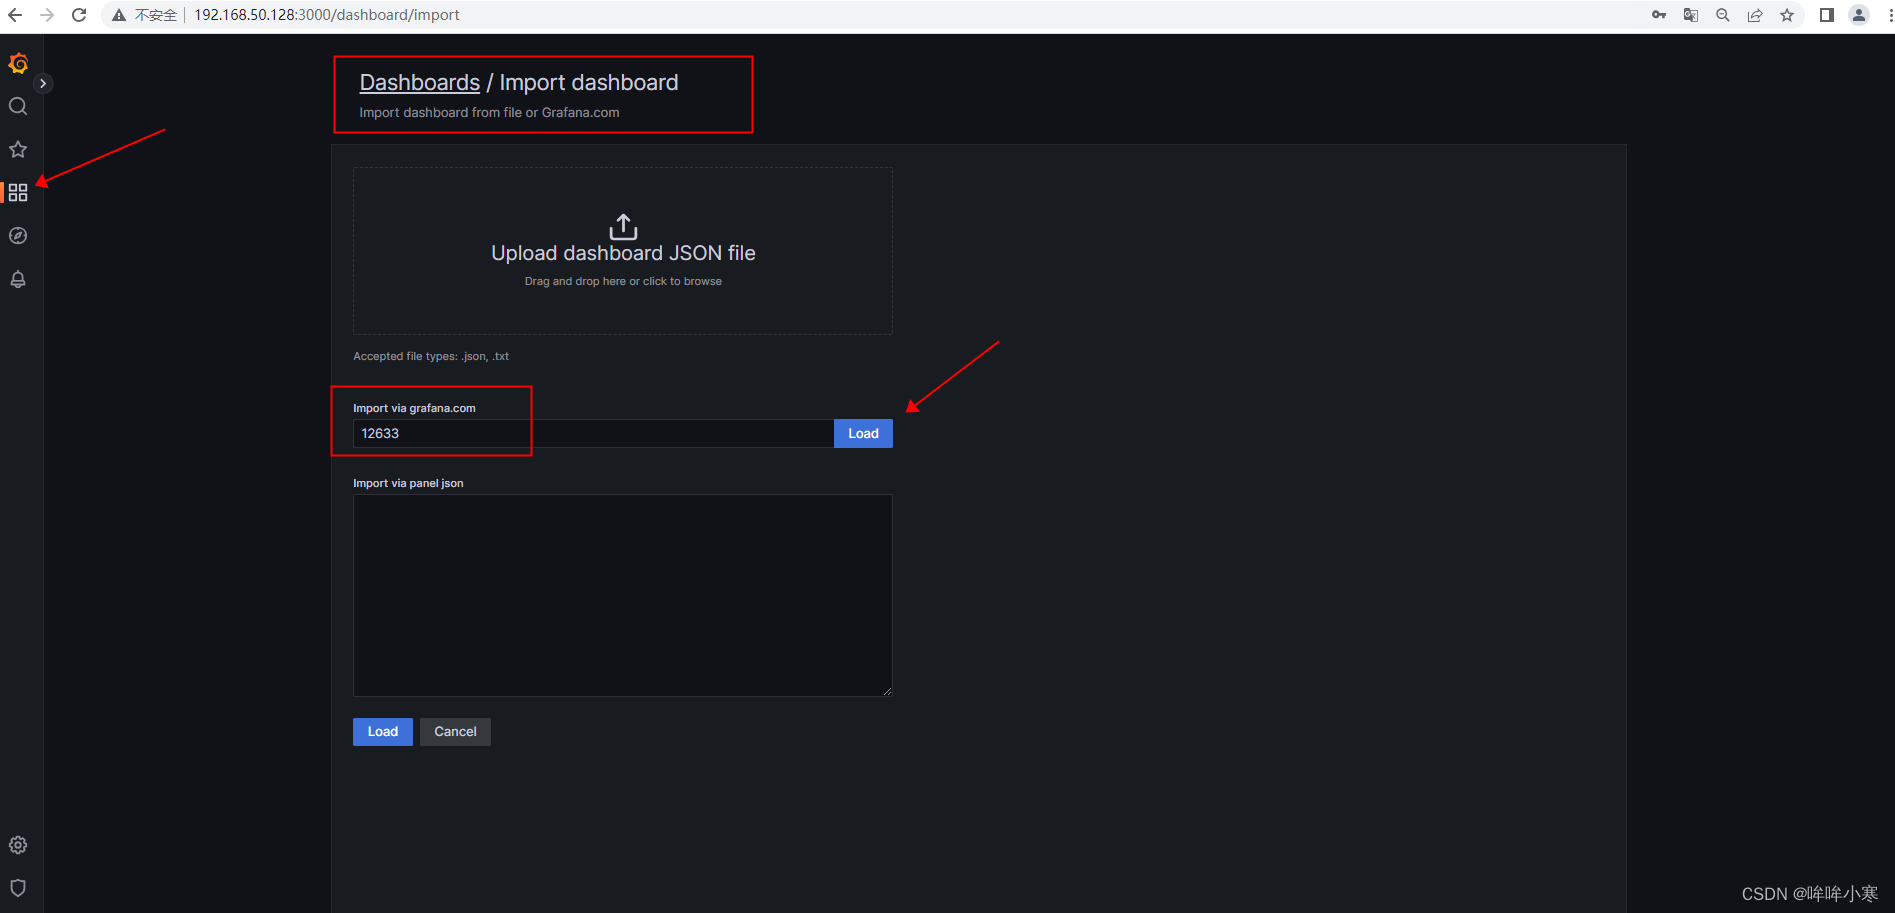
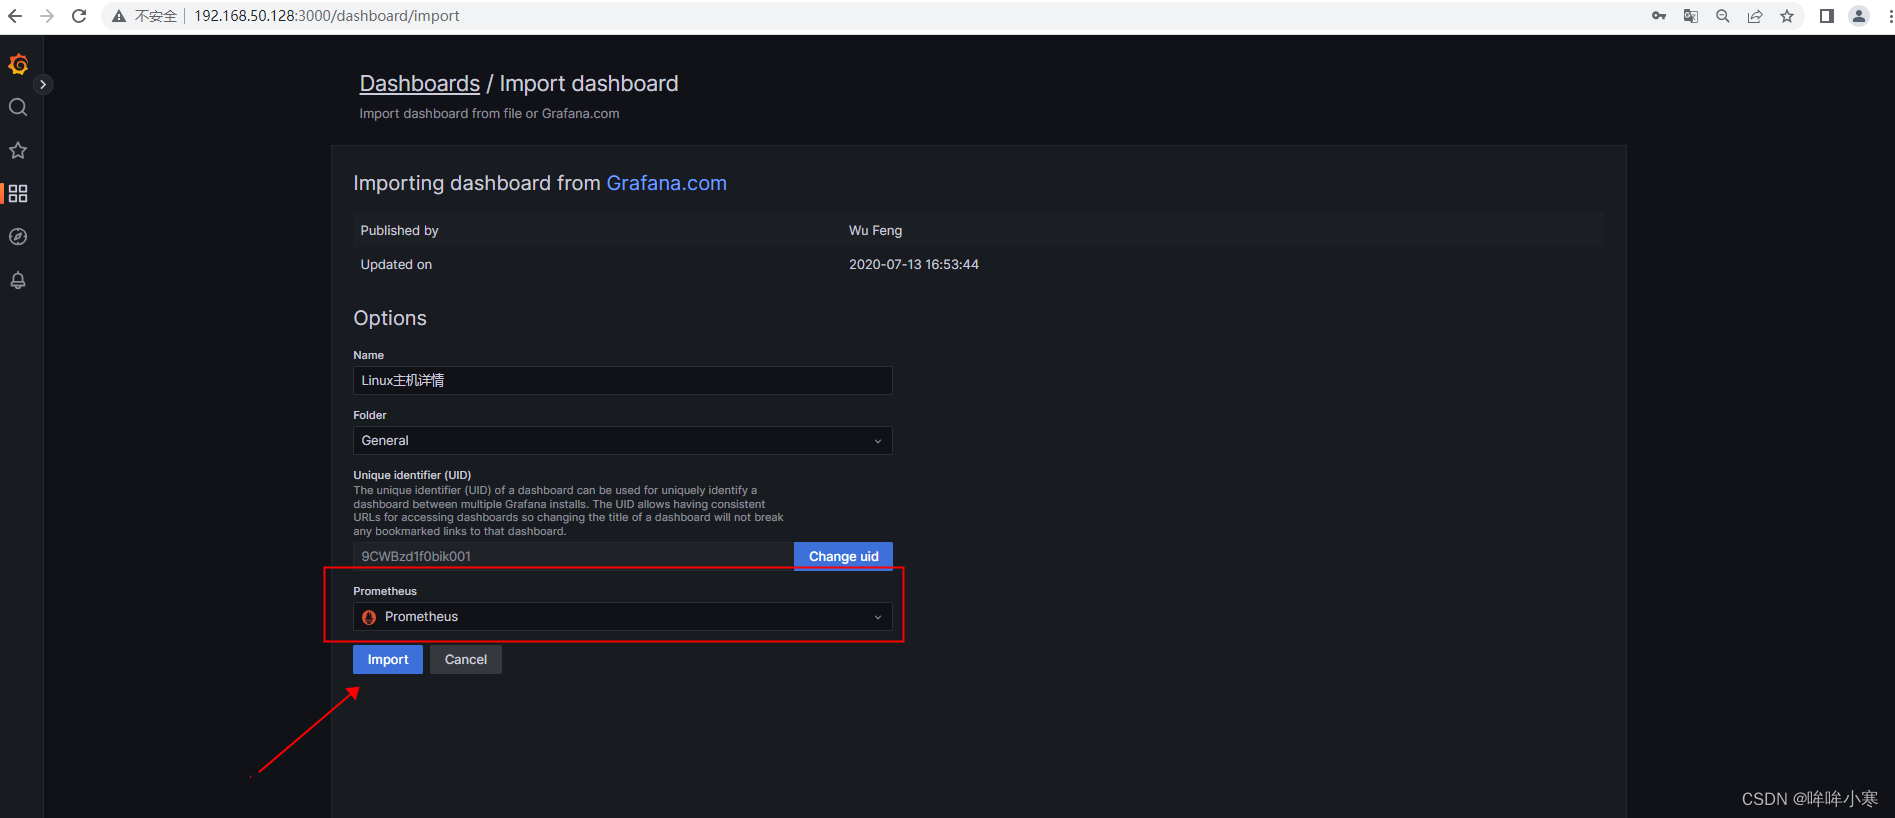
添加数据源与自带模板
五、Alertmanager
# 自定义prometheus告警规则
# 以下规则定义当job export_test2的node_exporter服务挂掉,即产生一个告警
[root@localhost grafana-9.4.3]# cd /opt/server/prometheus-2.42.0.linux-amd64/
[root@localhost prometheus-2.42.0.linux-amd64]# vim rule.yml
groups:
- name: alert-rules
rules:
- alert: InstanceStatus
expr: up{job="export_node1"} == 0
for: 10s
labels:
severity: 'critical'
instance: '{{ $labels.instance }}'
annotations:
description: '服务器 {{ $labels.instance }} 已宕机'
summary: '服务器运行状态'
# 在prometheus的配置文件中添加该规则
[root@localhost prometheus-2.42.0.linux-amd64]# vim prometheus.yml
rule_files:
- "/opt/server/prometheus-2.42.0.linux-amd64/rule.yml"
# - "first_rules.yml"
# - "second_rules.yml"
# 启动alertmanager
[root@localhost server]# cd /opt/server/alertmanager-0.25.0.linux-amd64/
[root@localhost alertmanager-0.25.0.linux-amd64]# ls
alertmanager alertmanager.yml amtool LICENSE NOTICE
[root@localhost alertmanager-0.25.0.linux-amd64]# nohup ./alertmanager &
# 查看
[root@localhost alertmanager-0.25.0.linux-amd64]# netstat -tnpl | grep 9093
tcp6 0 0 :::9093 :::* LISTEN 9654/./alertmanager
# 在prometheus的配置文件中配置alertmanager地址,让其知晓alertmanager的地址,以传送告警信息
[root@localhost alertmanager-0.25.0.linux-amd64]# cd /opt/server/prometheus-2.42.0.linux-amd64/
[root@localhost prometheus-2.42.0.linux-amd64]# vim prometheus.yml
# Alertmanager configuration
alerting:
alertmanagers:
- static_configs:
- targets:
- '192.168.50.128:9093'
# - alertmanager:9093
# 重启promethous
[root@localhost prometheus-2.42.0.linux-amd64]# kill 9620
[root@localhost prometheus-2.42.0.linux-amd64]# nohup ./prometheus &
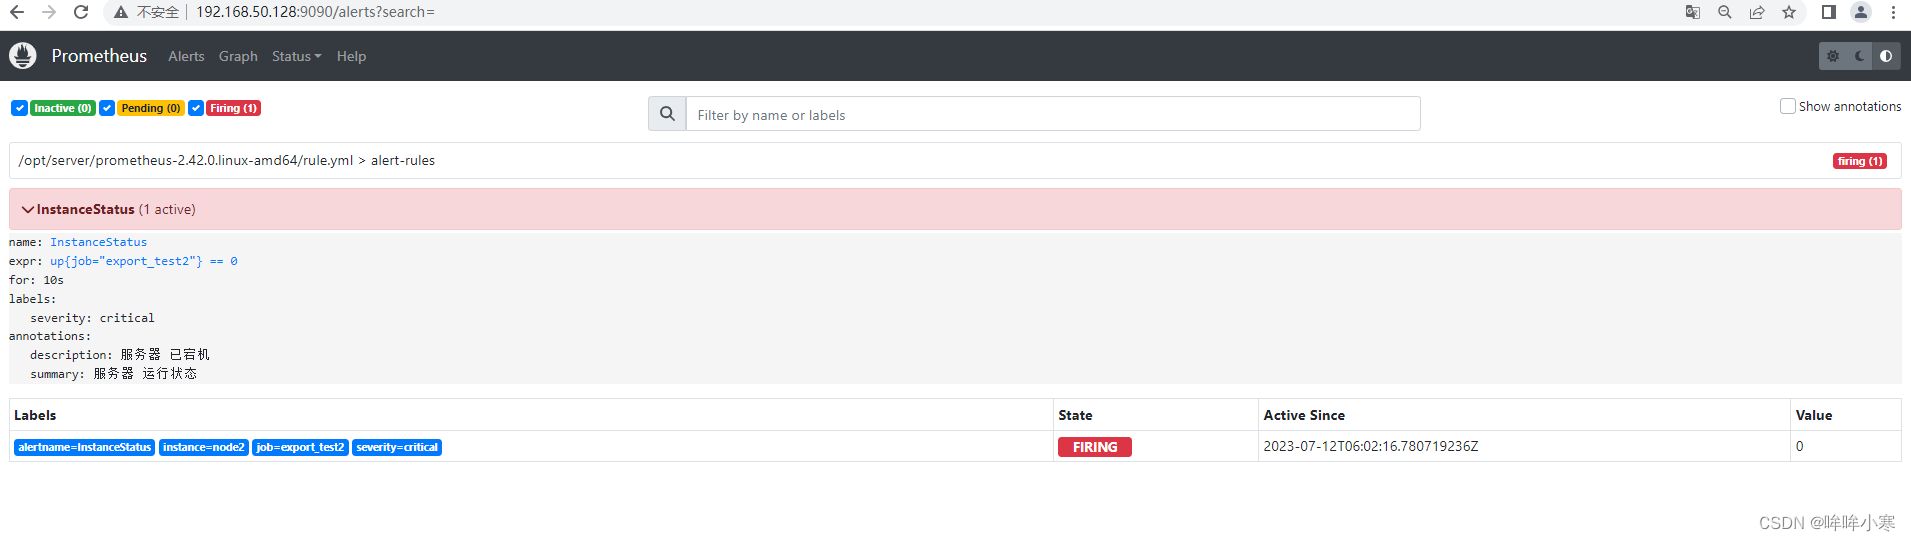
# 测试:此时关闭192.168.50.191的node_exporter服务
# 查看prometheus的web界面,已经产生告警:http://192.168.50.128:9090/alerts
六、prometheus-webhook-dingtalk
[root@localhost prometheus-2.42.0.linux-amd64]# cd /opt/server/prometheus-webhook-dingtalk-2.1.0.linux-amd64/
[root@localhost prometheus-webhook-dingtalk-2.1.0.linux-amd64]# ls
config.example.yml contrib LICENSE prometheus-webhook-dingtalk
[root@localhost prometheus-webhook-dingtalk-2.1.0.linux-amd64]# mv config.example.yml config.yml
# 将钉钉创建机器人的webhook地址与加签秘钥添加进去
[root@localhost prometheus-webhook-dingtalk-2.1.0.linux-amd64]# vim config.yml
## Request timeout
# timeout: 5s
## Uncomment following line in order to write template from scratch (be careful!)
#no_builtin_template: true
## Customizable templates path
#templates:
# - contrib/templates/legacy/template.tmpl
# - /opt/server/prometheus-2.42.0.linux-amd64/rule.yml
## You can also override default template using `default_message`
## The following example to use the 'legacy' template from v0.3.0
#default_message:
# title: '{{ template "legacy.title" . }}'
# text: '{{ template "legacy.content" . }}'
## Targets, previously was known as "profiles"
targets:
webhook1:
url: https://oapi.dingtalk.com/robot/send?access_token=a0cfa51c71d600a750587c497aa524c57ad91f2721df0b6ca4b042148900e773
# secret for signature
secret: SEC8a51037dd8vm351eb304d6c7c30c4a11f7c92672dc263217d7047d9314480986
webhook2:
url: https://oapi.dingtalk.com/robot/send?access_token=xxxxxxxxxxxx
webhook_legacy:
url: https://oapi.dingtalk.com/robot/send?access_token=xxxxxxxxxxxx
# Customize template content
message:
# Use legacy template
title: '{{ template "legacy.title" . }}'
text: '{{ template "legacy.content" . }}'
webhook_mention_all:
url: https://oapi.dingtalk.com/robot/send?access_token=xxxxxxxxxxxx
mention:
all: true
webhook_mention_users:
url: https://oapi.dingtalk.com/robot/send?access_token=xxxxxxxxxxxx
mention:
mobiles: ['156xxxx8827', '189xxxx8325']
# 启动服务
[root@localhost prometheus-webhook-dingtalk-2.1.0.linux-amd64]# nohup ./prometheus-webhook-dingtalk &
# 查看
[root@localhost prometheus-webhook-dingtalk-2.1.0.linux-amd64]# netstat -tnpl | grep 8060
tcp6 0 0 :::8060 :::* LISTEN 9697/./prometheus-w
# 修改Alertmanager配置文件,修改url部分即可
[root@localhost prometheus-webhook-dingtalk-2.1.0.linux-amd64]# cd /opt/server/alertmanager-0.25.0.linux-amd64/
[root@localhost alertmanager-0.25.0.linux-amd64]# vim alertmanager.yml
receivers:
- name: 'web.hook'
webhook_configs:
- url: 'http://192.168.50.128:8060/dingtalk/webhook1/send'
# 重启Prometheus与Alertmanager服务
[root@localhost alertmanager-0.25.0.linux-amd64]# kill 9665
[root@localhost alertmanager-0.25.0.linux-amd64]# kill 9654
[root@localhost alertmanager-0.25.0.linux-amd64]# cd /opt/server/prometheus-2.42.0.linux-amd64/
[root@localhost prometheus-2.42.0.linux-amd64]# nohup ./prometheus &
[root@localhost prometheus-2.42.0.linux-amd64]# cd /opt/server/alertmanager-0.25.0.linux-amd64/
[root@localhost alertmanager-0.25.0.linux-amd64]# nohup ./alertmanager &
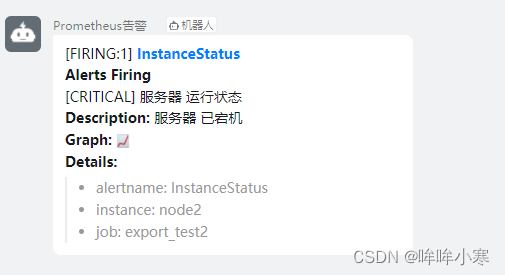
# 最后进行模拟测试,再把50.191上面的node_exporte停掉,等待钉钉告警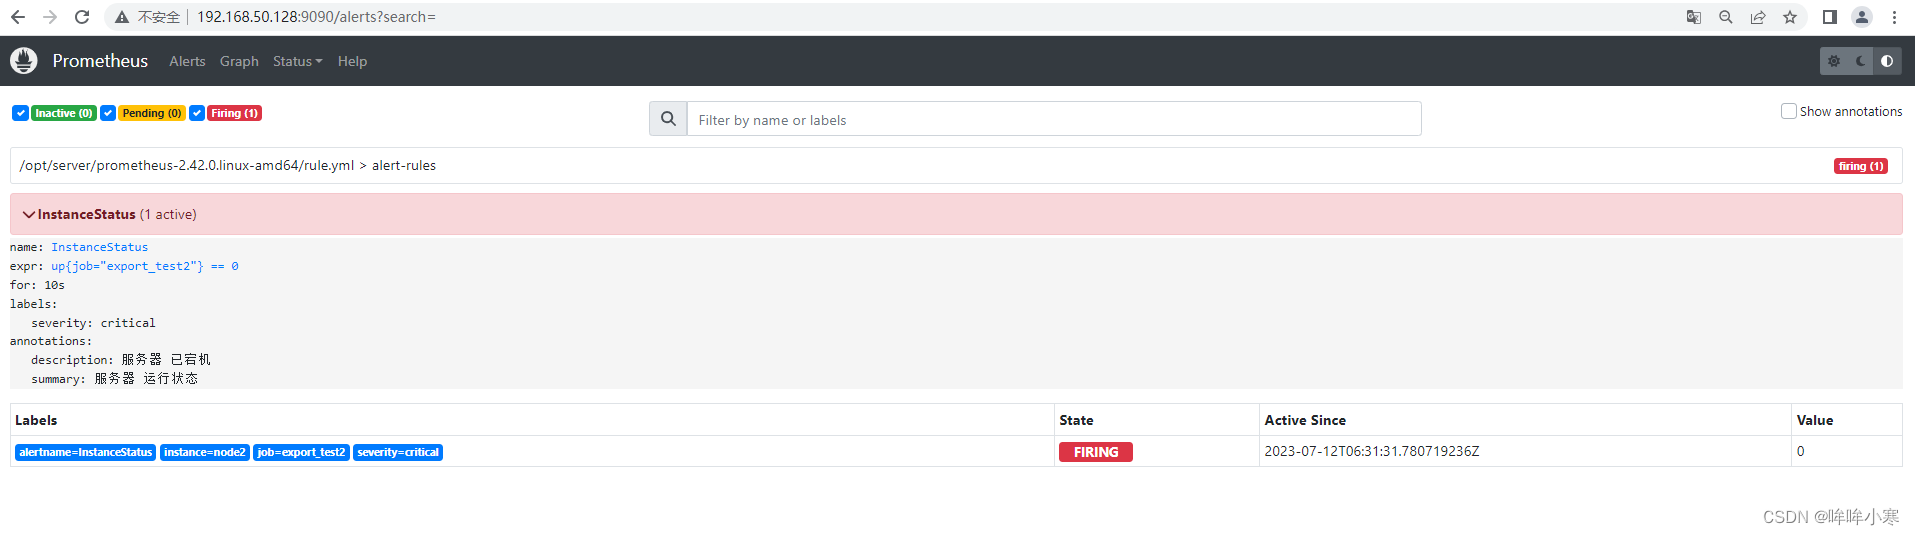


 3641
3641


 被折叠的 条评论
为什么被折叠?
被折叠的 条评论
为什么被折叠?
 到【灌水乐园】发言


