


注意:初始化时,controlPoints 需要写在 edge 的 style 中
import { Graph } from "@antv/g6";
const data = {
nodes: [
{
id: 'node-1',
style: {
x: 200,
y: 200
}
},
{
id: 'node-2',
style: {
x: 350,
y: 120
}
}
],
edges: [
{
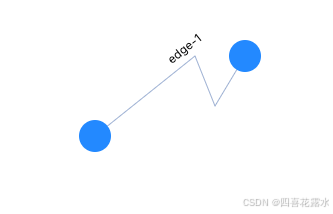
id: 'edge-1',
source: 'node-1',
target: 'node-2',
style: {
controlPoints: [[300, 120], [320, 170]] // 线段中,控制点的位置数组
}
}
]
}
const behaviors = [
{
type: 'drag-element'
}
]
const graph = new Graph({
container: 'container',
data,
edge: {
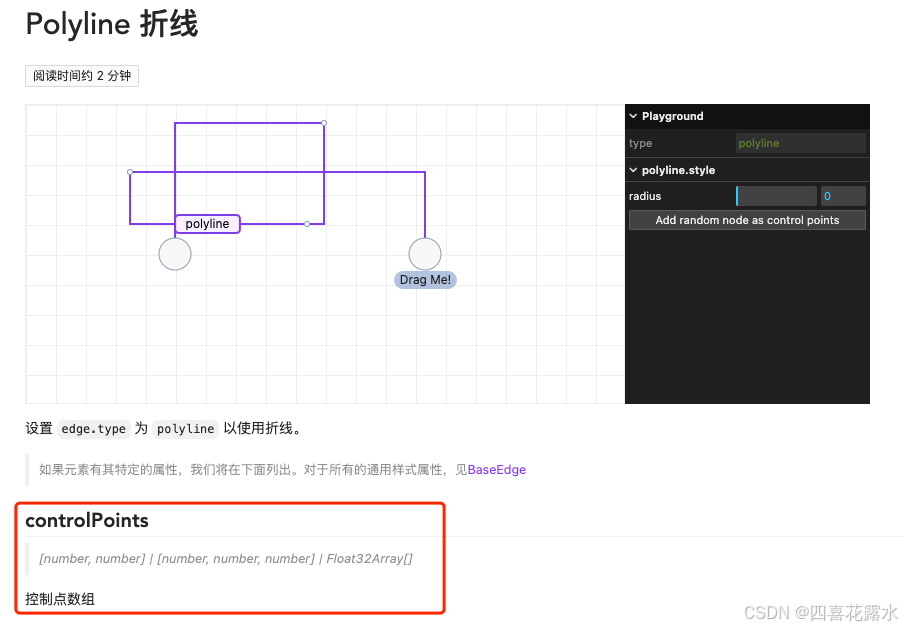
type: 'polyline', // 设置 edge.type 为 polyline 以使用折线
// 注意:初始化时,controlPoints 需要写在 edge 的 style 中
style: {
controlPoints: (d) => d.style.controlPoints, // 控制点数组
labelText: (d) => d.id,
labelOffsetY: -12
},
},
behaviors
})
graph.render() 项目的创建参考 G6 详细教程,注意,node版本需要:required: { node: '>=18' }G6A Graph Visualization Framework in JavaScripthttps://g6.antv.antgroup.com/manual/getting-started/step-by-stephttps://g6.antv.antgroup.com/manual/getting-started/step-by-step![]() https://g6.antv.antgroup.com/manual/getting-started/step-by-step
https://g6.antv.antgroup.com/manual/getting-started/step-by-step


 被折叠的 条评论
为什么被折叠?
被折叠的 条评论
为什么被折叠?
 到【灌水乐园】发言


