


import numpy as np
import pandas as pd

# RMS Titanic data visualization code
from titanic_visualizations import survival_stats
from IPython.display import display
%matplotlib inline

# Load the dataset
in_file = 'titanic_data.csv'
full_data = pd.read_csv(in_file)

# Print the first few entries of the RMS Titanic data
display(full_data.head())
# print type(full_data)
From a sample of the RMS Titanic data, we can see the various features present for each passenger on the ship:
- Survived: Outcome of survival (0 = No; 1 = Yes)
- Pclass: Socio-economic class (1 = Upper class; 2 = Middle class; 3 = Lower class)
- Name: Name of passenger
- Sex: Sex of the passenger
- Age: Age of the passenger (Some entries contain NaN)
- SibSp: Number of siblings and spouses of the passenger aboard
- Parch: Number of parents and children of the passenger aboard
- Ticket: Ticket number of the passenger
- Fare: Fare paid by the passenger
- Cabin Cabin number of the passenger (Some entries contain NaN)
- Embarked: Port of embarkation of the passenger (C = Cherbourg; Q = Queenstown; S = Southampton)
Since we’re interested in the outcome of survival for each passenger or crew member, we can remove the Survived feature from this dataset and store it as its own separate variable outcomes. We will use these outcomes as our prediction targets.
Run the code block cell to remove Survived as a feature of the dataset and store it in outcomes.
# Store the 'Survived' feature in a new variable and remove it from the dataset
outcomes = full_data['Survived']
data = full_data.drop('Survived', axis = 1)

# Show the new dataset with 'Survived' removed
# display(outcomes.head())
display(data.head())
The very same sample of the RMS Titanic data now shows the Survived feature removed from the DataFrame. Note that data (the passenger data) and outcomes (the outcomes of survival) are now paired. That means for any passenger data.loc[i], they have the survival outcome outcome[i].
To measure the performance of our predictions, we need a metric to score our predictions against the true outcomes of survival. Since we are interested in how accurate our predictions are, we will calculate the proportion of passengers where our prediction of their survival is correct. Run the code cell below to create our accuracy_score function and test a prediction on the first five passengers.
Think: Out of the first five passengers, if we predict that all of them survived, what would you expect the accuracy of our predictions to be?
def accuracy_score(truth, pred):
    """ Returns accuracy score for input truth and predictions. """

    # Ensure that the number of predictions matches number of outcomes
    if len(truth) == len(pred):

        # Calculate and return the accuracy as a percent
        return "Predictions have an accuracy of {:.2f}%.".format((truth == pred).mean()*100)

    else:
        return "Number of predictions does not match number of outcomes!"

# Test the 'accuracy_score' function
predictions = pd.Series(np.ones(5, dtype = int))
print accuracy_score(outcomes[:5], predictions)
# predictions = pd.Series(np.ones(len(outcomes), dtype = int))
# print accuracy_score(outcomes, predictions)
# print predictions
Predictions have an accuracy of 60.00%.
Making Predictions
If we were told to make a prediction about any passenger aboard the RMS Titanic who we did not know anything about, then the best prediction we could make would be that they did not survive. This is because we can assume that a majority of the passengers as a whole did not survive the ship sinking.
The function below will always predict that a passenger did not survive.
def predictions_0(data):
    """ Model with no features. Always predicts a passenger did not survive. """

    predictions = []
    for _, passenger in data.iterrows():

        # Predict the survival of 'passenger'
        predictions.append(0)

    # Return our predictions
    return pd.Series(predictions)

# Make the predictions
predictions = predictions_0(data)
# print data.iterrows()
# print predictions
Question 1
Using the RMS Titanic data, how accurate would a prediction be that none of the passengers survived?
print accuracy_score(outcomes, predictions)Predictions have an accuracy of 61.62%.
Answer: The predictions’ accuracy of passengers is 61.62%. That means about 62 people died in 100, in the sunk.
Let’s take a look at whether the feature Sex has any indication of survival rates among passengers using the survival_stats function. This function is defined in the titanic_visualizations.py Python script included with this project. The first two parameters passed to the function are the RMS Titanic data and passenger survival outcomes, respectively. The third parameter indicates which feature we want to plot survival statistics across.
Run the code cell below to plot the survival outcomes of passengers based on their sex.
survival_stats(data, outcomes, 'Sex')
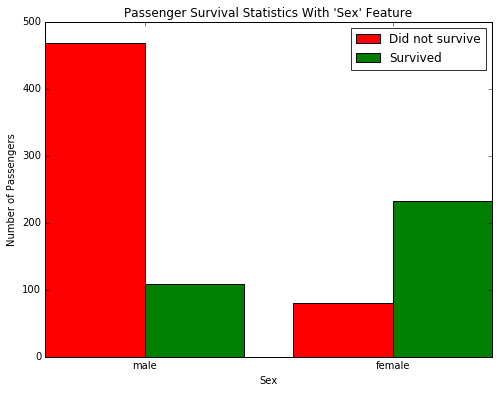
Examining the survival statistics, a large majority of males did not survive the ship sinking. However, a majority of females did survive the ship sinking. Let’s build on our previous prediction: If a passenger was female, then we will predict that they survived. Otherwise, we will predict the passenger did not survive.
Fill in the missing code below so that the function will make this prediction.
def predictions_1(data):
    """ Model with one feature:
            - Predict a passenger survived if they are female. """

    predictions = []
    for _, passenger in data.iterrows():
        # Remove the 'pass' statement below
        # and write your prediction conditions here
        predictions.append((passenger['Sex'] == 'female'))
    # Return our predictions
    return pd.Series(predictions)

# Make the predictions
predictions = predictions_1(data)
Question 2
How accurate would a prediction be that all female passengers survived and the remaining passengers did not survive?
print accuracy_score(outcomes, predictions)Predictions have an accuracy of 78.68%.
Answer: When predicting with ‘Sex’ attribute, I get a better accuracy. That means famales are more able to survive, because of their stong body maybe.
Using just the Sex feature for each passenger, we are able to increase the accuracy of our predictions by a significant margin. Now, let’s consider using an additional feature to see if we can further improve our predictions. Consider, for example, all of the male passengers aboard the RMS Titanic: Can we find a subset of those passengers that had a higher rate of survival? Let’s start by looking at the Age of each male, by again using the survival_stats function. This time, we’ll use a fourth parameter to filter out the data so that only passengers with the Sex ‘male’ will be included.
Run the code cell below to plot the survival outcomes of male passengers based on their age.
# survival_stats(data, outcomes, 'Age', ["Sex == 'female'"])
survival_stats(data, outcomes, 'Age', ["Sex == 'male'"])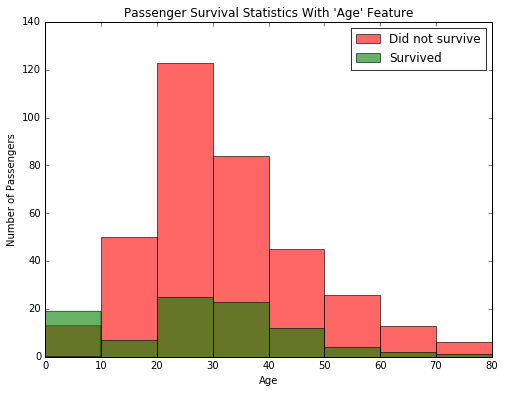
Examining the survival statistics, the majority of males younger than 10 survived the ship sinking, whereas most males age 10 or older did not survive the ship sinking. Let’s continue to build on our previous prediction: If a passenger was female, then we will predict they survive. If a passenger was male and younger than 10, then we will also predict they survive. Otherwise, we will predict they do not survive.
Fill in the missing code below so that the function will make this prediction.
def predictions_2(data):
    """ Model with two features:
            - Predict a passenger survived if they are female.
            - Predict a passenger survived if they are male and younger than 10. """

    predictions = []
    for _, passenger in data.iterrows():

        # Remove the 'pass' statement below
        # and write your prediction conditions here
        if((passenger['Age'] <= 10)):
            predictions.append(1)
        else:
            predictions.append((passenger['Sex'] == 'female'))

    # Return our predictions
    return pd.Series(predictions)

# Make the predictions
predictions = predictions_2(data)
Question 3
How accurate would a prediction be that all female passengers and all male passengers younger than 10 survived?
print accuracy_score(outcomes, predictions)Predictions have an accuracy of 79.24%.
Answer: Because of the prediction of passengers younger than 10, I get a better accuracy with 79.24%.
Adding the feature Age as a condition in conjunction with Sex improves the accuracy by a small margin more than with simply using the feature Sex alone. Now it’s your turn: Find a series of features and conditions to split the data on to obtain an outcome prediction accuracy of at least 80%. This may require multiple features and multiple levels of conditional statements to succeed. You can use the same feature multiple times with different conditions.
Pclass, Sex, Age, SibSp, and Parch are some suggested features to try.
Use the survival_stats function below to to examine various survival statistics.
# survival_stats(data, outcomes, 'Age', ["Sex == 'male'", "Age < 18"])
survival_stats(data, outcomes, 'Pclass', ["Sex == 'female'", "Age > 38","Age < 60"])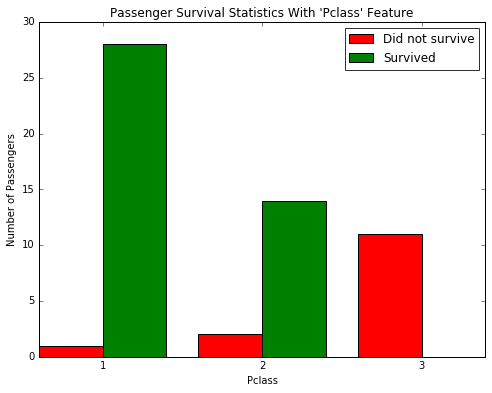
After exploring the survival statistics visualization, fill in the missing code below so that the function will make your prediction.
Make sure to keep track of the various features and conditions you tried before arriving at your final prediction model.
predictions_2.
def predictions_3(data):
    """ Model with multiple features. Makes a prediction with an accuracy of at least 80%. """

    predictions = []
    for _, passenger in data.iterrows():

        # Remove the 'pass' statement below
        # and write your prediction conditions here
        if(passenger['Sex'] == 'female'):
            if((passenger['Pclass'] == 3) and (passenger['Age'] >= 40) and (passenger['Age'] <= 60) ):
                predictions.append(0)
            else:
                predictions.append(1)
        else:
            if((passenger['Age'] <= 10)):
                predictions.append(1)
            else:
                predictions.append(0)

    # Return our predictions
    return pd.Series(predictions)

# Make the predictions
predictions = predictions_3(data)
Question 4
Describe the steps you took to implement the final prediction model so that it got an accuracy of at least 80%. What features did you look at? Were certain features more informative than others? Which conditions did you use to split the survival outcomes in the data? How accurate are your predictions?
print accuracy_score(outcomes, predictions)Predictions have an accuracy of 80.25%.
Answer: When considering about Pclass, Socio-economic class, I found that lower-class female with age between 40 and 60 are more likely to be not surviced, while the major of female survived. So we can predict that people with “Age=(40,60), and Pclass=3” to be not survived. Thus we can get a better accuracy.
Conclusion
Congratulations on what you’ve accomplished here! You should now have an algorithm for predicting whether or not a person survived the Titanic disaster, based on their features. In fact, what you have done here is a manual implementation of a simple machine learning model, the decision tree. In a decision tree, we split the data into smaller groups, one feature at a time. Each of these splits will result in groups that are more homogeneous than the original group, so that our predictions become more accurate. The advantage of having a computer do things for us is that it will be more exhaustive and more precise than our manual exploration above. This link provides another introduction into machine learning using a decision tree.
A decision tree is just one of many algorithms that fall into the category of supervised learning. In this Nanodegree, you’ll learn about supervised learning techniques first. In supervised learning, we concern ourselves with using features of data to predict or model things with objective outcome labels. That is, each of our datapoints has a true outcome value, whether that be a category label like survival in the Titanic dataset, or a continuous value like predicting the price of a house.
Question 5
Can you think of an example of where supervised learning can be applied?
Answer: Supervised learning can be applied to prediction the number of passengers of some sub-way station at 8 Am, so that we can avoid jam. The outcome is the mumber of passengers at 8 am, while fetures vary from the weather, weekday, holidays, and so on.


 236
236

 被折叠的 条评论
为什么被折叠?
被折叠的 条评论
为什么被折叠?
 到【灌水乐园】发言


