


效果步骤:
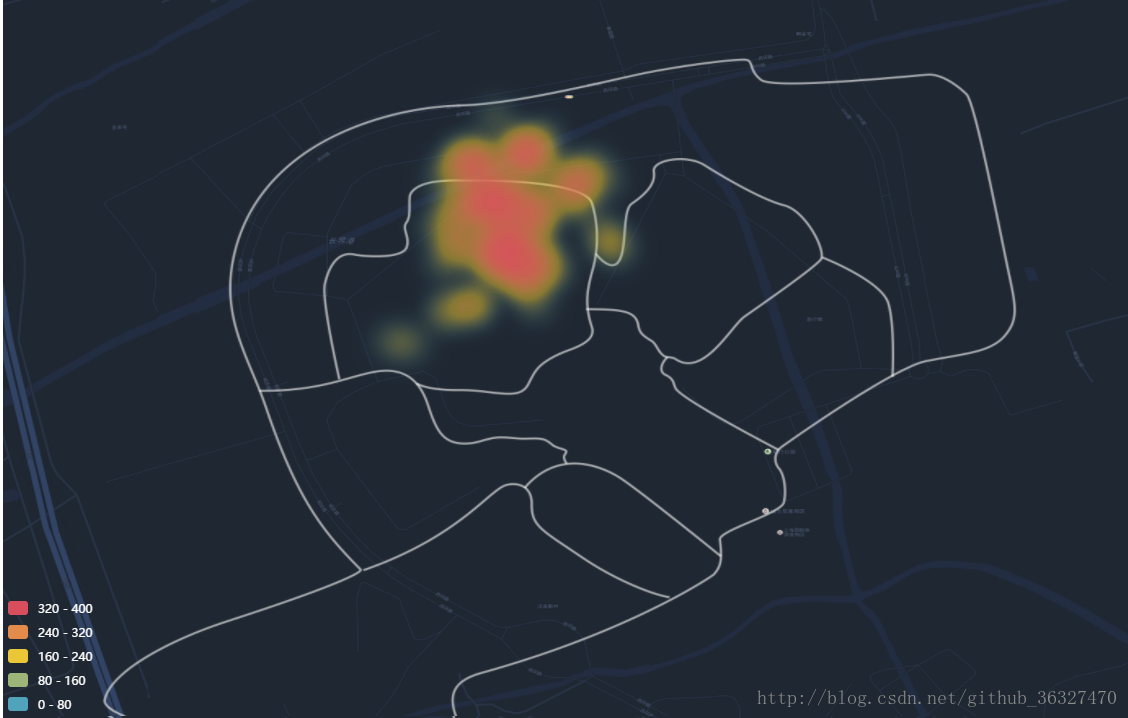
技术: echarts 热力图(只支持geoJson ), 原理: 图片地图(最底层)+getJson+echart热力图(最上层盖住)
实现步骤:
圈出具体的坐标区域范围(根据图片的区域,尽量接近,数据真实):
http://geojson.io/#map=14/31.1467/121.6641也可以使用 actgis 制作: http://blog.csdn.net/gisboygogogo/article/details/74056563
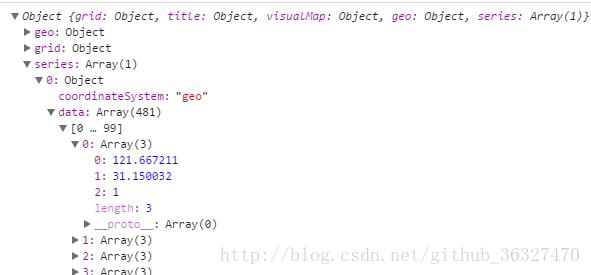
根据 echarts(heatmap )条件造假数据。。。
附 option 代码:
//type 为注册地图类型,data 为 geoJson 数据,seriesDatas 为数据
promise.then((data) => {

        echarts.registerMap(type, data);  //注册
        var chart = echarts.init(document.getElementById(domId));

        var option = {
            grid:{
                width:'auto',
                height:'auto',
                bottom:0,
                right:0,
                show:false
            },
            title: {
                text: '全国主要城市空气质量热力图',
                left: 'center',
                textStyle: {
                    color: '#fff'
                }
            },
           // backgroundColor: '#404a59',
            visualMap: {
                type: 'piecewise',  //piecewise 等级
                min: 0,
                max: 400,
                splitNumber: 5,
                inRange: {
                    color: ['#d94e5d','#eac736','#50a3ba'].reverse()
                },
                textStyle: {
                    color: '#fff'
                }
            },
            geo: {
                map: type,
                show:false,  //取消外层边框
                left:position,
                label: {
                    normal:{
                        show:true,
                        textStyle:{
                            color:'#fff',
                            fontStyle: 'normal',
                            fontSize:14
                        }
                    },
                    emphasis: {
                        show: true,
                        textStyle:{
                            color:'#fff',
                            fontStyle: 'normal',
                            fontSize:14
                        }
                    }
                },
                roam: false,
                itemStyle: {
                    normal: {
                      //  areaColor: '#323c48',
                        areaColor:'transparent',
                        borderColor: '#111',
                        //borderWidth:0
                    },
                    emphasis: {
                        areaColor:'transparent',
                       // areaColor: '#2a333d'
                    }
                }
            },
            series: [{
                type: 'heatmap',
                map: type,
                coordinateSystem: 'geo',
                data: seriesDatas
            }]
        };

        chart.setOption(option);
    })
–end


 693
693


 被折叠的 条评论
为什么被折叠?
被折叠的 条评论
为什么被折叠?
 到【灌水乐园】发言


