


public static void main(String[] args) throws Exception{
        //httpclient连接池

        //创建连接池
        PoolingHttpClientConnectionManager cManager = new PoolingHttpClientConnectionManager();
        //设置最大连接数
        cManager.setMaxTotal(50);
        //设置每个主机地址的并发数
        cManager.setDefaultMaxPerRoute(20);

        //执行i请求
        doGet(cManager);
    }


    private static void doGet(PoolingHttpClientConnectionManager cm) throws Exception{
        //从连接池获取连接,每次不一样
        CloseableHttpClient httpClient = HttpClients.custom().setConnectionManager(cm).build();
        //设置http get
        HttpGet httpGet = new HttpGet("https://www.baidu.com");
        //设置请求参数
        RequestConfig config = RequestConfig.custom().setConnectTimeout(5000) //连接超时时间
                .setConnectionRequestTimeout(500) //从线程池中获取线程超时时间
                .setSocketTimeout(8000) //设置数据超时时间
                .setStaleConnectionCheckEnabled(true) //提交请求前检查连接是否可用
                .build();

        httpGet.setConfig(config);

        //返回数据
        CloseableHttpResponse response = null;

        try {
            response = httpClient.execute(httpGet);
            String con = EntityUtils.toString(response.getEntity(), "utf-8");
            System.out.println(con);
        }finally{
            if(response!=null){
                response.close();
            }
            httpClient.close();
        }

    }
ConnectTimeout、ConnectionRequestTimeout、SocketTimeout的含义
//设置请求超时时间
  RequestConfig requestConfig = RequestConfig.custom()
           .setConnectTimeout(2000)
           .setConnectionRequestTimeout(2000)
           .setSocketTimeout(2000)
           .build();
说明
ConnectionRequestTimeout
httpclient使用连接池来管理连接,这个时间就是从连接池获取连接的超时时间,可以想象下数据库连接池
ConnectTimeout
连接建立时间,三次握手完成时间
SocketTimeout
数据传输过程中数据包之间间隔的最大时间
下面重点说下SocketTimeout,比如有如下图所示的http请求
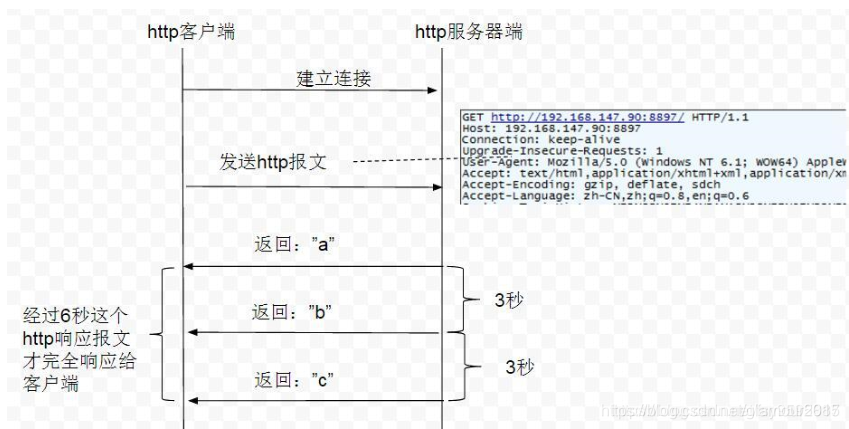
虽然报文(“abc”)返回总共用了6秒,如果SocketTimeout设置成4秒,实际程序执行的时候是不会抛出java.net.SocketTimeoutException: Read timed out异常的。
因为SocketTimeout的值表示的是“a”、”b”、”c”这三个报文,每两个相邻的报文的间隔时间不能超过SocketTimeout。
http连接池未设置获取连接超时时间导致服务死机
一、故障过程回顾
2020年1月3日早上7:30收到pay-xx服务连接超时告警,发现问题后马上进行排查,根据链路日志发现,我们请求有通过http发送给第三方,将请求日志发给第三方,但第三方反馈未收到该请求。瞬间懵逼了, 我们有发送请求,但第三方没有收到,请求中途掉包了 ?网络出现了问题?但是我们部分请求是可以送达第三方的,开始怀疑是第三方对我们出口的ip做了白名单限制 ? 7:50 左右我们一个服务节点开始出现波测告警,该告警的意思是一个服务节点已经死机。于是赶快联系运维重新部署,pay-xx服务。 8:30重新部署服务后,整个请求恢复正常。
为了排查问题,我们然运维保留了死机节点,并导出了jvm堆栈。
二、问题排查
1)我将出问题的节点出口ip给第三方排查是否由于网关ip白名单访问限制导致问题,第三运维反馈ip白名单正常。
2)我开始找出问题时候http访问的状态,发现在服务告警前,http请求第三方返回了很多504以后, 我们服务开始出现异常;

3)第三方排查确实7:29至7:30 一段时间没有收到我们的请求,那这个http 504状态表示的超时,是什么地方返回的呢?看第三方网关监控7:30分他们可以正常收到请求,但为什么我们的一个节点会出现死机呢?
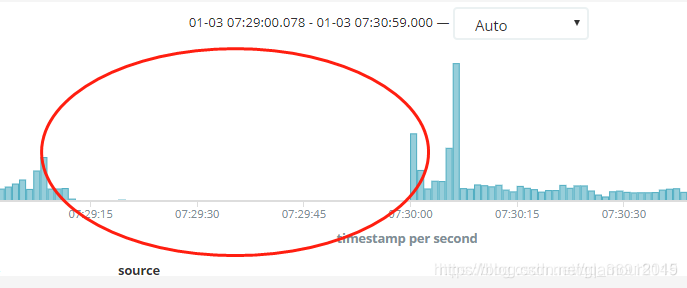
4)第三方用的是阿里云cdn加速,进过与阿里一起排查发现7:29至7:30,我们收到的504状态码,是阿里网关内部超时返回的

5)第三方优化了cdn 中tcp 超时时间

6)问题的根源算是找到了,是由于阿里网关内部超时导致,我们服务7:29至7:30大量请求超时。
7)问题起因算是找到了, 但我们的服务为什么没有,没有对连接做超时断开呢 ?于是我开始看项目代码。
 public Map<String, String> send(HttpRequest request) throws ClientException, BusinessException {
        Stopwatch stopwatch = Stopwatch.createStarted();
        logger.info("Start send http request...");

        //设置超时时间,如果request没设置超时时间,取profile里的
        int socketTimeout = request.getSocketTimeout() > 0 ? request.getSocketTimeout() :10000;
        int connectTimeout = request.getConnectTimeout() > 0 ? request.getConnectTimeout() : 10000;
        RequestConfig config = RequestConfig.custom().setSocketTimeout(socketTimeout).setConnectTimeout(connectTimeout)
                .build();

        logger.info("Http request params: uri={}, headers={}, params={} ", request.getUri(),
                JSONArray.toJSONString(request.getHeaders()), SensitiveUtils.toJson(request.getParamsMap()));

        if (logger.isDebugEnabled() && Strings.nullToEmpty(request.getBodyText()).length() > 0) {
            logger.debug("Http request body is {}", request.getBodyText());
        }
        //请求调用
        CloseableHttpResponse httpResponse;
        if (request.getMethodType() == MethodType.GET) {
            httpResponse = sendGet(request, config);
        } else if (request.getMethodType() == MethodType.POST) {
            httpResponse = sendPost(request, config);
        } else {
            throw new ClientException(ClientErrorCode.METHOD_TYPE_NOT_SUPPORT);
        }
        //校验http状态码
        checkHttpStatus(httpResponse);
        Map<String, String> response = new HashMap<>();

        } catch (Exception e) {
            logger.error("Close the response inputStream error, error={}", e);
            throw new ServerException(ClientErrorCode.CLOSE_RESPONSE_CONTENT_ERROR);
        } finally {
            try {
                httpResponse.close();
            } catch (IOException e) {
                logger.error("Close the response error, error={}", e);
            }
            logger.info("Http request response: uri={}, response={}, time={} ", request.getUri(),
                    SensitiveUtils.toJson(response), stopwatch.elapsed(TimeUnit.MILLISECONDS));
        }

        return response;
    }
从上面代码看来都有设置SocketTimeout、ConnectTimeout的超时时间,按理我们请求第三方如果超时,就会出现超时。在代码里面我们有打印error日志,但是我在日志系统中查了并无明显的error日志。那说明我们http请求是没有出现异常。
8)开始排查为什么我们服务没有异常的原因,我们在日志中看到一直在发请求,但一直没有http返回
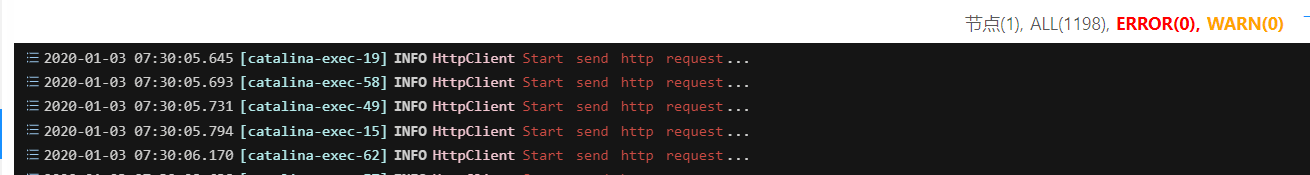
9) 让运维查看了故障节点日志, 也未发现异常,我们用的是docker容器,如果宿主机出现问题,其它服务器也会有异常告警, 说明容器是没有问题的。
10)通过故障节点堆栈信息分析,http请求导致Tomcat线程池出现了问题。
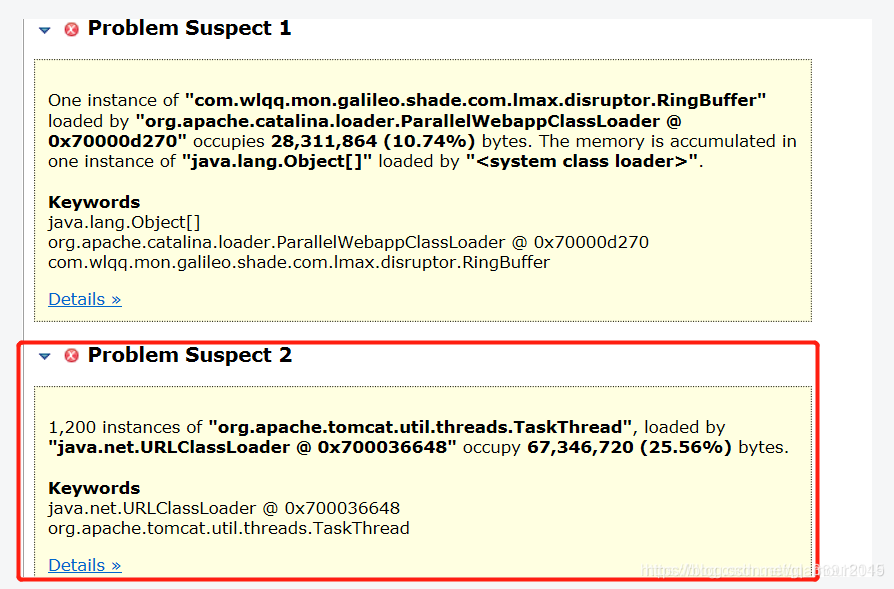
11)上分析已经明显知道,是由于http请求堆积太多导致,服务线程池飙升,导致节点死机。那问题又回到为为什么大量http请求,堆积后没有超时失败呢 ?然后开始google 发现 apache httpclient 4.5 用连接池技术,新增了一个超时时间设置,默认设置的是-1 ;
setConnectionRequestTimeout:设置从connect Manager获取Connection 超时时间,单位毫秒。这个属性是新加的属性,因为目前版本是可以共享连接池的。
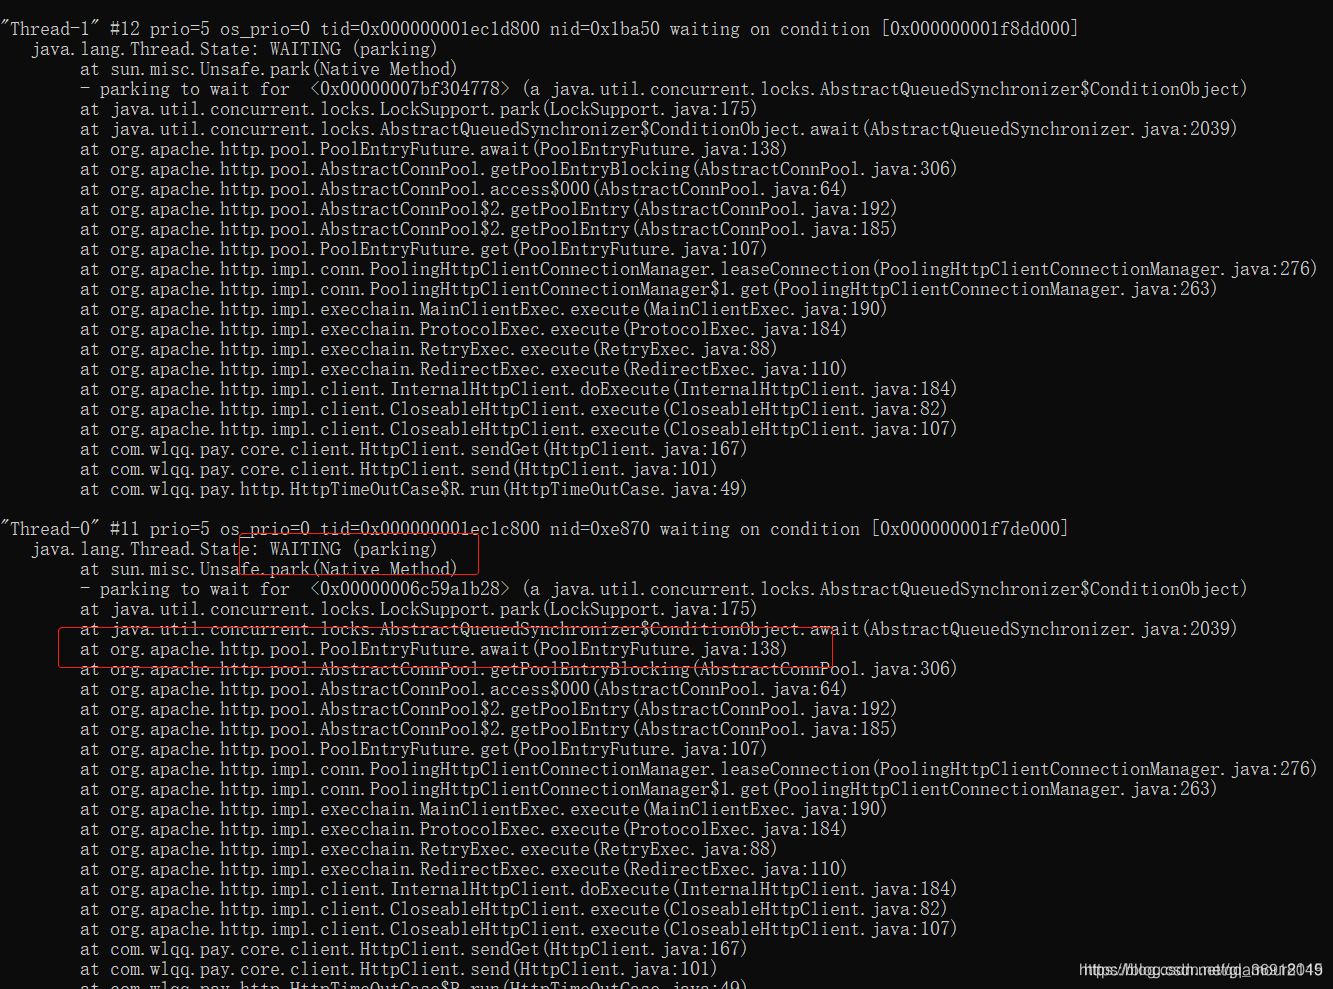
紧接去看httpclient的源码发现了坑。 获取Connection有判断
ConnectionRequestTimeout时间,默认值-1会被设置为0 ,0表示永久不失效。

  final HttpClientConnection managedConn;
        try {
            final int timeout = config.getConnectionRequestTimeout();
            managedConn = connRequest.get(timeout > 0 ? timeout : 0, TimeUnit.MILLISECONDS);
        } catch(final InterruptedException interrupted) {
            Thread.currentThread().interrupt();
            throw new RequestAbortedException("Request aborted", interrupted);
  }
尴尬,永久不失效,代表的就是:如果没有获取到Connection,线程会一直等待,一直未发送到第三方。这就是我们看到为什么发送日志,是正常的但是,没有返回的Response并且第三方也没有收到请求。
三、优化方案
1) 上面已经找到问题, 我开始验证,我的想法。 我先写了一个server端, 并且让所有请求都暂停1分钟,模拟第三方返回延迟 。
  AtomicInteger count = new AtomicInteger();

    @RequestMapping(path = "/{id}", method = RequestMethod.GET)
    @ResponseBody
    public Coffee getById(@PathVariable Long id) {

       int counts = count.incrementAndGet();
        log.info("counts {}:", counts);
        log.info("request {}:", id);
        try {
            Thread.sleep(60000);
        }catch (Exception e){
            e.printStackTrace();
        }
        Coffee coffee = coffeeService.getCoffee(id);
        return coffee;
    }
2)我用故障服务代码写了一个http请求
public class HttpTimeOutCase {
     // 用3000个线程模拟并发
    public static void main(String args[]) {
        for (int i = 0; i < 3000; i++) {
            try {
                R r = new R();
                System.err.println(r.getName());
                r.start();
            } catch (Exception e) {
                e.printStackTrace();
            }
        }
        System.err.println("finish");
    }

    protected static class R extends Thread {
        @Override
        public void run() {
            try {
                Map<String, String> map = new HashMap<>();
                String url = "http://localhost:8080/coffee/" + 1;
                HttpRequest request = new HttpRequest(url, MethodType.GET, map);
                request.setParamType(ParamType.X_WWW_FORM_URLENCODED);
                Map<String, String> rspData = HttpClientsInstance.INSTANCE.getInstance().send(request);
            } catch (Exception e) {
                e.printStackTrace();
            }
        }
    }
}
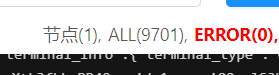
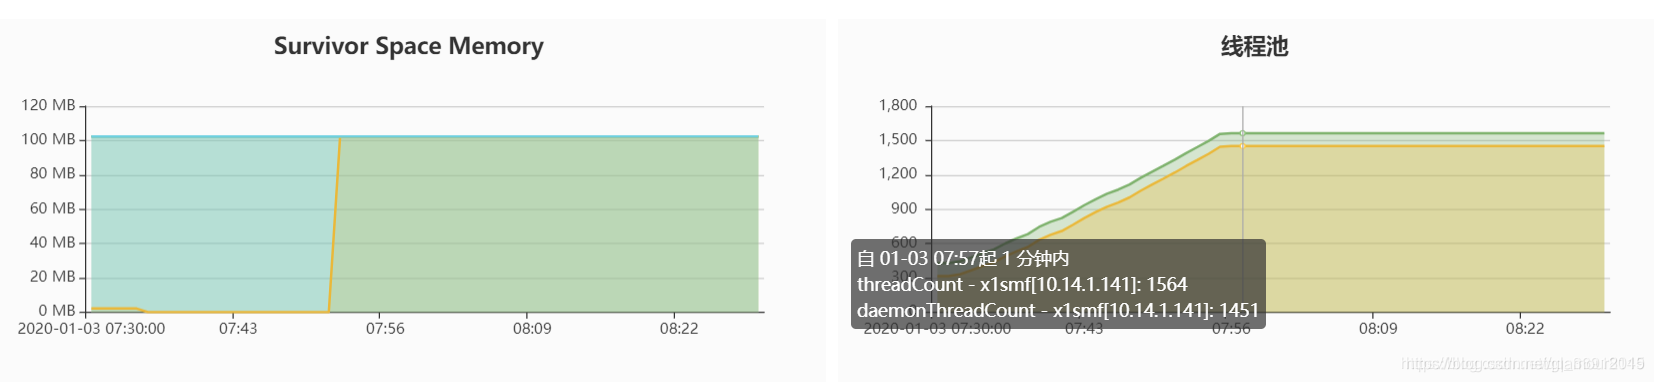
3)我们先试一下没有设置ConnectionRequestTimeout的情况,没有获取到connection的线程一直等待中
每个请求,都是一个线程,所以看到线程数量最高的时候是2200个,如果是生产环境节点,这个线程数容器肯定死机了。
最后我们消费端将3000个请求都消费掉

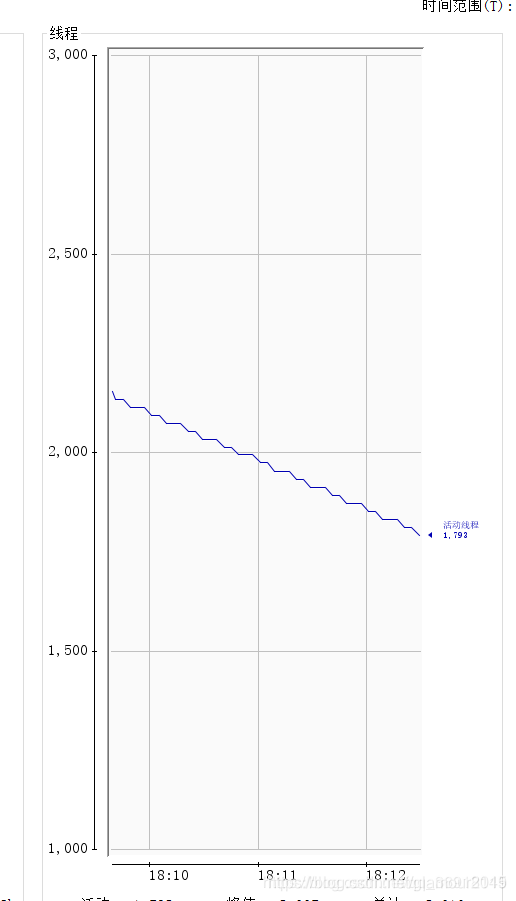
4)我们试一下设置ConnectionRequestTimeout的情况,没有获取到connection的线程20s后超时
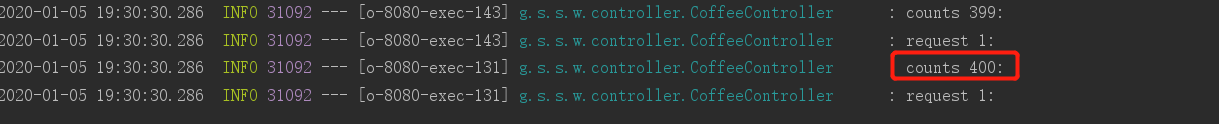
处理了400个请求, 其它并发的2600线程在客户端已经超时,现在最大连接数是200,连接超时时间是10s,服务端延迟时间是10s,所以处理了 2*200条请求。设置获取连接超时时间,可以避免服务死机,但可能导致部分请求失败。
5)在我们容器中Tomcat线程数默认是1000,所以将ConnectionRequestTimeout设置为50s
四、总结
1)整个故障排查的思路不够清晰,导致排查了很久
2)如果现在重新来排查
查看日志,是否有正常发送http请求
联系第三方排查是否接收到请求
故障节点出现死机的时候,应该联系运维马上重新发布一组服务,优先恢复业务
应该在故障节点上ping /wget 第三方域名,检查网络
用jps 和 jstack 命令查看线程情况
用jmap 导出堆栈信息
参考:https://blog.csdn.net/qq_36918149/article/details/103844397


 1万+
1万+


 被折叠的 条评论
为什么被折叠?
被折叠的 条评论
为什么被折叠?
 到【灌水乐园】发言


