ios view的frame和bounds之区别(位置和大小)

转自:http://blog.csdn.net/mad1989/article/details/8711697

一、首先列一下公认的资料:

先看到下面的代码你肯定就明白了一些:
-(CGRect)frame{
    return CGRectMake(self.frame.origin.x,self.frame.origin.y,self.frame.size.width,self.frame.size.height);
}
-(CGRect)bounds{
    return CGRectMake(0,0,self.frame.size.width,self.frame.size.height);
}
很明显,bounds的原点是(0,0)点(就是view本身的坐标系统,默认永远都是0,0点,除非认为setbounds),而frame的原点却是任意的(相对于父视图中的坐标位置)。


再来看张图就明白了,


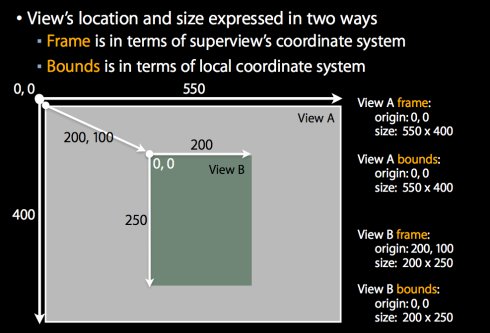
        frame: 该view在父view坐标系统中的位置和大小。(参照点是,父亲的坐标系统)
        bounds:该view在本地坐标系统中的位置和大小。(参照点是,本地坐标系统,就相当于ViewB自己的坐标系统,以0,0点为起点)
        center:该view的中心点在父view坐标系统中的位置和大小。(参照电是,父亲的坐标系统)

我个人认为,bounds稍微有点费解,稍不留神,想的多了,就会绕进去。每个view都有一个本地坐标系统。这个坐标系统作用比较重要,比如触 摸的回调函数中的UITouch里面的>坐标值都是参照这个本地坐标系统的坐标。当然bounds这个属性也是参照这个本地坐标系统来的。其实本地 坐标系统的关键就是要知道的它的原点(0,0)在什么位置(这个位置又是相对于上层的view的本地坐标系统而言的,当然最上面的一层view就是 window它的本地坐标系统原点就是屏幕的左上角了)。通过修改view的bounds属性可以修改本地坐标系统的原点位置。


所以,我个人认为,bounds影响到子view的位置和大小。


二、demo演示:

[cpp]  view plain copy
  1. UIView *view1 = [[UIView alloc] initWithFrame:CGRectMake(20, 20, 280, 250)];  
  2. [view1 setBounds:CGRectMake(-20, -20, 280, 250)];  
  3. view1.backgroundColor = [UIColor redColor];  
  4. [self.view addSubview:view1];//添加到self.view  
  5. NSLog(@"view1 frame:%@========view1 bounds:%@",NSStringFromCGRect(view1.frame),NSStringFromCGRect(view1.bounds));  
  6.   
  7. UIView *view2 = [[UIView alloc] initWithFrame:CGRectMake(0, 0, 100, 100)];  
  8. view2.backgroundColor = [UIColor yellowColor];  
  9. [view1 addSubview:view2];//添加到view1上,[此时view1坐标系左上角起点为(-20,-20)]  
  10. NSLog(@"view2 frame:%@========view2 bounds:%@",NSStringFromCGRect(view2.frame),NSStringFromCGRect(view2.bounds));  


(运行展示,图中说的很明白了哦)


(log输出日志表明,每个新的view默认的bounds其实都是(0,0))


  • 0
    点赞
  • 0
    收藏
    觉得还不错? 一键收藏
  • 0
    评论
下面是一个简单的 iOS 自定义 View 实现 K 线图的示例代码: ```swift import UIKit class KLineChartView: UIView { // K线图数据 var data: [KLineChartData] = [] // K线图相关配置 var config: KLineChartConfig = KLineChartConfig() // Y轴最大值 var yAxisMaxValue: CGFloat = 0 // Y轴最小值 var yAxisMinValue: CGFloat = 0 override func draw(_ rect: CGRect) { super.draw(rect) guard let context = UIGraphicsGetCurrentContext() else { return } // 绘制背景色 context.setFillColor(config.backgroundColor.cgColor) context.fill(rect) // 计算 Y 轴最大值和最小值 calculateYAxisValue() // 绘制 Y 轴 drawYAxis(context: context) // 绘制 K 线图 drawKLineChart(context: context) } // 计算 Y 轴最大值和最小值 private func calculateYAxisValue() { var maxValue: CGFloat = 0 var minValue: CGFloat = CGFloat.greatestFiniteMagnitude for item in data { if item.high > maxValue { maxValue = item.high } if item.low < minValue { minValue = item.low } } yAxisMaxValue = maxValue yAxisMinValue = minValue } // 绘制 Y 轴 private func drawYAxis(context: CGContext) { context.setStrokeColor(config.yAxisColor.cgColor) context.setLineWidth(config.yAxisLineWidth) // 计算 Y 轴刻度值 let stepValue = (yAxisMaxValue - yAxisMinValue) / CGFloat(config.yAxisTickCount - 1) for i in 0..<config.yAxisTickCount { // 计算 Y 轴刻度值对应的坐标 let y = bounds.height - CGFloat(i) / CGFloat(config.yAxisTickCount - 1) * bounds.height // 绘制 Y 轴刻度线 context.move(to: CGPoint(x: 0, y: y)) context.addLine(to: CGPoint(x: config.yAxisTickLength, y: y)) context.strokePath() // 绘制 Y 轴刻度值 let textRect = CGRect(x: 0, y: y - config.yAxisTickTextSize / 2, width: config.yAxisTickTextSize, height: config.yAxisTickTextSize) let text = String(format: "%.2f", yAxisMinValue + CGFloat(i) * stepValue) let attributes: [NSAttributedString.Key: Any] = [.foregroundColor: config.yAxisTextColor, .font: UIFont.systemFont(ofSize: config.yAxisTickTextSize)] let attributedText = NSAttributedString(string: text, attributes: attributes) attributedText.draw(in: textRect) } } // 绘制 K 线图 private func drawKLineChart(context: CGContext) { let barWidth = bounds.width / CGFloat(data.count) for (index, item) in data.enumerated() { let x = CGFloat(index) * barWidth + barWidth / 2 let highY = bounds.height - (item.high - yAxisMinValue) / (yAxisMaxValue - yAxisMinValue) * bounds.height let lowY = bounds.height - (item.low - yAxisMinValue) / (yAxisMaxValue - yAxisMinValue) * bounds.height let openY = bounds.height - (item.open - yAxisMinValue) / (yAxisMaxValue - yAxisMinValue) * bounds.height let closeY = bounds.height - (item.close - yAxisMinValue) / (yAxisMaxValue - yAxisMinValue) * bounds.height // 绘制 K 线图 context.setStrokeColor(item.color.cgColor) context.setLineWidth(config.kLineWidth) context.move(to: CGPoint(x: x, y: highY)) context.addLine(to: CGPoint(x: x, y: lowY)) context.strokePath() // 绘制 K 线实体 if item.close > item.open { context.setFillColor(config.riseColor.cgColor) } else { context.setFillColor(config.fallColor.cgColor) } let bodyRect = CGRect(x: x - config.kLineBodyWidth / 2, y: min(openY, closeY), width: config.kLineBodyWidth, height: abs(openY - closeY)) context.fill(bodyRect) } } } // K线图数据结构体 struct KLineChartData { var open: CGFloat = 0 // 开盘价 var close: CGFloat = 0 // 收盘价 var high: CGFloat = 0 // 最高价 var low: CGFloat = 0 // 最低价 var color: UIColor = .black // 颜色 } // K线图配置 struct KLineChartConfig { var backgroundColor: UIColor = .white // 背景色 var yAxisColor: UIColor = .black // Y轴颜色 var yAxisLineWidth: CGFloat = 1 // Y轴线宽 var yAxisTextColor: UIColor = .black // Y轴文本颜色 var yAxisTickTextSize: CGFloat = 10 // Y轴刻度值文本大小 var yAxisTickCount: Int = 5 // Y轴刻度值数量 var yAxisTickLength: CGFloat = 5 // Y轴刻度线长度 var kLineWidth: CGFloat = 1 // K线线宽 var kLineBodyWidth: CGFloat = 6 // K线实体宽度 var riseColor: UIColor = .red // 上涨颜色 var fallColor: UIColor = .green // 下跌颜色 } ``` 使用方法: ```swift let kLineChartView = KLineChartView(frame: CGRect(x: 0, y: 0, width: 300, height: 200)) kLineChartView.data = [ KLineChartData(open: 100, close: 120, high: 125, low: 95, color: .black), KLineChartData(open: 120, close: 110, high: 135, low: 105, color: .black), KLineChartData(open: 110, close: 130, high: 140, low: 100, color: .black), KLineChartData(open: 130, close: 115, high: 145, low: 110, color: .black), KLineChartData(open: 115, close: 125, high: 130, low: 105, color: .black), KLineChartData(open: 125, close: 135, high: 140, low: 120, color: .black), KLineChartData(open: 135, close: 120, high: 145, low: 115, color: .black), ] kLineChartView.config.yAxisTickCount = 5 kLineChartView.config.kLineBodyWidth = 4 kLineChartView.config.riseColor = .red kLineChartView.config.fallColor = .green view.addSubview(kLineChartView) ```
评论
添加红包

请填写红包祝福语或标题

红包个数最小为10个

红包金额最低5元

当前余额3.43前往充值 >
需支付:10.00
成就一亿技术人!
领取后你会自动成为博主和红包主的粉丝 规则
hope_wisdom
发出的红包
实付
使用余额支付
点击重新获取
扫码支付
钱包余额 0

抵扣说明:

1.余额是钱包充值的虚拟货币,按照1:1的比例进行支付金额的抵扣。
2.余额无法直接购买下载,可以购买VIP、付费专栏及课程。

余额充值