# coding:utf-8
import numpy as np
import matplotlib.pyplot as plt
import Utils as utils
import pandas as pd
mypareto_path = './data/TestResult/DTLZ2/'
NSGAII_PARETO = mypareto_path+'NSGAII_PARETO.csv'
NSGAII = mypareto_path+'NSGAII.csv'
SMOCDE = mypareto_path+'SMOCDE.csv'
SMOCDE_PARETO = mypareto_path+'SMOCDE_PARETO.csv'
MOEAD = mypareto_path+'MOEAD.csv'
MOEAD_PARETO = mypareto_path+'MOEAD_PARETO.csv'
NSGAII = pd.read_csv(NSGAII,nrows =250)
SMOCDE = pd.read_csv(SMOCDE,nrows =250)
MOEAD = pd.read_csv(MOEAD,nrows =250)
print(len(NSGAII))
print("NSGAII:",NSGAII.shape)
print("SMOCDE:",SMOCDE.shape)
print("MOEAD:",MOEAD.shape)
print(NSGAII.dtypes)
print(SMOCDE.dtypes)
print(MOEAD.dtypes)
y11 = list(NSGAII['GD.csv'])
y12 = list(NSGAII['IGD'])
y13 = list(NSGAII['Hypervolume'])
y14 = list(NSGAII['Spread'])
y21 = list(SMOCDE['GD.csv'])
y22 = list(SMOCDE['IGD'])
y23 = list(SMOCDE['Hypervolume'])
y24 = list(SMOCDE['Spread'])
y41 = list(MOEAD['GD.csv'])
y42 = list(MOEAD['IGD'])
y43 = list(MOEAD['Hypervolume'])
y44 = list(MOEAD['Spread'])
t = [i for i in range(1,251)]
plt.figure()
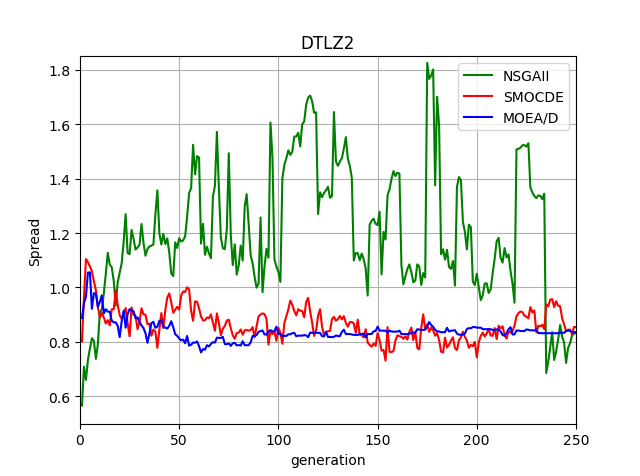
plt.plot(t,y14,"g-",label="NSGAII")
plt.plot(t,y24,"r-",label="SMOCDE")
plt.plot(t,y44,"b-",label="MOEA/D")
plt.axis([0,250,0.5,1.2])
plt.xlabel("generation")
plt.ylabel("Spread")
plt.title("DTLZ2")
plt.grid(True)
plt.legend()
plt.show()


 3394
3394


 被折叠的 条评论
为什么被折叠?
被折叠的 条评论
为什么被折叠?
 到【灌水乐园】发言


