


Go语言自带了强大的性能测试工具pprof,位于 net/http 包下的 pprof。 官方文档
PProf 关注的模块
- CPU profile:报告程序的 CPU 使用情况,按照一定频率去采集应用程序在 CPU 和寄存器上面的数据
- Memory Profile(Heap Profile):报告程序的内存使用情况
- Block Profiling:报告 goroutines 不在运行状态的情况,可以用来分析和查找死锁等性能瓶颈
- Goroutine Profiling:报告 goroutines 的使用情况,有哪些 goroutine,它们的调用关系是怎样的
PProf 使用方式
PProf 主要涉及两个包:“net/http/pprof”、“runtime/pprof”。
net/http/pprof:只是使用runtime/pprof包来进行封装了一下,并在http端口上暴露出来。使用 net/http/pprof 可以做到直接看到当前 web 服务的状态,包括 CPU 占用情况和内存使用情况等。如果服务是一直运行的,如 web 应用,可以很方便的使用第一种方式 import "net/http/pprof"。
runtime/pprof:可以用来产生 dump 文件,再使用 Go Tool PProf 来分析这运行日志。
引入示例:
#web服务器:
import (
    "net/http"
    _ "net/http/pprof"
)

#一般应用程序(实际应用无web交互)
import (
    "net/http"
    _ "runtime/pprof"
)
下面主要介绍web收集PProf信息方式
使用示例:
package main

import (
	"fmt"
	"log"
	"net/http"
	_ "net/http/pprof"
	"time"
)

func sayHelloHandler(w http.ResponseWriter, r *http.Request) {
	hellowold(10000)
	fmt.Println("path", r.URL.Path)
	fmt.Println("scheme", r.URL.Scheme)
	fmt.Fprintf(w, "Hello world!\n") //这个写入到w的是输出到客户端的
}

func main() {
	http.HandleFunc("/", sayHelloHandler) //	设置访问路由
	log.Fatal(http.ListenAndServe(":8080", nil))
}

func hellowold(times int) {
	time.Sleep(time.Second)
	var counter int
	for i := 0; i < times; i++ {
		for j := 0; j < times; j++ {
			counter++
		}
	}
}
访问:http://127.0.0.1:8080/debug/pprof/
输出:
/debug/pprof/

profiles:
0	block
4	goroutine
2	heap
0	mutex
5	threadcreate

full goroutine stack dump
这个路径下还有几个子页面:
-
/debug/pprof/profile:访问这个链接会自动进行 CPU profiling,持续 30s,并生成一个文件供下载。 -
/debug/pprof/cmdline获取程序启动时的命令及参数。 -
/debug/pprof/symbol根据传入的程序计数器(PC)的值,获取对应的函数的名称信息,调用了runtime包的FuncForPC获取对应的函数信息。可以传入多个PC值,以加号作为连接符号,比如访问:http://127.0.0.1:8080/debug/pprof/symbol?0x4e667d+0x6ec770, 返回PC值与函数对应名称的信息。 -
/debug/pprof/trace此接口用于获取程序执行中的事件跟踪信息,比如协程、系统调用、GC、堆大小改变等事件,大多数事件的跟踪精确度能达到纳秒级别,后端调用了runtime包的StartTrace,会进行一个STW的操作。获取数据的时长默认为1秒,可以通过seconds参数进行修改。先通过以下命令获取数据:wget http://127.0.0.1:8080/debug/pprof/trace?seconds=10 -O tracefile
然后执行go tool trace tacefile进行数据分析。
-
/debug/pprof/block:block Profiling 的路径。 -
/debug/pprof/goroutines:运行的 goroutines 列表,以及调用关系。 -
/debug/pprof/heap: Memory Profiling 的路径,访问这个链接会得到一个内存 Profiling 结果的文件。 -
/debug/pprof/threadcreate查看线程创建信息。
Go tool pprof 分析工具(图形工具graphviz为例)
Go Tool PProf 工具可以对以上链接下载的 prof 文件进行更详细的分析,可以生成调用关系图和火焰图。
centos 7.5 下安装graphviz
yum install 'graphviz*' --skip-broken
–skip-broken可选:跳过错误依赖,不加这个参数会提示安装包依赖错误,因为这里并不需要其它的安装包,所以跳过即可。
其他系统安装方式可参考:官网
Go tool pprof常用基本调试基本命令(默认30s采集时间,可通过–seconds)
下面以cpu信息分析为例:
通过执行
go tool pprof --text http://127.0.0.1:8080/debug/pprof/profile
生成profile压缩gz文件(一般在/root/pprof目录下的.gz),选择文件进入交互,或执行一下命令(注意:执行的过程,访问一下http://localhost:8080/,这样会得到相应的监测数据)
go tool pprof http://localhost:8080/debug/pprof/profile
Fetching profile over HTTP from http://localhost:8080/debug/pprof/profile
Saved profile in /root/pprof/pprof.main.samples.cpu.002.pb.gz
File: main
Type: cpu
Time: Dec 14, 2018 at 3:26pm (CST)
Duration: 30s, Total samples = 60ms (  0.2%)
Entering interactive mode (type "help" for commands, "o" for options)
(pprof)
输入top
(pprof) top
Showing nodes accounting for 60ms, 100% of 60ms total
      flat  flat%   sum%        cum   cum%
      60ms   100%   100%       60ms   100%  main.hellowold /home/go/src/example/main.go
         0     0%   100%       60ms   100%  main.sayHelloHandler /home/go/src/example/main.go
         0     0%   100%       60ms   100%  net/http.(*ServeMux).ServeHTTP /usr/lib/golang/src/net/http/server.go
         0     0%   100%       60ms   100%  net/http.(*conn).serve /usr/lib/golang/src/net/http/server.go
         0     0%   100%       60ms   100%  net/http.HandlerFunc.ServeHTTP /usr/lib/golang/src/net/http/server.go
         0     0%   100%       60ms   100%  net/http.serverHandler.ServeHTTP /usr/lib/golang/src/net/http/server.go
(pprof)
可以看到 main.hellowold 是用cpu最多。
输入 web #生成调用关系图
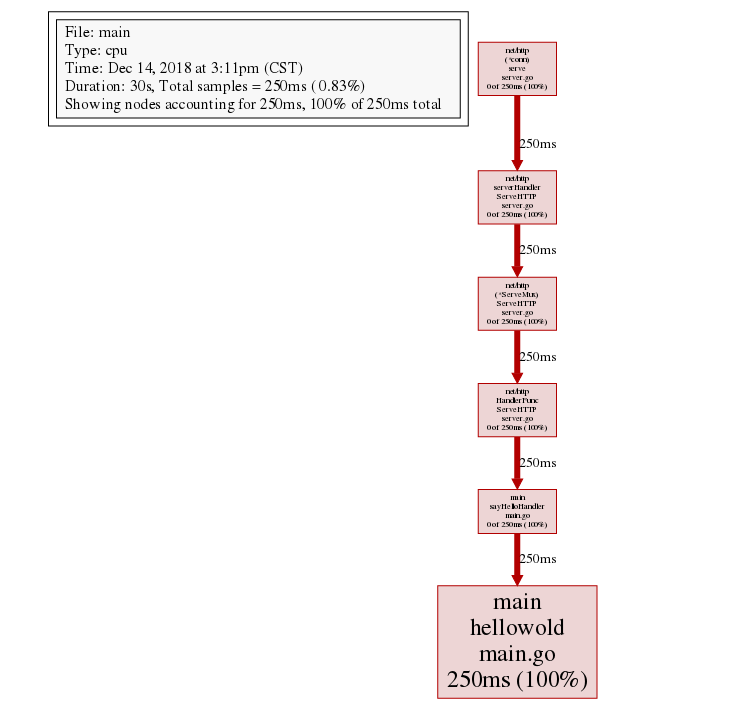
如查看历史调试文件信息,通过指定的profile文件进入(pprof)即可:
例如:
go tool pprof /root/pprof/pprof.main.samples.cpu.001.pb.gz
File: main
Type: cpu
Time: Dec 14, 2018 at 11:37am (CST)
Duration: 29.99s, Total samples = 0
Entering interactive mode (type “help” for commands, “o” for options)
(pprof)
如果想查看pprof其他命令,可输入help。
生成火焰图 (官方:https://github.com/uber/go-torch)
从Go 1.11开始,火焰图形可视化go tool pprof直接可用!
# This will listen on :8081 and open a browser.
# Change :8081 to a port of your choice.
$ go tool pprof -http=":8081" [binary] [profile]
如果你不能使用Go 1.11,你可以获得最新的pprof工具并使用它:
# Get the pprof tool directly
$ go get -u github.com/google/pprof

$ pprof -http=":8081" [binary] [profile]
我的golang 版本 v 1.11,所以只执行以下命令:(注意:在执行以下命令过程,访问一下http://localhost:8080/,消耗以下性能)
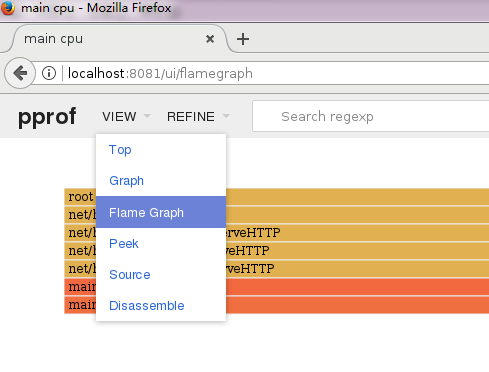
go tool pprof -http=":8081" http://localhost:8080/debug/pprof/profile
Fetching profile over HTTP from http://localhost:8080/debug/pprof/profile
Saved profile in /root/pprof/pprof.main.samples.cpu.007.pb.gz
过一会儿会产生个web窗口

选择 VIEW->Flame Graph 得到火焰图形


 1364
1364

 被折叠的 条评论
为什么被折叠?
被折叠的 条评论
为什么被折叠?
 到【灌水乐园】发言


