


一 整体架构
 整个架构,分成上、下、左、右四部分:
- 上部分 Agent :负责从应用中,收集链路信息,发送给 SkyWalking OAP 服务器。目前支持 SkyWalking、Zikpin、Jaeger 等提供的 Tracing 数据信息。而我们目前采用的是,SkyWalking Agent 收集 SkyWalking Tracing 数据,传递给服务器。
- 下部分 SkyWalking OAP :负责接收 Agent 发送的 Tracing 数据信息,然后进行分析(Analysis Core) ,存储到外部存储器( Storage ),最终提供查询( Query )功能。
- 右部分 Storage :Tracing 数据存储。目前支持 ES、MySQL、Sharding Sphere、TiDB、H2 多种存储器。而我们目前采用的是 ES ,主要考虑是 SkyWalking 开发团队自己的生产环境采用 ES 为主。
- 左部分 SkyWalking UI :负责提供控台,查看链路等等。
二 安装
已验证skywalking9.6.0,centos7.0, MySQL8.0.26
2.1 jdk安装
-
Skywalking9.6.0需要jdk9+及以上
- 下载解压到/usr/local/java/jdk11
- 配置环境变量
# 打开文件
vim /etc/profile
# 在文件最后加上
JAVA_HOME=/usr/local/java/jdk11
PATH=$PATH:$JAVA_HOME/bin
# 保存退出
# 应用修改
source /etc/profile
# 验证:
java -version
2.2 安装skywalking
2.2.1 运行
-
进入/usr/local/skywalking/bin目录
运行oapService
./oapService.sh &运行ui webappService,默认端口8080
./webappService.sh & -
验证运行结果
[root@localhost bin]# jps
6099 Jps
18824 OAPServerStartUp
9817 ApplicationStartUp
# 查看访问
[root@localhost bin]# curl localhost:8080
浏览器访问IP:8080(防火墙开启端口)
2.2.2 结果

三 配置
3.1 数据库
-
skywalking 默认使用h2数据库,基于内容的数据库,重启服务后数据重置,修改存储,支持数据持久化
-
修改/usr/local/skywalking/config/application.yaml
# line 159
storage:
  selector: ${SW_STORAGE:h2}
-
修改为mysql ,我这里用的MySQL8.0.26
# line 159
storage:
  selector: ${SW_STORAGE:mysql}
  # line 191 变更自己的库名,添加驱动包名
    mysql:
    properties:
      jdbcUrl: ${SW_JDBC_URL:"jdbc:mysql://yourIP:3306/swtest?rewriteBatchedStatements=true&allowMultiQueries=true"}
      dataSource.user: ${SW_DATA_SOURCE_USER:root}
      dataSource.password: ${SW_DATA_SOURCE_PASSWORD:your password}
      dataSource.cachePrepStmts: ${SW_DATA_SOURCE_CACHE_PREP_STMTS:true}
      dataSource.prepStmtCacheSize: ${SW_DATA_SOURCE_PREP_STMT_CACHE_SQL_SIZE:250}
      dataSource.prepStmtCacheSqlLimit: ${SW_DATA_SOURCE_PREP_STMT_CACHE_SQL_LIMIT:2048}
      dataSource.useServerPrepStmts: ${SW_DATA_SOURCE_USE_SERVER_PREP_STMTS:true}
    metadataQueryMaxSize: ${SW_STORAGE_MYSQL_QUERY_MAX_SIZE:5000}
    maxSizeOfBatchSql: ${SW_STORAGE_MAX_SIZE_OF_BATCH_SQL:2000}
    asyncBatchPersistentPoolSize: ${SW_STORAGE_ASYNC_BATCH_PERSISTENT_POOL_SIZE:4}
    driver: com.mysql.cj.jdbc.Driver
    # 保存退出,配置修改完成
-
添加MySQL8驱动包到路径/usr/local/skywalking/oap-libs/下
-
重启oapService服务验证,是否正常运行
- jps
- kill -9 pid (oapService的)
- 重启oapService
3.2 访问端口修改
- 修改文件/usr/local/skywalking/webapp/application
- 重启webappService服务
- jps
- kill -9 pid(webappService的)
- 重启webappService
四 监控
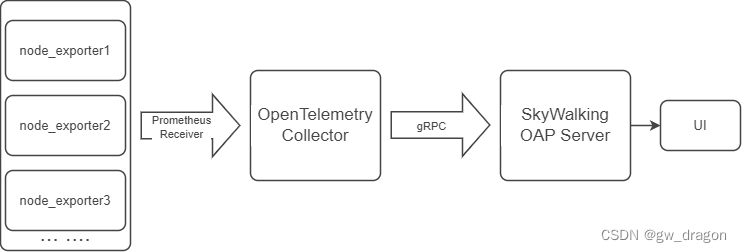
- Prometheus 节点导出器从虚拟机收集指标数据。
- OpenTelemetry Collector 通过 Prometheus Receiver 从 node-exporter 获取指标,并通过 OpenTelemetry gRPC 导出器将指标推送到 SkyWalking OAP Server。
- SkyWalking OAP Server 使用 MAL 解析表达式,以过滤/计算/聚合和存储结果。
4.1 self-observability自监控
4.1.1 节点导出器
-
修改配置文件/usr/local/skywalking/config/application.yaml
# line 452
telemetry:
  selector: ${SW_TELEMETRY:prometheus}
  none:
  prometheus:
    host: ${SW_TELEMETRY_PROMETHEUS_HOST:0.0.0.0}
    port: ${SW_TELEMETRY_PROMETHEUS_PORT:1234}
    sslEnabled: ${SW_TELEMETRY_PROMETHEUS_SSL_ENABLED:false}
    sslKeyPath: ${SW_TELEMETRY_PROMETHEUS_SSL_KEY_PATH:""}
    sslCertChainPath: ${SW_TELEMETRY_PROMETHEUS_SSL_CERT_CHAIN_PATH:""}
-
重启oapService服务。
4.1.2 节点收集器
-
安装OpenTelemetry Collector
# RPM Installation
sudo yum update
sudo yum -y install wget systemctl
wget https://github.com/open-telemetry/opentelemetry-collector-releases/releases/download/v0.89.0/otelcol_0.89.0_linux_amd64.rpm
sudo rpm -ivh otelcol_0.89.0_linux_amd64.rpm
-
修改OpenTelemetry Collector配置文件
-
创建自己的配置文件otel-collection-config.yaml (/etc/otelcol/)
receivers:
  prometheus:
    config:
      scrape_configs:
        - job_name: "skywalking-so11y"
          scrape_interval: 10s
          static_configs:
            - targets: ["0.0.0.0:1234"]
              labels:
                host_name: vmlinux
                service: self-observability
processors:
  batch:

exporters:
  otlp:
    endpoint: "your IP:11800" # The OAP Server address
    tls:
      insecure: true
  logging:
    loglevel: debug
service:
  pipelines:
    metrics:
      receivers: [prometheus]
      processors: [batch]
      exporters: [otlp, logging]
-
修改OpenTelemetry Collector启动记载配置文件/etc/otelcol/otelcol.conf指向新建的otel-collection-config.yaml
# Systemd environment file for the otelcol service
# Command-line options for the otelcol service.
# Run `/usr/bin/otelcol --help` to see all available options.
# OTELCOL_OPTIONS="--config=/etc/otelcol/config.yaml"
OTELCOL_OPTIONS="--config=/etc/otelcol/otel-collector-config.yaml"
-
重启OpenTelemetry Collector
systemctl restart otelcol
-
4.1.3 访问查看

4.2 基础设施监控-Linux
4.2.1 节点导出器
- 安装并运行节点导出器
wget https://github.com/prometheus/node_exporter/releases/download/v1.7.0/node_exporter-1.7.0.linux-amd64.tar.gz
tar xvfz node_exporter-1.7.0.linux-amd64.tar.gz
mkdir /usr/local/skywalking/exporter
mv node_exporter-1.7.0.linux-amd6 /usr/local/skywalking/exporter/node_exporter
cd node_exporter
nohup ./node_exporter > /usr/local/skywalking/exporter/node_exporter/node_exporter.log 2>&1 &
# 验证
curl 127.0.0.1:9100
4.2.2 节点收集器
- 修改OpenTelemetry Collector配置文件otel-collection-config.yaml
receivers:
  prometheus:
    config:
      scrape_configs:
        - job_name: "vm-monitoring"
          scrape_interval: 10s
          static_configs:
            - targets: ["0.0.0.0:9100"]
              labels:
                node_identifier_host_name: vm-machine
        - job_name: "skywalking-so11y"
          scrape_interval: 10s
          static_configs:
            - targets: ["0.0.0.0:1234"]
              labels:
                host_name: vmlinux
                service: self-observability
processors:
  batch:

exporters:
  otlp:
    endpoint: "you IP:11800" # The OAP Server address
    tls:
      insecure: true
  logging:
    loglevel: debug
service:
  pipelines:
    metrics:
      receivers: [prometheus]
      processors: [batch]
      exporters: [otlp, logging]
- 重启OpenTelemetry Collector
systemctl restart otelcol
4.2.3 查看访问

4.3 数据库-Redis
4.3.1 节点导出器
wget https://github.com/oliver006/redis_exporter/releases/download/v1.55.0/redis_exporter-v1.55.0.linux-amd64.tar.gz
tar xvfz redis_exporter-v1.55.0.linux-amd64.tar.gz
mv node_exporter-1.7.0.linux-amd6 /usr/local/skywalking/exporter/redis_exporter
cd redis_exporter
nohup ./redis_exporter -redis.password="your password" > /usr/local/skywalking/exporter/redis_exporter/redis_exporter.log 2>&1 &
# 验证
curl 127.0.0.1:9100
4.3.2 节点导入器
-
修改OpenTelemetry Collector配置文件otel-collection-config.yaml
receivers:
  prometheus:
    config:
      scrape_configs:
        - job_name: "vm-monitoring"
          scrape_interval: 10s
          static_configs:
            - targets: ["0.0.0.0:9100"]
              labels:
                node_identifier_host_name: vm-machine
        - job_name: "skywalking-so11y"
          scrape_interval: 10s
          static_configs:
            - targets: ["0.0.0.0:1234"]
              labels:
                host_name: vmlinux
                service: self-observability
        - job_name: "redis-monitoring"
          scrape_interval: 10s
          static_configs:
            - targets: ["0.0.0.0:9121"]
              labels:
                host_name: redis
processors:
  batch:

exporters:
  otlp:
    endpoint: "your IP:11800" # The OAP Server address
    tls:
      insecure: true
  logging:
    loglevel: debug
service:
  pipelines:
    metrics:
      receivers: [prometheus]
      processors: [batch]
      exporters: [otlp, logging]
-
重启OpenTelemetry Collector
systemctl restart otelcol
4.3.3 访问查看

4.4 数据库-MySQL
4.4.1 节点导出器
- 创建MySQL监控账号并授权
CREATE USER 'mysql_exporter'@'%' IDENTIFIED BY 'your password' WITH MAX_USER_CONNECTIONS 3;
GRANT PROCESS, REPLICATION CLIENT, SELECT ON *.* TO 'mysql_exporter'@'%';
FLUSH PRIVILEGES;
- mysqld_exporter.conf
[client]
user=mysql_exporter
password=your password
- 启动mysql_exporter
wget https://github.com/prometheus/mysqld_exporter/releases/download/v0.15.0/mysqld_exporter-0.15.0.linux-amd64.tar.gz
tar xvfz mysqld_exporter-0.15.0.linux-amd64.tar.gz
mv mysqld_exporter-0.15.0.linux-amd64 /usr/local/skywalking/exporter/mysqld_exporter
cd mysqld_exporter
# 创建配置MySQL监控账号的文件/usr/local/skywalking/exporter/mysqld_exporter/mysqld_exporter.conf
nohup ./mysqld_exporter --config.my-cnf="mysqld_exporter.conf" > /usr/local/skywalking/exporter/mysql_exporter/mysql_exporter.log 2>&1 &
# 验证
curl 127.0.0.1:9104
4.4.2 节点接收器
-
修改OpenTelemetry Collector配置文件otel-collection-config.yaml
receivers: prometheus: config: scrape_configs: - job_name: "vm-monitoring" scrape_interval: 10s static_configs: - targets: ["0.0.0.0:9100"] labels: node_identifier_host_name: vm-machine - job_name: "skywalking-so11y" scrape_interval: 10s static_configs: - targets: ["0.0.0.0:1234"] labels: host_name: vmlinux service: self-observability - job_name: "mysql-monitoring" scrape_interval: 10s static_configs: - targets: ["0.0.0.0:9104"] labels: host_name: mysql8 - job_name: "redis-monitoring" scrape_interval: 10s static_configs: - targets: ["0.0.0.0:9121"] labels: host_name: redis processors: batch: exporters: otlp: endpoint: "your IP:11800" # The OAP Server address tls: insecure: true logging: loglevel: debug service: pipelines: metrics: receivers: [prometheus] processors: [batch] exporters: [otlp, logging]-
重启OpenTelemetry Collector
systemctl restart otelcol
-
4.4.3 访问查看


 545
545


 被折叠的 条评论
为什么被折叠?
被折叠的 条评论
为什么被折叠?
 到【灌水乐园】发言


