


绘图结构基础概念
Figure:相当于“画布”。包含所有的子 Axes(有时候不止一个坐标系)。
Axes:一套坐标轴,相当于“坐标系”/子图。当只有一个 Axes 的时候,plt.plot() 和 ax.plot() 是在同一个图形上绘图;当有多个 Axes 的时候,最好采用 ax.plot() 绘图。
Axis:坐标轴。包含刻度(tick)标签(label)
Artist:figure 上所有的对象内容。所有 artist 属性都可以用 ax.set_xxx 和 ax.get_xxx 来设置和获取。
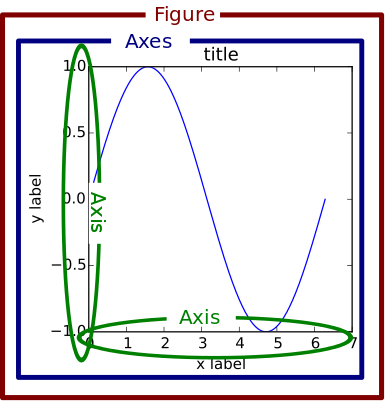
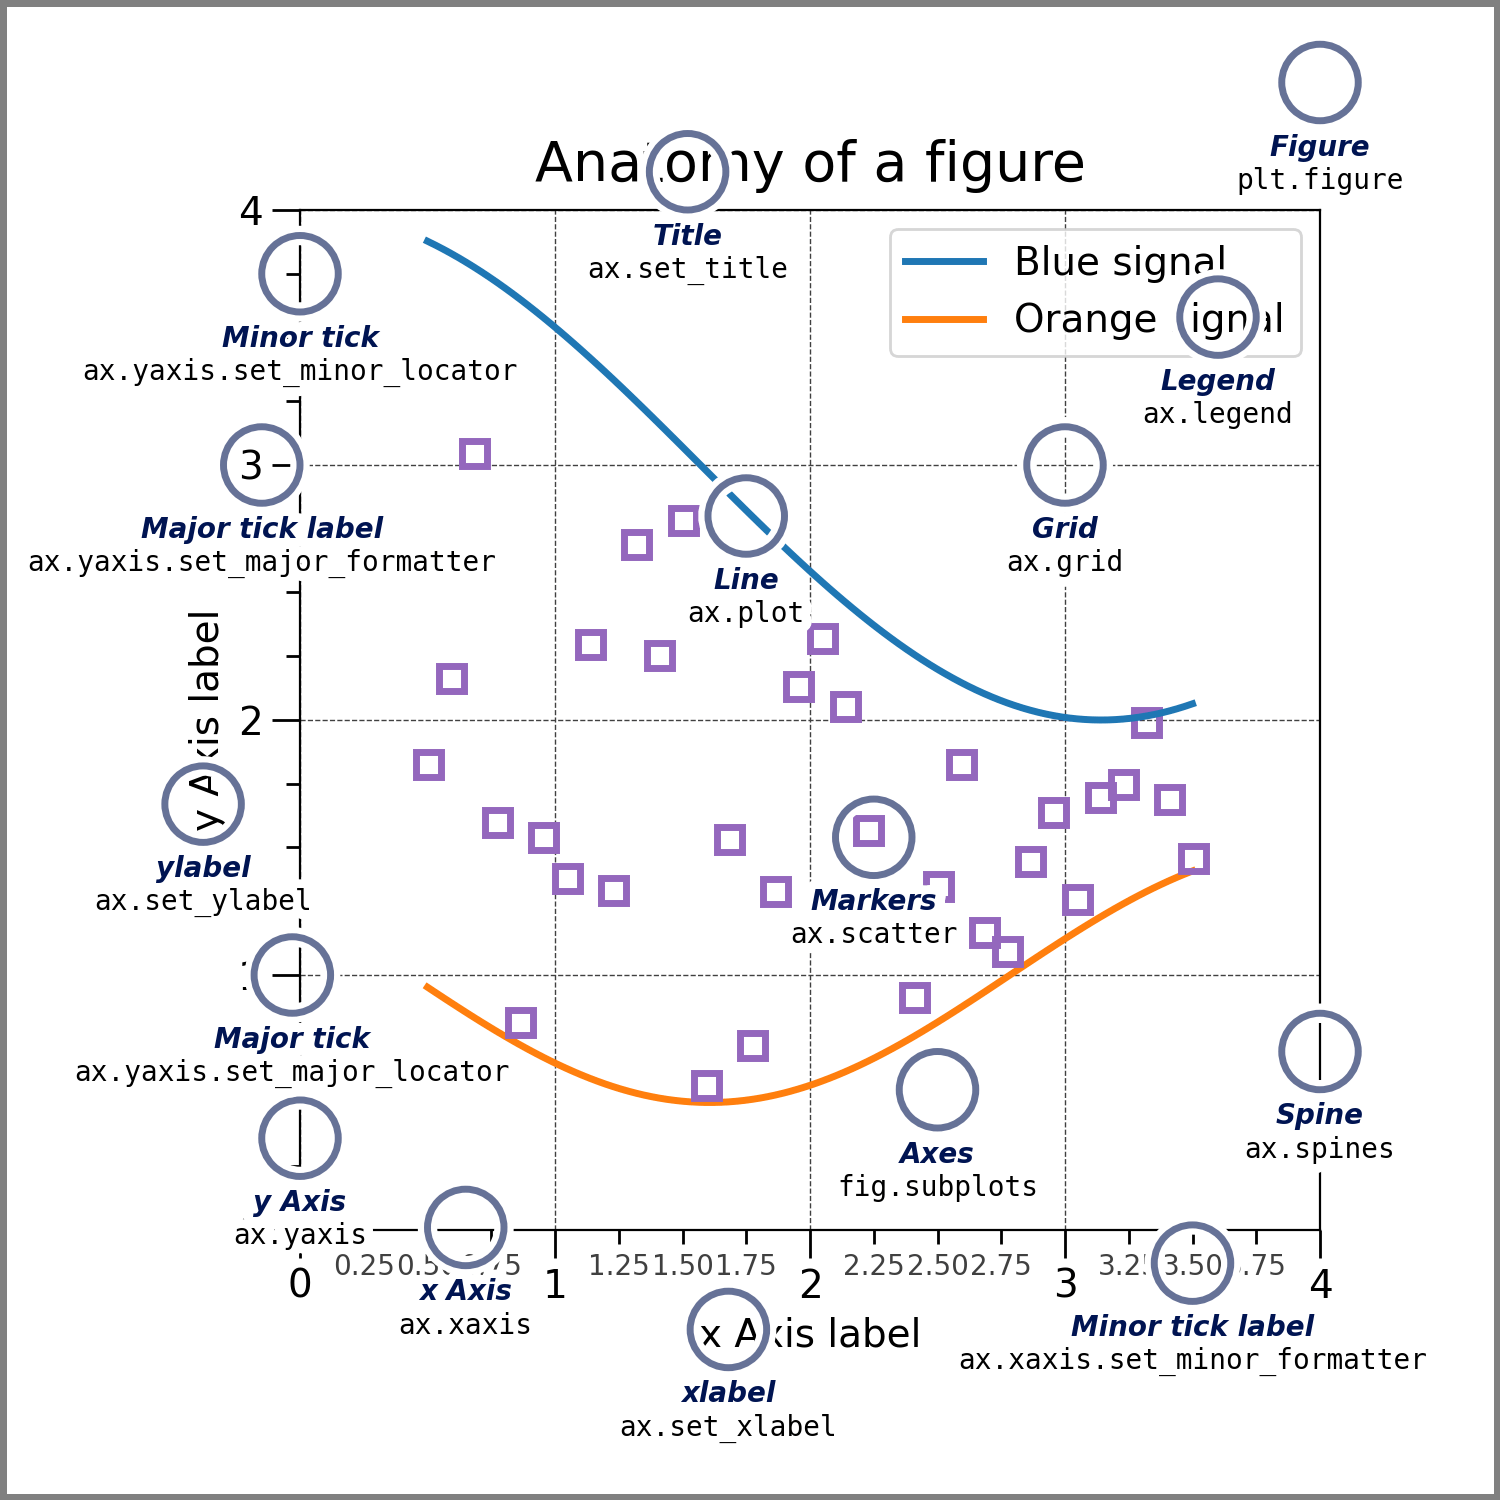
图片来源:(旧版)Usage — Matplotlib 1.5.1 documentation;(新版)Quick start guide — Matplotlib 3.6.2 documentation;建议自己查看原文档的英文理解。
编码样式
面向对象(OO)样式(推荐使用)
import matplotlib.pyplot as plt
import numpy as np
x = np.linspace(0, 2, 100) # 0-2之间取100个点
# Note that even in the OO-style, we use `.pyplot.figure` to create the Figure.
fig, ax = plt.subplots() # 生成带有一个Axes的figure
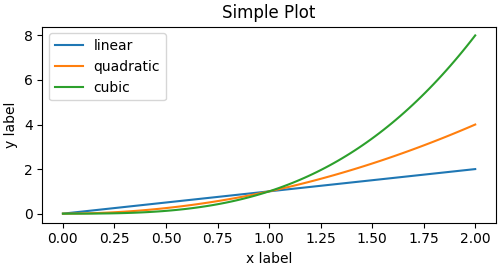
ax.plot(x, x, label='linear') # Plot some data on the axes.
ax.plot(x, x**2, label='quadratic') # Plot more data on the axes...
ax.plot(x, x**3, label='cubic') # ... and some more.
ax.set_xlabel('x label') # Add an x-label to the axes.
ax.set_ylabel('y label') # Add a y-label to the axes.
ax.set_title("Simple Plot") # Add a title to the axes.
ax.legend() # Add a legend.图内左上角的示意图
plt.show()
pyplot 样式(方便快捷)
import matplotlib.pyplot as plt
import numpy as np

x = np.linspace(0, 2, 100)  # 0-2之间取100个点

plt.figure()	# 只生成一个figure
plt.plot(x, x, label='linear')  # Plot some data on the (implicit) axes.
plt.plot(x, x**2, label='quadratic')
plt.plot(x, x**3, label='cubic')
plt.xlabel('x label')
plt.ylabel('y label')
plt.title("Simple Plot")
plt.legend()
plt.show()


 567
567


 被折叠的 条评论
为什么被折叠?
被折叠的 条评论
为什么被折叠?
 到【灌水乐园】发言


