


from pyecharts import options as opts
from pyecharts.charts import Bar
from pyecharts.globals import ThemeType
#数据准备
year_data = [2019,2020,2021,2022,2023]
list2 = [20.0,22.0,23.5,22.5,22.3]
list3 = [79.7,78.0,76.5,77.5,77.7]
bar_stack = (
    Bar(init_opts=opts.InitOpts(theme=ThemeType.LIGHT))
    .add_xaxis(year_data)
    .add_yaxis("跨国企业占比(%)", list2, stack="stack1", category_gap="60%")
    .add_yaxis("本土企业占比(%)", list3, stack="stack1", category_gap="60%")
    .set_series_opts(
        label_opts=opts.LabelOpts(
            position="right")
    )
    .set_global_opts(title_opts=opts.TitleOpts(title="全国药店中药饮片供应商占比情况"))
    .render("堆积柱形图.html")
)
运行结果: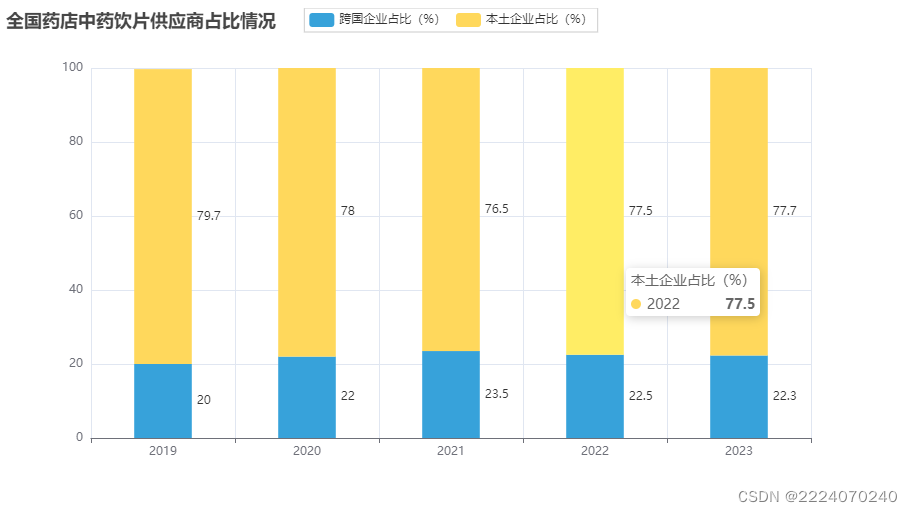


 179
179


 被折叠的 条评论
为什么被折叠?
被折叠的 条评论
为什么被折叠?
 到【灌水乐园】发言


