转载自:http://blog.csdn.net/xiehuimx/article/details/51731649
MPAndroidChart是一款基于Android的开源图表库,MPAndroidChart不仅可以在Android设备上绘制各种统计图表,而且可以对图表进行拖动和缩放操作,应用起来非常灵活。MPAndroidChart显得更为轻巧和简单,拥有常用的图表类型:线型图、饼图、柱状图和散点图。
MPAndroidCharts GitHub地址链接
项目地址链接(改成了github)
欢迎大家吐槽,小弟初来炸到,这是本人写的第一篇博客,希望大家多提意见,不胜感激
图表效果图
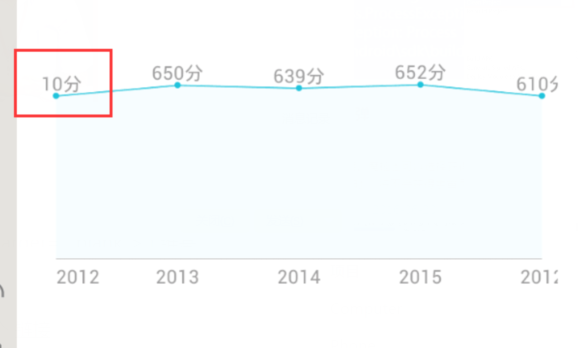
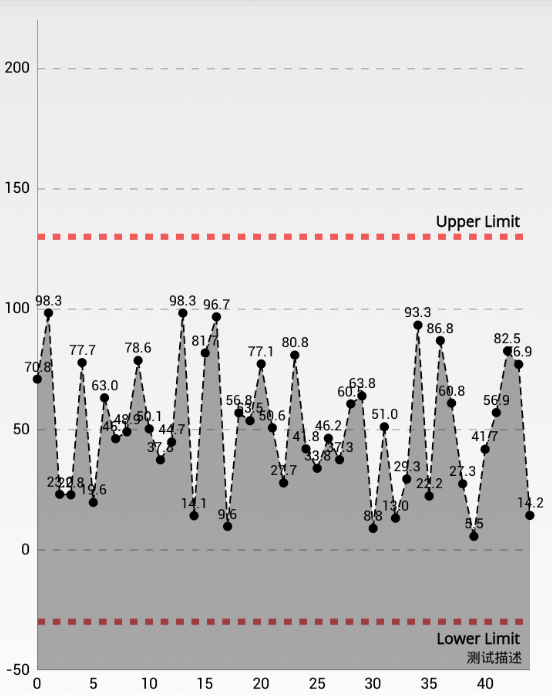
- LineChart
-
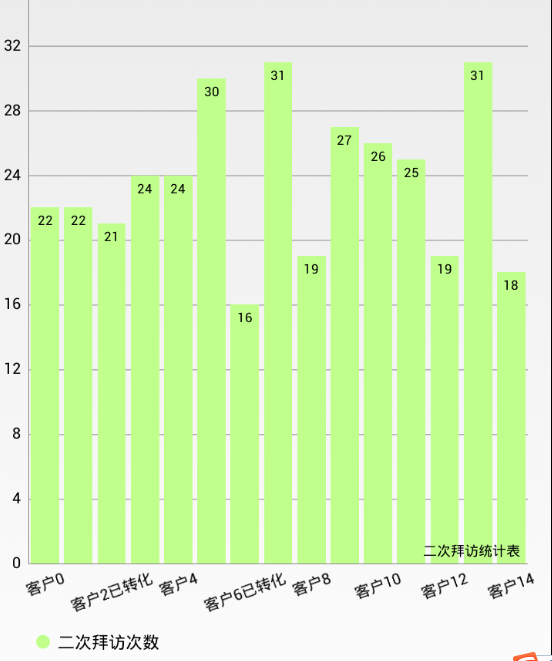
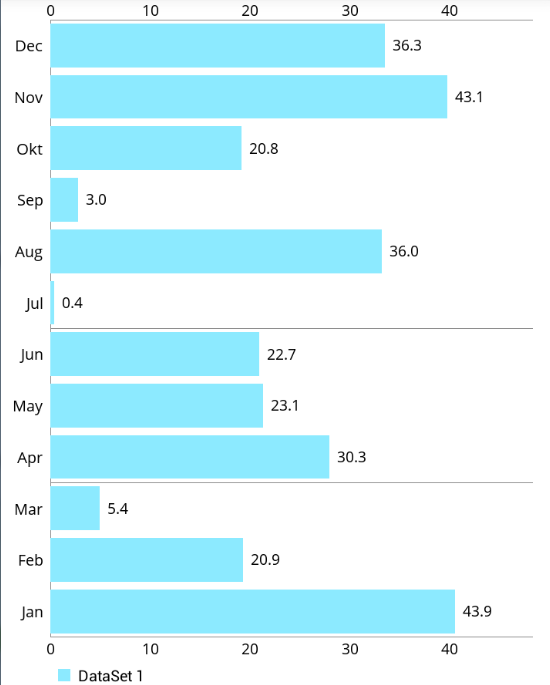
BarChart
-
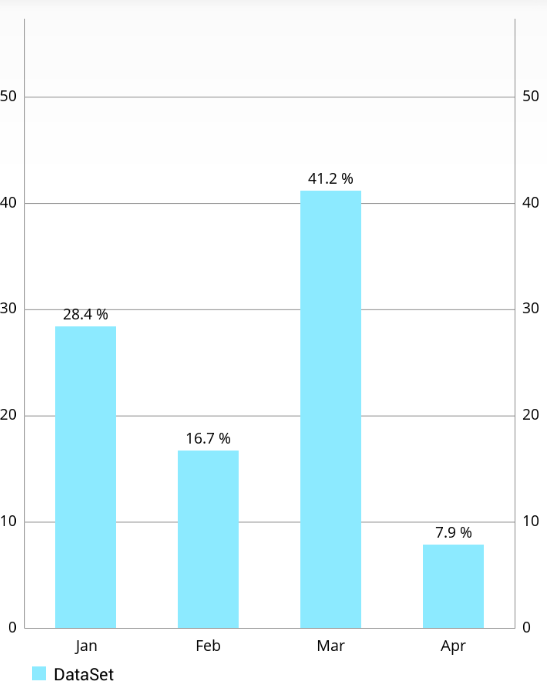
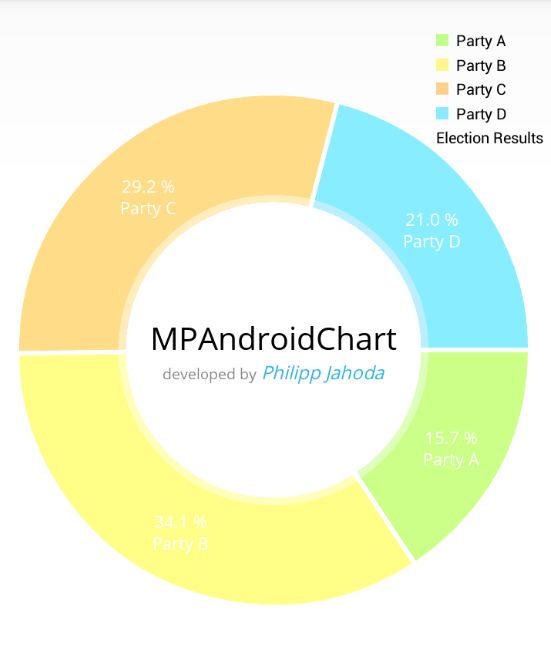
PieChart
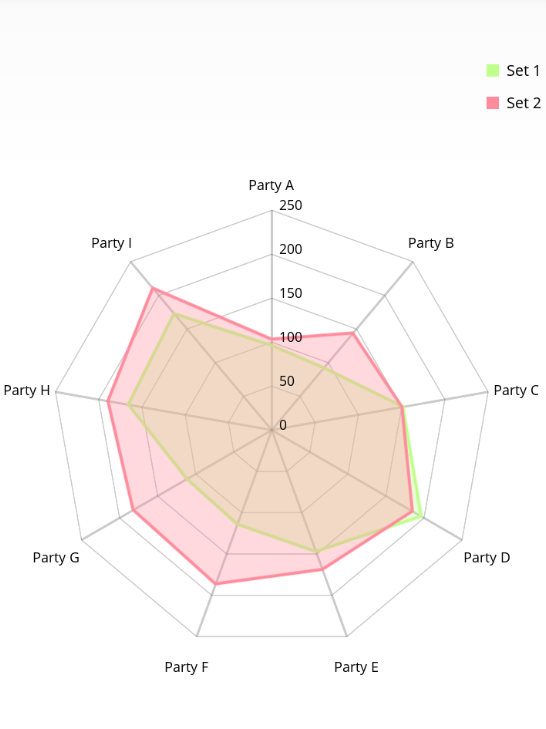
- RadarChart
图表常用功能及方法介绍:
-
XY轴的绘制
- setEnabled(boolean enabled):设置轴是否被绘制。默认绘制,false不会被绘制。
- setDrawLabels(boolean enabled):设置为true打开绘制轴的标签。
- setDrawAxisLine(boolean enabled): 设置为true,绘制轴线
- setDrawGridLines(boolean enabled): 设置为true绘制网格线。
-
定义轴线样式
- setTextColor(int color): 设置轴标签文本颜色。
- setTextSize(float size):设置轴标签的字体大小。
- setTypeface(Typeface tf):设置轴标签的自定义Typeface(Typeface.createFromAsset(getAssets(), “字体文件名”);)
- setGridColor(int color): 设置网格线颜色。
- setGridLineWidth(float width):设置网格线宽度。
- setAxisLineColor(int color):设置此轴的坐标轴的颜色。
- setAxisLineWidth(float width): 设置此轴的坐标轴的宽度。
- setVisibleXRangeMaximum(float maxXRange):设置x轴最多显示数据条数,(要在设置数据源后调用,否则是无效的)
- enableGridDashedLine(float lineLength, float spaceLength, float phase): 显示网格线虚线模式,”lineLength”控制短线条的长度,”spaceLength”控制两段线之间的间隔长度,”phase”控制开始的点。
-
图表交互设置
- setTouchEnabled(boolean enabled): 允许你打开或者关闭与图表的所有触摸交互的情况。
- setDragEnabled(boolean enabled): 打开或关闭对图表的拖动。
- setScaleEnabled(boolean enabled):打开或关闭对图表所有轴的的缩放。
- setScaleXEnabled(boolean enabled): 打开或关闭x轴的缩放
- setScaleYEnabled(boolean enabled): 打开或关闭y轴的缩放。
- setPinchZoom(boolean enabled): 如果设置为true,挤压缩放被打开。如果设置为false,x和y轴可以被单独挤压缩放。
- setHighlightEnabled(boolean enabled): 如果设置为true,在图表中选中触屏高亮。
- setHighlightPerDragEnabled(boolean enabled): 设置为true时允许高亮显示拖动结束的对象在缩放到最下时。默认:true
- setHighlightIndicatorEnabled(boolean enabled): 如果设置为true, 指标线(或杆)将展示被选择的线的绘制的值。
- 自定义轴线的值
- setAdjustXLabels(boolean enabled):如果被设置为true,x轴条目将依赖于它自己在进行缩放的时候。如果设置为false,x轴条目将总是保持相同。
- setAvoidFirstLastClipping(boolean enabled):如果设置为true,图表将避免第一个和最后一个标签条目被减掉在图表或屏幕的边缘。
- setSpaceBetweenLabels(int characters): 设置x轴标签之间的空间字符数,默认是4个。
- setPosition(XAxisPosition pos):设置XAxis应该出现的位置。可以选择TOP,BOTTOM,BOTH_SIDED,TOP_INSIDE或者BOTTOM_INSIDE。
- setStartAtZero(boolean enabled):如果这个打开,轴线总是有最小值0,无论什么类型的图表被展示。
- setAxisMaxValue(float max):设置一个自定义的最大值为这条轴,如果设置了,这个值将不会依赖于提供的数据自动计算。
- resetAxisMaxValue(): 调用这个将撤销以前设置的最大值。这意味着,你将再次允许轴自动计算它的最大值。
- setAxisMinValue(float min): 设置一个自定义的最小值。如果设置了,这个值将不会依赖于你提供的数据进行自动计算。
- resetAxisMinValue():调用这个方法撤销以前设置的最小值。这意味着,你将再次允许轴自动计算他的最小值。
- setInverted(boolean enabled): 如果设置为true,这个轴将被反向,那意味着最高出的将到底部,最低部的到顶端。
- setSpaceTop(float percent):设置在图表上最高处的值相比轴上最高值的顶端空间(总轴范围的百分比)
- setSpaceBottom(float percent): 设置在图表上最低处的值相比轴上最低处值的底部空间(总轴范围的百分比)
- setShowOnlyMinMax(boolean enabled): 如果打开了,这个轴将展示出它的最小值和最大值。这将忽略或者覆盖定义过的label-count。
- setPosition(YAxisLabelPosition pos):设置轴标签应该被绘制的位置。INSIDE_CHART或者OUTSIDE_CHART中的一个。 自定义影响轴的数值范围应该在图表被设置数据之前应用。
创建图表(LineChart举例)
- 布局文件: activity_barchart.xml
<?xml version="1.0" encoding="utf-8"?>
<RelativeLayout xmlns:android="http://schemas.android.com/apk/res/android"
    android:layout_width="match_parent"
    android:layout_height="match_parent" >

    <com.github.mikephil.charting.charts.BarChart
        android:id="@+id/chart1"
        android:layout_width="match_parent"
        android:layout_height="match_parent"
        android:layout_above="@+id/seekBar1" />

</RelativeLayout>
package com.charts.xh.mpandroidcharts
import android.app.Activity
import android.content.Intent
import android.graphics.Color
import android.os.Bundle
import android.util.Log
import android.widget.Toast
import com.charts.xh.mpandroidcharts.com.charts.xh.utils.CustomerValueFormatter
import com.charts.xh.mpandroidcharts.com.charts.xh.utils.MyYValueFormatter
import com.github.mikephil.charting.charts.BarChart
import com.github.mikephil.charting.components.Legend
import com.github.mikephil.charting.components.Legend.LegendForm
import com.github.mikephil.charting.components.Legend.LegendPosition
import com.github.mikephil.charting.components.XAxis.XAxisPosition
import com.github.mikephil.charting.components.XAxis
import com.github.mikephil.charting.components.YAxis
import com.github.mikephil.charting.data.BarData
import com.github.mikephil.charting.data.BarDataSet
import com.github.mikephil.charting.data.BarEntry
import com.github.mikephil.charting.data.Entry
import com.github.mikephil.charting.highlight.Highlight
import com.github.mikephil.charting.interfaces.datasets.IBarDataSet
import com.github.mikephil.charting.listener.OnChartValueSelectedListener
import java.util.ArrayList
public class BarCharts1 extends Activity implements
OnChartValueSelectedListener {
private BarChart mChart
@Override
protected void onCreate(Bundle savedInstanceState) {
super.onCreate(savedInstanceState)
setContentView(R.layout.activity_barchart)
mChart = (BarChart) findViewById(R.id.chart1)
mChart.setOnChartValueSelectedListener(this)
mChart.setDescription("市场拓展表")
mChart.setNoDataTextDescription("You need to provide data for the chart.")
mChart.setDrawValueAboveBar(true)
// mChart.setDrawBorders(true)
// scaling can now only be done on x- and y-axis separately
mChart.setPinchZoom(true)
mChart.setDrawBarShadow(false)
mChart.setDrawGridBackground(false)
mChart.setScaleYEnabled(false)
mChart.setDoubleTapToZoomEnabled(false)
mChart.getXAxis().setPosition(XAxisPosition.BOTTOM)
// create a custom MarkerView (extend MarkerView) and specify the layout
// to use for it
//自定义 MarkerView
MyMarkerView mv = new MyMarkerView(this, R.layout.custom_marker_view)
// define an offset to change the original position of the marker
// (optional)
// mv.setOffsets(-mv.getMeasuredWidth() / 2, -mv.getMeasuredHeight())
// set the marker to the chart
mChart.setMarkerView(mv)
Legend l = mChart.getLegend()
l.setPosition(LegendPosition.RIGHT_OF_CHART_INSIDE)
l.setTextSize(10f)
l.setFormSize(10f)
l.setForm(LegendForm.CIRCLE)
l.setWordWrapEnabled(true)
l.setPosition(LegendPosition.BELOW_CHART_CENTER)
XAxis xl = mChart.getXAxis()
xl.setLabelRotationAngle(-20)
//xl.setPosition(XAxisPosition.BOTTOM)
YAxis leftAxis = mChart.getAxisLeft()
//leftAxis.setValueFormatter(new LargeValueFormatter())
leftAxis.setValueFormatter(new MyYValueFormatter())
leftAxis.setDrawGridLines(false)
leftAxis.setSpaceTop(30f)
leftAxis.setAxisMinValue(0f)
mChart.getAxisRight().setEnabled(false)
setData(10)
}
public void setData(int num) {
ArrayList<String> xVals = new ArrayList<String>()
for (int i = 0
xVals.add( "小谢"+ i)
}
ArrayList<BarEntry> yVals1 = new ArrayList<BarEntry>()
ArrayList<BarEntry> yVals2 = new ArrayList<BarEntry>()
ArrayList<BarEntry> yVals3 = new ArrayList<BarEntry>()
for (int i = 0
float val = (float) (Math.random() * num)
yVals1.add(new BarEntry(val, i))
}
for (int i = 0
float val = (float) (Math.random() * num)
yVals2.add(new BarEntry(val, i))
}
for (int i = 0
float val = (float) (Math.random() * num)
yVals3.add(new BarEntry(val, i))
}
// create 3 datasets with different types
BarDataSet set1 = new BarDataSet(yVals1, "一季度")
// set1.setColors(ColorTemplate.createColors(getApplicationContext(),
// ColorTemplate.FRESH_COLORS))
set1.setColor(Color.rgb(104, 241, 175))
BarDataSet set2 = new BarDataSet(yVals2, "二季度")
set2.setColor(Color.rgb(164, 228, 251))
BarDataSet set3 = new BarDataSet(yVals3, "三季度")
set3.setColor(Color.rgb(242, 247, 158))
ArrayList<IBarDataSet> dataSets = new ArrayList<IBarDataSet>()
dataSets.add(set1)
dataSets.add(set2)
dataSets.add(set3)
BarData data = new BarData(xVals, dataSets)
// data.setValueFormatter(new LargeValueFormatter())
// add space between the dataset groups in percent of bar-width
data.setValueFormatter(new CustomerValueFormatter())
data.setDrawValues(true)
data.setValueTextColor(Color.BLACK)
data.setValueTextSize(13)
data.setGroupSpace(80f)
//data.setValueTypeface(tf)
mChart.setData(data)
mChart.animateXY(800,800)
mChart.setVisibleXRangeMaximum(15)
mChart.invalidate()
}
@Override
public void onValueSelected(Entry e, int dataSetIndex, Highlight h) {
Log.i("Activity", "Selected: " + e.toString() + ", dataSet: "
+ dataSetIndex)
Toast.makeText(this, e.getXIndex()+"valu"+e.getVal()+e.getData(),
}
@Override
public void onNothingSelected() {
Log.i("Activity", "Nothing selected.")
}
}
- 1
- 2
- 3
- 4
- 5
- 6
- 7
- 8
- 9
- 10
- 11
- 12
- 13
- 14
- 15
- 16
- 17
- 18
- 19
- 20
- 21
- 22
- 23
- 24
- 25
- 26
- 27
- 28
- 29
- 30
- 31
- 32
- 33
- 34
- 35
- 36
- 37
- 38
- 39
- 40
- 41
- 42
- 43
- 44
- 45
- 46
- 47
- 48
- 49
- 50
- 51
- 52
- 53
- 54
- 55
- 56
- 57
- 58
- 59
- 60
- 61
- 62
- 63
- 64
- 65
- 66
- 67
- 68
- 69
- 70
- 71
- 72
- 73
- 74
- 75
- 76
- 77
- 78
- 79
- 80
- 81
- 82
- 83
- 84
- 85
- 86
- 87
- 88
- 89
- 90
- 91
- 92
- 93
- 94
- 95
- 96
- 97
- 98
- 99
- 100
- 101
- 102
- 103
- 104
- 105
- 106
- 107
- 108
- 109
- 110
- 111
- 112
- 113
- 114
- 115
- 116
- 117
- 118
- 119
- 120
- 121
- 122
- 123
- 124
- 125
- 126
- 127
- 128
- 129
- 130
- 131
- 132
- 133
- 134
- 135
- 136
- 137
- 138
- 139
- 140
- 141
- 142
- 143
- 144
- 145
- 146
- 147
- 148
- 149
- 150
- 151
- 152
- 153
- 154
- 155
- 156
- 157
- 158
- 159
package com.charts.xh.mpandroidcharts;
import android.content.Context;
import android.widget.TextView;
import com.github.mikephil.charting.components.MarkerView;
import com.github.mikephil.charting.data.CandleEntry;
import com.github.mikephil.charting.data.Entry;
import com.github.mikephil.charting.highlight.Highlight;
import com.github.mikephil.charting.utils.Utils;
/**
* Custom implementation of the MarkerView.
*
* @author Philipp Jahoda
*/
public class MyMarkerView extends MarkerView {
private TextView tvContent;
public MyMarkerView(Context context, int layoutResource) {
super(context, layoutResource);
tvContent = (TextView) findViewById(R.id.tvContent);
}
@Override
public void refreshContent(Entry e, Highlight highlight) {
if (e instanceof CandleEntry) {
CandleEntry ce = (CandleEntry) e;
tvContent.setText("" + Utils.formatNumber(ce.getHigh(), 0, true));
} else {
tvContent.setText("" + Utils.formatNumber(e.getVal(), 0, true));
}
}
@Override
public int getXOffset(float xpos) {
return -(getWidth() / 2);
}
@Override
public int getYOffset(float ypos) {
return -getHeight();
}
}
- 1
- 2
- 3
- 4
- 5
- 6
- 7
- 8
- 9
- 10
- 11
- 12
- 13
- 14
- 15
- 16
- 17
- 18
- 19
- 20
- 21
- 22
- 23
- 24
- 25
- 26
- 27
- 28
- 29
- 30
- 31
- 32
- 33
- 34
- 35
- 36
- 37
- 38
- 39
- 40
- 41
- 42
- 43
- 44
- 45
- 46
- 47
- 48
- 49
- 50
- 51
- 52
- 53
- 54
- 55
- 1
- 2
- 3
- 4
- 5
- 6
- 7
- 8
- 9
- 10
- 11
- 12
- 13
- 14
- 15
- 16
- 17
- 18
- 19
- 20
- 21
- 22
- 23
- 24
- 25
- 26
- 27
- 28
- 29
- 30
- 31
- 32
- 33
- 34
- 35
- 36
- 37
- 38
- 39
- 40
- 41
- 42
- 43
- 44
- 45
- 46
- 47
- 48
- 49
- 50
- 51
- 52
- 53
- 54
- 55
- MyMarkerView 布局文件 custom_marker_view.xml
<?xml version="1.0" encoding="utf-8"?>
<RelativeLayout xmlns:android="http://schemas.android.com/apk/res/android"
    android:layout_width="wrap_content"
    android:layout_height="40dp"
    android:background="@drawable/marker2" >

    <TextView
        android:id="@+id/tvContent"
        android:layout_width="wrap_content"
        android:layout_height="wrap_content"
        android:layout_centerHorizontal="true"
        android:layout_marginTop="7dp"
        android:layout_marginLeft="5dp"
        android:layout_marginRight="5dp"
        android:text=""
        android:textSize="12dp"
        android:textColor="@android:color/white"
        android:ellipsize="end"
        android:singleLine="true"
        android:textAppearance="?android:attr/textAppearanceSmall" />

</RelativeLayout>
- 1
- 2
- 3
- 4
- 5
- 6
- 7
- 8
- 9
- 10
- 11
- 12
- 13
- 14
- 15
- 16
- 17
- 18
- 19
- 20
- 21
- 22
- 23
- 1
- 2
- 3
- 4
- 5
- 6
- 7
- 8
- 9
- 10
- 11
- 12
- 13
- 14
- 15
- 16
- 17
- 18
- 19
- 20
- 21
- 22
- 23
- Y轴线数据格式化 MyYValueFormatter .java
package com.charts.xh.mpandroidcharts.com.charts.xh.utils;

import com.github.mikephil.charting.components.YAxis;
import com.github.mikephil.charting.formatter.YAxisValueFormatter;

import java.text.DecimalFormat;

public class MyYValueFormatter implements YAxisValueFormatter {

    private DecimalFormat mFormat;

    public MyYValueFormatter() {
        mFormat = new DecimalFormat("###,###,###,##0");
    }

    @Override
    public String getFormattedValue(float value, YAxis yAxis) {
        return mFormat.format(value);
    }
}
- 1
- 2
- 3
- 4
- 5
- 6
- 7
- 8
- 9
- 10
- 11
- 12
- 13
- 14
- 15
- 16
- 17
- 18
- 19
- 20
- 21
- 1
- 2
- 3
- 4
- 5
- 6
- 7
- 8
- 9
- 10
- 11
- 12
- 13
- 14
- 15
- 16
- 17
- 18
- 19
- 20
- 21
repositories {
    maven { url "https://jitpack.io" }
}

dependencies {
    compile 'com.github.PhilJay:MPAndroidChart:v2.2.5'
}
如果用的Eclipse只需要将jar包拷贝到项目libs目录下,即可开发是用MPAndroidCharts库,点击下载jar包
MPAndroidCharts常见问题
1 . 如何显示隐藏Y轴线及自定义轴线的显示样式
mChart.getAxisLeft().setEnabled(false) //隐藏Y轴左边轴线,此时标签数字也隐藏
mChart.getAxisRight().setEnabled(false) //隐藏Y轴右边轴线,此时标签数字也隐藏
如果想隐藏轴线但是想显示数字标签:
mChart.getAxisRight().setDrawAxisLine(false);
2 . Y轴线数据标签怎么自己控制显示个数
mChart.getAxisLeft().setLabelCount(8, false);//此时设置了分8个,可根据自己喜好设置
3 . 怎么设置轴线颜色,宽度等信息
YAxis leftAxis = mChart.getAxisLeft();
leftAxis . setPosition(YAxisLabelPosition.OUTSIDE_CHART);/ /显示轴线内部INSIDE_CHART
leftAxis.setAxisLineColor(Color.parseColor(“#ff0000”));//设置轴线颜色:leftAxis.setAxisLineWidth(1);// 设置轴线宽度
leftAxis.setTextSize(20);//设置y轴标签字体大小
leftAxis.setTypeface();//设置自定义字体
leftAxis.setDrawGridLines(Boolean );//设置是否显示网格线,
4 . 怎么将Y轴线数据前面加上¥人民币符号
import com.github.mikephil.charting.components.YAxis;
import com.github.mikephil.charting.formatter.YAxisValueFormatter;

import java.text.DecimalFormat;

public class MyYValueFormatter implements YAxisValueFormatter {

    private DecimalFormat mFormat;

    public MyYValueFormatter() {
        mFormat = new DecimalFormat("###,###,###,##0");
    }

    @Override
    public String getFormattedValue(float value, YAxis yAxis) {
        return "¥"+mFormat.format(value);
    }
}
- 1
- 2
- 3
- 4
- 5
- 6
- 7
- 8
- 9
- 10
- 11
- 12
- 13
- 14
- 15
- 16
- 17
- 18
- 1
- 2
- 3
- 4
- 5
- 6
- 7
- 8
- 9
- 10
- 11
- 12
- 13
- 14
- 15
- 16
- 17
- 18
5 . 图表里面边缘标签数据显示不全,显示到界面外面如何处理
mChart.setExtraLeftOffset(float);
mChart.setExtraTopOffset(float);
mChart.setExtraRightOffset(float);
mChart.setExtraBottomOffset(float);
mChart.setExtraOffsets(float left, float top, float right, float bottom);
6 . 怎么实现X轴 对应的Y数据显示整型
import com.github.mikephil.charting.data.Entry;
import com.github.mikephil.charting.formatter.ValueFormatter;
import com.github.mikephil.charting.utils.ViewPortHandler;
import java.text.DecimalFormat;
public class CustomerValueFormatter implements ValueFormatter {
private DecimalFormat mFormat;
public CustomerValueFormatter() {
mFormat = new DecimalFormat("###,###,###,##0");
}
@Override
public String getFormattedValue(float value, Entry entry, int dataSetIndex, ViewPortHandler viewPortHandler) {
return mFormat.format(value);
}
}
- 1
- 2
- 3
- 4
- 5
- 6
- 7
- 8
- 9
- 10
- 11
- 12
- 13
- 14
- 15
- 16
- 17
- 18
- 19
- 20
- 21
- 1
- 2
- 3
- 4
- 5
- 6
- 7
- 8
- 9
- 10
- 11
- 12
- 13
- 14
- 15
- 16
- 17
- 18
- 19
- 20
- 21
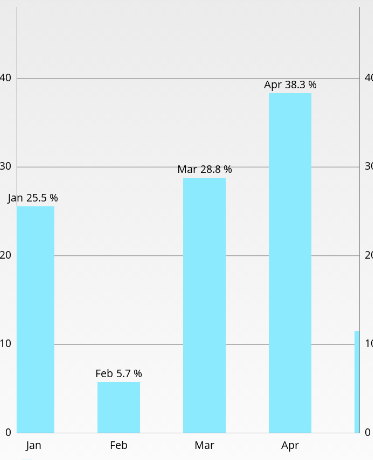
注:百分比源码自带PercentFormatter,当然上面自定义可以定义你任何想要的方式。
7 . 将x轴标签倾斜显示(如问题6里面x轴标签效果)
XAxis xl = mChart.getXAxis()
xl.setLabelRotationAngle(-20)
xl.setPosition(XAxisPosition.BOTTOM)
xl.setSpaceBetweenLabels(int spaceCharacters)//设置Lable之间的距离(字符),小于距离将不显示,需要放大图标才能看到
8 . 设置x轴对应y数据
data.setDrawValues(false);
data.setValueTextSize(20f);
data.setValueTypeface(mTf);
setValueTextColor(int color)
setValueTextColors(List<Integer> colors)
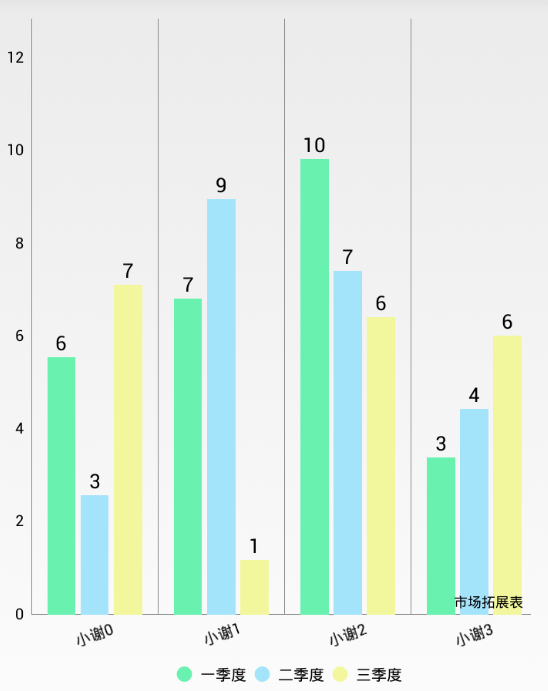
9 . Barchart表设置柱体之间的距离无效
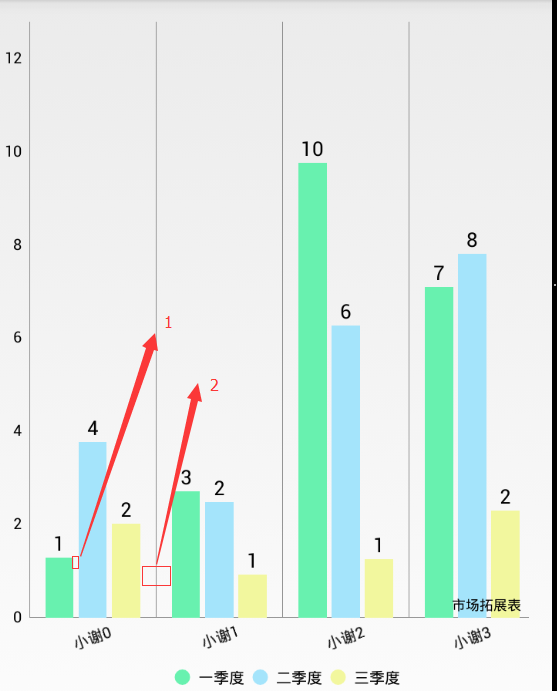
BarChart柱体间距有两种方式,如上图的1和2:
BarDataSet set1 = new BarDataSet(yVals1, "DataSet");
set1.setBarSpacePercent(50f);
data.setGroupSpace(float);//设置一页显示的数据条数,超出的数量需要滑动查看:
所以设置间距要看你的数据,及设置的是哪个间距,只有调用对应的方法间距才能生效。由于这个间隔设置是按百分比的,如果数据较多用户体验会很差,可以适当配合问题10设置一页显示的数量,可美观界面。
10 . 一个页面显示的数据太多了,都不看清楚,怎么样设置一个页面显示固定条数的数据,如果数据太多需要手动滑动看到
mChart.setVisibleXRangeMaximum(int);
barChart.setVisibleXRangeMinimum();
注:上面方法老的版本是没用此方法的可以用:
setVisibleXRange(float minXRange, float maxXRange)
11 . 如何设置图例样式
Legend l = mChart.getLegend();
/**图例位置的枚举类有下面几种:
RIGHT_OF_CHART, RIGHT_OF_CHART_CENTER, RIGHT_OF_CHART_INSIDE,
LEFT_OF_CHART, LEFT_OF_CHART_CENTER, LEFT_OF_CHART_INSIDE,
BELOW_CHART_LEFT, BELOW_CHART_RIGHT, BELOW_CHART_CENTER,
ABOVE_CHART_LEFT, ABOVE_CHART_RIGHT, ABOVE_CHART_CENTER,
PIECHART_CENTER
*/
l.setPosition(LegendPosition.RIGHT_OF_CHART_INSIDE);
l.setTextSize(10f);
l.setFormSize(10f);
l.setForm(LegendForm.CIRCLE);
l.setWordWrapEnabled(true);
12 . 怎么将图表上的节点数据显示成对应的x轴数据和y轴数据拼接显示,如下效果
package com.charts.xh.mpandroidcharts.com.charts.xh.utils;
import com.github.mikephil.charting.data.ChartData;
import com.github.mikephil.charting.data.Entry;
import com.github.mikephil.charting.formatter.ValueFormatter;
import com.github.mikephil.charting.utils.ViewPortHandler;
import java.text.DecimalFormat;
import java.util.List;
/**
* Created by xiehui on 2016/7/31.
*/
public class CustomerPercentFormatter implements ValueFormatter {
protected DecimalFormat mFormat;
protected List<String> mXVals;
public CustomerPercentFormatter(ChartData data) {
mFormat = new DecimalFormat("###,###,##0.0");
mXVals = data.getXVals();
}
/**
* Allow a custom decimalformat
*
* @param format
*/
public CustomerPercentFormatter(DecimalFormat format) {
this.mFormat = format;
}
@Override
public String getFormattedValue(float value, Entry entry, int dataSetIndex, ViewPortHandler viewPortHandler) {
return mXVals.get(entry.getXIndex()) + " : " + mFormat.format(value) + " %";
}
}
- 1
- 2
- 3
- 4
- 5
- 6
- 7
- 8
- 9
- 10
- 11
- 12
- 13
- 14
- 15
- 16
- 17
- 18
- 19
- 20
- 21
- 22
- 23
- 24
- 25
- 26
- 27
- 28
- 29
- 30
- 31
- 32
- 33
- 34
- 35
- 36
- 37
- 38
- 39
- 40
- 41
- 42
- 1
- 2
- 3
- 4
- 5
- 6
- 7
- 8
- 9
- 10
- 11
- 12
- 13
- 14
- 15
- 16
- 17
- 18
- 19
- 20
- 21
- 22
- 23
- 24
- 25
- 26
- 27
- 28
- 29
- 30
- 31
- 32
- 33
- 34
- 35
- 36
- 37
- 38
- 39
- 40
- 41
- 42


 748
748


 被折叠的 条评论
为什么被折叠?
被折叠的 条评论
为什么被折叠?
 到【灌水乐园】发言


