


主要使用的三方为:MPAndroidChart
1.使用方法:引入依赖或者导入module
repositories {
maven { url "https://jitpack.io" }
}
implementation 'com.github.PhilJay:MPAndroidChart:v3.1.0'
2.在布局中定义
<com.github.mikephil.charting.charts.LineChart
android:id="@+id/lineChart"
android:layout_width="match_parent"
android:layout_height="400dp"
/>
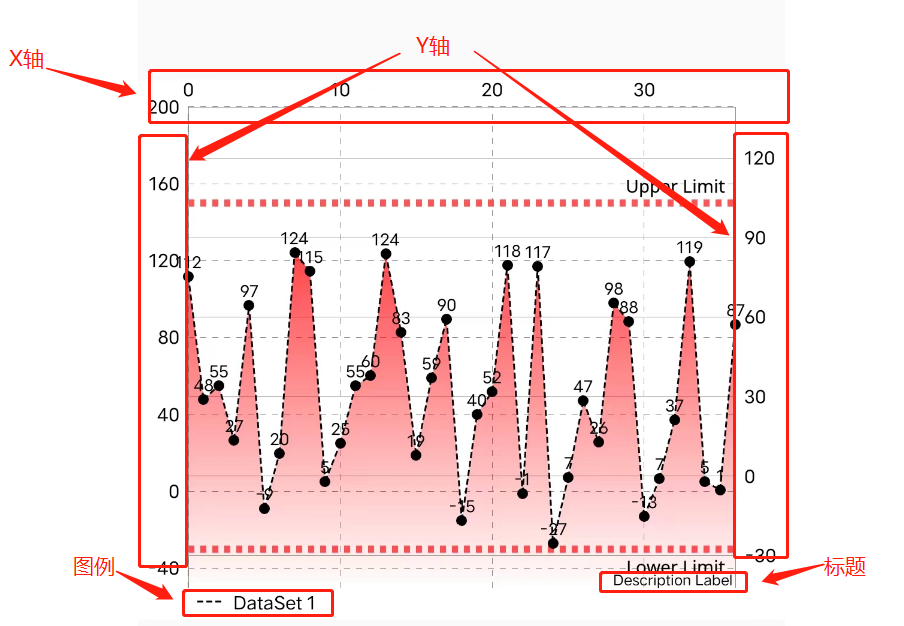
3.折线图主要由六部分组成
标题(Description)
标记(marker)
图例(Legend)
X轴(XAxis)
Y轴(YAxis)
数据源(LineData)
4.最基础的使用方式
    @Override
    protected void onCreate(Bundle savedInstanceState) {
        super.onCreate(savedInstanceState);
        getWindow().setFlags(WindowManager.LayoutParams.FLAG_FULLSCREEN,
                WindowManager.LayoutParams.FLAG_FULLSCREEN);
        setContentView(R.layout.activity_linechart);

        lineChart = findViewById(R.id.lineChart);

        // 背景颜色
        lineChart.setBackgroundColor(Color.WHITE);

        // 禁用描述文本
        lineChart.getDescription().setEnabled(true);

        // 启用触摸手势
        lineChart.setTouchEnabled(true);

        // 设置监听器
        lineChart.setOnChartValueSelectedListener(this);
        lineChart.setDrawGridBackground(false);

        // 启用拖动
        lineChart.setDragEnabled(true);
        // 启用缩放
        lineChart.setScaleEnabled(true);
        // lineChart.setScaleXEnabled(true);
        // lineChart.setScaleYEnabled(true);

        // 沿两个轴缩放
        lineChart.setPinchZoom(true);
        // 动画
        lineChart.animateXY(2000,2000);


        setData();
        setMarker();
    }
    //加载数据
    public void setData(){
        float datas[] = {14f,15f,16f,17f,16f,16f};
        //在MPAndroidChart一般都是通过List<Entry>对象来装数据的
        List<Entry> entries = new ArrayList<Entry>();
        //循环取出数据
        for(int i = 0; i < datas.length; i++){
            entries.add(new Entry(i,datas[i]));
        }
        //一个LineDataSet对象就是一条曲线
        LineDataSet lineDataSet = new LineDataSet(entries,"第一条数据");
        //LineData才是正真给LineChart的数据
        LineData lineData = new LineData(lineDataSet);
        lineChart.setData(lineData);
    }
4.1标题(Description)设置
属性 | 注解 |
setEnabled() | 是否启用,bool值 |
setText() | 设置标题的文本 |
setTextSize() | 设置文本大小 |
setTypeface() | 设置文本样式,如:特殊字体等 |
setTextColor() | 设置文本颜色 |
setXOffset() | 设置X轴的偏移量,float值 |
setYOffset() | 设置Y轴的偏移量,float值 |
setPosition() | 设置标题X和Y轴的偏移量 |
lineChart.setDescription() | 添加给LineChart |
4.2图例(Legend)设置
属性 | 注解 |
setEnabled() | 是否启用,bool值 |
setPosition(LegendPosition.BELOW_CHART_LEFT) | 设置图例的位置在图表的 左下角 |
getLegend() | 获取Legend对象 |
setFormSize() | 设置图例文字大小 |
setTextColor() | 设置文本颜色 |
setTypeface() | 设置文本样式,如:特殊字体等 |
setFormSize() | 设置图例的大小 |
setOrientation() | 设置多个图例的排列方式 |
setForm() | 设置图例的样式,如圆形、线形 |
setDrawInside() | 是否将图例绘制在内部,bool值 |
setFormToTextSpace() | 设置文本距离图例的距离,float值 |
setXOffset() | 设置X轴的偏移量,float值 |
setYOffset() | 设置Y轴的偏移量,float值 |
setVerticalAlignment() | 设置图例在垂直方向上的排列方式,LegendVerticalAlignment枚举值 |
setHorizontalAlignment() | 设置图例在水平方向上的排列方式,LegendHorizontalAlignment枚举值 |
setDirection | 设置多个图例从什么方向开始绘制,如从左向右 |
4.3 X轴(XAxis)设置
属性 | 注解 |
setEnabled() | 是否启用,bool值 |
setTextSize() | 设置文本字体大小 |
setTypeface() | 设置文本样式,如:特殊字体等 |
setTextColor() | 设置字体颜色 |
setDrawGridLines() | 是否绘制网格线(横向的线) |
setGridLineWidth() | 设置网格线的宽度 |
setGridColor() | 设置网格线的颜色 |
setDrawAxisLine() | 是否绘制靠近X轴的第一条线,设置xAxis.setDrawGridLines(false)才有效果 |
setAxisLineWidth() | 设置靠近X轴的第一条线的宽度 |
setAxisLineWidth() | 设置靠近X轴的第一条线的颜色 |
setPosition() | 设置X轴的文本描述是否绘制在内侧 |
setDrawLabels() | 是否绘制左侧的描述文字 |
setAxisMaximum() | 设置X轴的最大值 |
setAxisMinimum() | 设置X轴的最小值 |
setGranularity() | 设置X轴每两个值之间的间隔 |
setGranularityEnabled() | 是否启用间隔 |
setInverted() | 设置是否倒序拍立 |
setValueFormatter() | 数据展示:自定义格式,通过实现接口IAxisValueFormatter |
setXOffset() | 设置相对于X轴的偏移量(一般都会加点偏移量,以免第一个数据显示不全) |
setYOffset() | 设置相对于Y轴的偏移量 |
setCenterAxisLabels() | 是否使文字在中间对齐 |
setLabelCount() | 设置展示的个数,第二个参数如果设置为true表示将强制设置标签计数,这意味着指定的标签数将沿轴绘制并均匀分布-这可能会导致标签参差不齐 |
setPosition() setPosition(XAxis.XAxisPosition.BOTTOM) | 设置X所在的位置,可取值:TOP(默认值):位于上方,TOP_INSIDE:位于上方并绘制在图形内部,BOTTOM:位于下方,BOTTOM_INSIDE:位于下方并绘制在图形内部,BOTH_SIDED:上下两边都显示轴 |
setLabelRotationAngle() | 设置旋转的角度,float值 |
用法:先把对象获取到,然后再去设置属性
XAxis xAxis = lc.getXAxis();
xAxis.setTextSize(14f);//设置文本大小
4.4 Y轴(YAxis)设置
基本和X轴一致(没有setLabelRotationAngle() 旋转角度)
getAxisLeft() | 获取左边的YAxis对象 |
getAxisRight() | 获取右边的YAxis对象 |
4.5 数据源(LineData)设置
属性 | 注解 |
setColor() | 设置线条颜色 |
setCircleColor() | 一次性设置所有圆点的颜色 |
setLineWidth() | 设置线条的宽度 |
setCircleRadius() | 设置圆点的半径大小 |
setDrawCircleHole() | 设置是否为空心圆 |
setCircleColorHole() | 设置空心圆心的颜色,注意该属性只有在setDrawCircleHole为true的时候才有效果 |
setDrawCircles() | 是否绘制圆点,若为false则表示只有折线 |
setFillColor() | 设置在曲线下方填充的颜色(阴影的颜色) |
setDrawFilled() | 是否在线条下方设置填充,bool类型 |
setMode() | 用于设置线条的类型,Mode枚举值,如Mode.CUBIC_BEZIER表示贝塞尔曲线 |
setAxisDependency() | 设置线条是参照左边的y轴还是右边的y轴,在绘制组合图的时候用到,AxisDependency枚举值 |
4.6 标记(marker)设置
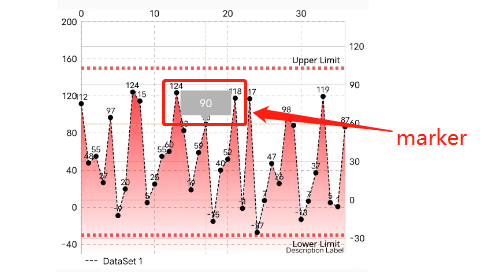
    //点击指示器可显示更多详情
    public void setMarker(){
        // create marker to display box when values are selected
        MyMarkerView mv = new MyMarkerView(getContext(), R.layout.custom_marker_view);
        // Set the marker to the chart
        mv.setChartView(chart);
        lineChart.setMarker(mv);
    }
<?xml version="1.0" encoding="utf-8"?>
<RelativeLayout xmlns:android="http://schemas.android.com/apk/res/android"
xmlns:tools="http://schemas.android.com/tools"
android:layout_width="wrap_content"
android:layout_height="40dp"
android:background="@drawable/marker2"(图片可以自己找资源,不知道我放上去的这个能不能下载)
tools:ignore="Overdraw">
<TextView
android:id="@+id/tvContent"
android:layout_width="wrap_content"
android:layout_height="wrap_content"
android:layout_centerHorizontal="true"
android:layout_marginTop="7dp"
android:layout_marginLeft="5dp"
android:layout_marginRight="5dp"
android:text=""
android:textSize="12sp"
android:textColor="@android:color/white"
android:ellipsize="end"
android:singleLine="true"
android:textAppearance="?android:attr/textAppearanceSmall" />
</RelativeLayout>

引用:1.CSDN博主「夕灬颜」的原创文章https://blog.csdn.net/qq_43332570/article/details/103180779
引用:2.MPAndroidChart的demo


 1539
1539

 被折叠的 条评论
为什么被折叠?
被折叠的 条评论
为什么被折叠?
 到【灌水乐园】发言


