


全部代码
var myChart1 = echarts.init(document.getElementById(name));
var age=[];
var year=[];
//var xData=[];
var data=[];
for (var i = 0; i <vm.chartList.length; i++) {
age.push(vm.chartList[i].age);
year.push(vm.chartList[i].year);
//xData.push({age:vm.chartList[i].age,year:vm.chartList[i].year})
data.push(parseInt(vm.chartList[i].policyamount/10000));
}
var option = {
tooltip: {
trigger: 'axis',
axisPointer: {//坐标指示线
type: 'shadow'
},
backgroundColor:'transparent',
textStyle: {//标题颜色
fontWeight: 'normal',
color: "#25FFDD"
},
position: function (pt) {
return [pt[0], '10%'];
},
formatter(params) {
const item = params[0];
return `
${item.name}岁<br/>
${item.value}万元
`;
},
},
title: {
text: name+'曲线图',
x: 'left',
align: 'left',
textStyle: {//标题颜色
fontWeight: 'normal',
color: "#D4FFF9"
},
},
// toolbox: {//feature 各工具配置项: dataZoom 数据区域缩放;restore 配置项还原;saveAsImage下载为图片;magicType动态类型切换
// feature: {
// dataZoom: {
// yAxisIndex: 'none'// y轴不缩放,Index默认为0
// },
// restore: {},
// saveAsImage: {},
// /*magicType: {
// type: ['bar', 'line']
// }*/
// }
// },
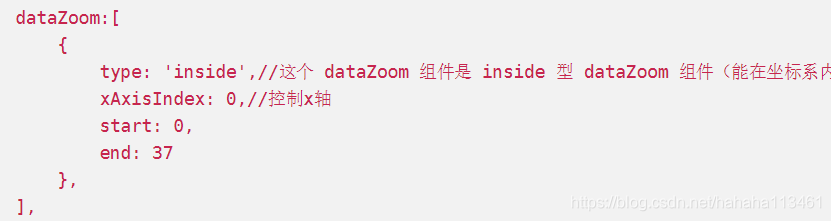
dataZoom:[
{
type: 'inside',//这个 dataZoom 组件是 inside 型 dataZoom 组件(能在坐标系内进行拖动,以及用滚轮(或移动触屏上的两指滑动)进行缩放)
xAxisIndex: 0,//控制x轴
start: 0,
end: 37
},
],
xAxis: {
type: 'category',
data: age,
axisLabel:{
color:'#D4FFF9',
interval: 100,
showMinLabel: true,
showMaxLabel: true,
/*formatter:function(params){
console.log(params)
},*/
}, //x轴字体颜色
axisLine: {//x轴坐标颜色
lineStyle: {
color: "#00B79A",
}
},
splitLine:{show:false},//隐藏网格线
axisTick:{// x轴刻度的颜色
//lineStyle:{color:'rgb(150,150,150)'}
},
},
yAxis: {
type: 'value',
data:data,
axisLabel:{
color:'#D4FFF9',
formatter:'{value}万'
},
splitLine:{show:false},//隐藏网格线
axisLine: {
lineStyle: {
color: "#00B79A",
}
}
},
series: [{
data: data,//有多少年就会有多少个数据
type: 'line',
itemStyle : {
normal : {
lineStyle:{ //折现颜色
color: new echarts.graphic.LinearGradient(0, 0, 0, 1, [{
offset: 0,
color: 'rgba(2,255,248,1)'
}, {
offset: 1,
color: 'rgba(90,255,117,1)'
}])
},
color:'#9EFF14', //折点颜色
}
},
}],
grid:{
containLabel: true
}
};
myChart1.setOption(option);
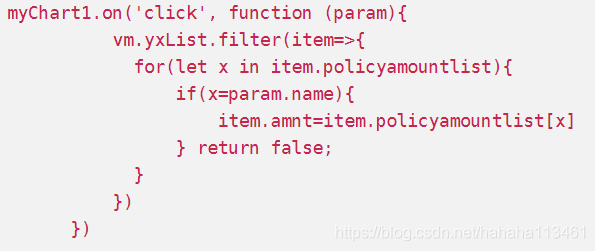
myChart1.on('click', function (param){
vm.yxList.filter(item=>{
for(let x in item.policyamountlist){
if(x=param.name){
item.amnt=item.policyamountlist[x]
} return false;
}
})
})
点击不同折点控制页面数据即时更新的关键代码
控制在图形区域内手指或者鼠标滚轮缩放的


 876
876


 被折叠的 条评论
为什么被折叠?
被折叠的 条评论
为什么被折叠?
 到【灌水乐园】发言


