


引言
图表可以说是随处可见了,而我们最常用的莫过于折线图,曲线图,饼图,柱状图啦。相信大多数人都用过echarts,比我更了解它,配置一大堆,写个图表90%时间是在查询配置,9%的时间在吐槽,仅仅1%才可能用在了写代码上。既然如此那何必不自行写一个适合自己产品的呢?
正文
噔噔(闪亮登场),下面就是一个现成的折线、曲线生蛋啦(可自行孵化)。
主要实现功能:
1. y轴取整、归0计算
2. 曲线绘制
3. 长按滑动绘制取值
配置相关注解见文章下方js注释
示例图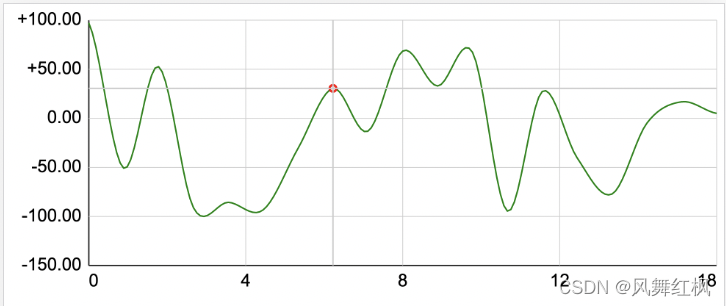
使用示例
体验时不要忘记是在移动端哦~,js源码在下面!!!
<html>
    <head>
        <style>
            html,body,canvas{
                width:100%;
                height:100%;
                margin:0;
                padding:0;
            }
            canvas{
                display: block;
                width: 100%;
                height: 400px;
            }
        </style>
    </head>
    <body>
        <canvas></canvas>
    </body>
    <script src="./chart.js"></script>
    <script>
        let chart1 = new chart({
            canvas: document.getElementsByTagName('canvas')[0],
            data: initData(),
            config: {
                events:{
                    drawStyle:{
                        show: true,
                        point: {
                            show: true,
                            insideArc: {
                                r: 3,
                                color: '#fff'
                            },
                            outside: {
                                r: 6,
                                color: 'red'
                            }
                        },
                        line:{
                            horizontalLine:{
                                show: true,
                                lineColor: '#ccc',
                                width: 1
                            },
                            verticalLine:{
                                show: true,
                                lineColor: '#ccc',
                                width: 1
                            }
                        },
                    },
                    moveEvent: (point) => {
                        console.log(point)
                    }
                }
            }
        })
        chart1.draw();


        //模拟数据生产函数
        function initData(){
            var arr = [];
            for(var i = 0 ; i < 19 ; i++){
                arr.push({
                    // name: '05-' + (i + 1 + '').padStart(2 , '0'),
                    name: i,
                    value: rand(-10000,10000) / 100
                })
            }
            return arr;
        }
        //随机数函数
        function rand(n,m){
            var c = m - n + 1;
            return Math.floor(Math.random() * c + n);
        }
    </script>
</html>
源码如下
此处有一个Object.assign的问题,具体各位可知道是什么么?
/*
canvas: 目标dom
data: 数据 格式如下
[{
name: 描述, 字符串
value: 值 数字
}]
config: 配置项
{
padding:[10,10,0,0], canvas可绘制区域padding 详见padding参考图
yLabel:{ Y轴相关
isRounding: true, 是否取整Y轴数值 按0.1,1,10...取整 且 自行计算是否展露0
line:{ 线相关
show: true, 是否展示
num: 5, 数目
lineColor: '#333', 颜色
width: 2 宽度
},
font: { 字体相关
size: 24, 字体大小
color: '#000', 颜色
family: 'Arial', 字体
padding: [0, 10, 0, 10] 字padding值,只取用1,3下标数据 详见padding参考图
}
},
xLabel: { X轴相关,同Y轴相关
line:{
show: true,
num: 5,
lineColor: '#333',
width: 2
},
font: {
size: 24,
color: '#000',
family: 'Arial',
padding: [10, 0, 10, 0] 字padding值,只取用0,2下标数据 详见padding参考图
}
},
grid:{ 网格相关
horizontalLine:{ 横轴网格
show: true, 是否展示
lineColor: '#ccc', 颜色
width: 1 宽度
},
verticalLine:{ 竖轴网格
show: true, 是否展示
lineColor: '#ccc', 颜色
width: 1 宽度
}
},
line:{ 折线、曲线相关
type: 1, 类型0:直线,1:曲线
pointsPow: 10, 曲线点数扩散倍数,默认10,直线时无用
lineColor: 'green', 颜色
width: 2, 宽度
points:{ 线上点相关
show: false, 是否展示
insideArc: {
r: 3, 内圈半径
color: '#fff' 内圈颜色
},
outside: {
r: 6, 外圈半径
color: 'red' 外圈颜色
}
}
},
events:{ 事件相关(代码只有滑动事件,其他事件自行扩展)
drawStyle:{ 事件绘制
show: true, 是否展示
point: {
show: true, 是否绘制点
insideArc: {
r: 3, 内圈半径
color: '#fff' 内圈颜色
},
outside: {
r: 6,
color: 'red'
}
},
line:{
horizontalLine:{ 横轴
show: true,
lineColor: '#ccc',
width: 1
},
verticalLine:{ 竖轴
show: true,
lineColor: '#ccc',
width: 1
}
},
},
moveEvent: (point) => { 事件回调函数
console.log(point)
},
},
}
*/
class chart {
constructor(opts) {
this.dpr = 1;
this.canvas = opts.canvas;
this.ctx = null;
this.data = opts.data;
this.dataValueMax = opts.data[0].value;
this.dataValueMin = opts.data[0].value;
this.config = Object.assign({
padding:[10,10,0,0],
events:{
drawStyle:{
show: true,
point: {
show: true,
insideArc: {
r: 3,
color: '#fff'
},
outside: {
r: 6,
color: 'red'
}
},
line:{
horizontalLine:{
show: true,
lineColor: '#ccc',
width: 1
},
verticalLine:{
show: true,
lineColor: '#ccc',
width: 1
}
},
},
// moveEvent: (point) => {
// console.log(point)
// },
},
line:{
type: 1,
pointsPow: 10,
lineColor: 'green',
width: 2,
points:{
show: false,
insideArc: {
r: 3,
color: '#fff'
},
outside: {
r: 6,
color: 'red'
}
}
},
yLabel:{
isRounding: true,
line:{
show: true,
num: 5,
lineColor: '#333',
width: 2
},
font: {
size: 24,
color: '#000',
family: 'Arial',
padding: [0, 10, 0, 10]
}
},
xLabel: {
line:{
show: true,
num: 5,
lineColor: '#333',
width: 2
},
font: {
size: 24,
color: '#000',
family: 'Arial',
padding: [10, 0, 10, 0]
}
},
grid:{
horizontalLine:{
show: true,
lineColor: '#ccc',
width: 1
},
verticalLine:{
show: true,
lineColor: '#ccc',
width: 1
}
}
}, opts.config);
this.yLabel = [];
this.xLabel = [];
this.init();
}
init() {
let devicePixelRatio = window.devicePixelRatio;
if (devicePixelRatio >= 3) {
this.dpr = 3;
} else if (devicePixelRatio >= 2) {
this.dpr = 2;
} else {
this.dpr = 1;
}
this.canvas.width = this.canvas.offsetWidth * this.dpr;
this.canvas.height = this.canvas.offsetHeight * this.dpr;
this.ctx = this.canvas.getContext('2d');
}
draw() {
if (!this.data.length) {
return
}
let newData = [];
switch (this.config.line.type) {
case 0:
//绘制直线
newData = JSON.parse(JSON.stringify(this.data));
this.initCoordinateSystem(newData);
this.initData(newData, true);
this.drawCoordinateSystem();
this.drawLine(newData);
break;
case 1:
//绘制曲线
newData = JSON.parse(JSON.stringify(this.getNewData()));
this.initCoordinateSystem(newData);
this.initData(newData, false);
this.drawCoordinateSystem();
this.drawLine(newData);
break;
default:
//绘制直线
newData = JSON.parse(JSON.stringify(this.data));
this.initCoordinateSystem(newData);
this.initData(newData, true);
this.drawCoordinateSystem();
this.drawLine(newData);
break;
}
this.events(JSON.parse(JSON.stringify(newData)));
}
// 事件相关
events(data) {
data = data.filter(item => {
return item.isReal;
});
if (this.config.events.moveEvent) {
//存储canvas初始态
if (this.config.events.drawStyle.show) {
this.clearMovePointTimer = null;
this.canvasLayer = this.ctx.getImageData(0, 0, this.canvas.width, this.canvas.height);
}
//加锁,防止滑动过快,处理慢问题
this.moveFlag = true;
this.canvas.addEventListener('touchmove', (e) => {
if (this.moveFlag) {
this.moveFlag = false;
let clientX = e.changedTouches[0].clientX * this.dpr;
let point = null;
let pointLeft = null;
let pointRight = null;
for (let i = 0; i < data.length; i++) {
if (i === data.length - 1 || (data[i].x > clientX && i === 0)) {
pointLeft = data[i];
pointRight = data[i];
} else if (data[i].x > clientX) {
pointRight = data[i];
break;
} else {
pointLeft = data[i];
}
}
if (clientX - pointLeft.x / this.dpr > pointRight.x / this.dpr - clientX) {
point = pointRight;
} else {
point = pointLeft;
}
this.config.events.moveEvent(point);
if (this.config.events.drawStyle.show) {
this.drawMovePoint(point);
} else {
this.moveFlag = true;
}
}
e.preventDefault();
})
}
}
drawMovePoint(point) {
if (!this.ctx) {
return
}
this.ctx.putImageData(this.canvasLayer, 0, 0);
if (this.config.events.drawStyle.point.show) {
this.ctx.beginPath();
this.ctx.fillStyle = this.config.events.drawStyle.point.outside.color;
this.ctx.arc(point.x, point.y, this.config.events.drawStyle.point.outside.r * this.dpr, 0, 2 * Math.PI);
this.ctx.fill();
this.ctx.closePath();
this.ctx.beginPath();
this.ctx.fillStyle = this.config.events.drawStyle.point.insideArc.color;
this.ctx.arc(point.x, point.y, this.config.events.drawStyle.point.insideArc.r * this.dpr, 0, 2 * Math.PI);
this.ctx.fill();
this.ctx.closePath();
}
if (this.config.events.drawStyle.line.horizontalLine.show) {
this.ctx.beginPath();
this.ctx.strokeStyle = this.config.events.drawStyle.line.horizontalLine.lineColor;
this.ctx.width = this.config.events.drawStyle.line.horizontalLine.width;
this.ctx.moveTo(this.xLabel[0].x, point.y);
this.ctx.lineTo(this.xLabel[this.xLabel.length - 1].x, point.y);
this.ctx.stroke();
this.ctx.closePath();
}
if (this.config.events.drawStyle.line.verticalLine.show) {
this.ctx.beginPath();
this.ctx.strokeStyle = this.config.events.drawStyle.line.horizontalLine.lineColor;
this.ctx.width = this.config.events.drawStyle.line.horizontalLine.width;
this.ctx.moveTo(point.x, this.yLabel[0].y);
this.ctx.lineTo(point.x, this.yLabel[this.yLabel.length - 1].y);
this.ctx.stroke();
this.ctx.closePath();
}
// 防抖消除
clearTimeout(this.clearMovePointTimer);
this.clearMovePointTimer = null;
this.clearMovePointTimer = setTimeout(() => {
clearTimeout(this.clearMovePointTimer);
this.clearMovePointTimer = null;
if (!this.ctx) {
return
}
this.ctx.putImageData(this.canvasLayer, 0, 0);
}, 3000)
this.moveFlag = true;
}
//初始化数据坐标点
initData(data, isReal) {
let xWidthStep = (this.canvas.width - this.yLabel[0].x - (this.config.yLabel.font.padding[1] + this.config.padding[1]) * this.dpr) / (data.length - 1);
data.forEach((item, index) => {
item.isReal = isReal || item.isReal;
item.x = this.yLabel[0].x + this.config.yLabel.font.padding[1] * this.dpr + xWidthStep * index;
item.y = this.calculateY(item.value);
})
}
getNewData() {
let points = [];
let divisions = (this.data.length - 1) * this.config.line.pointsPow;
for (let d = 0; d <= divisions; d++) {
points.push(this.getPoint(d / divisions, divisions));
}
return points;
}
getPoint(t, divisions) {
const points = this.data;
const isRealI = t * divisions % this.config.line.pointsPow;
const p = (points.length - 1) * t;
const intPoint = Math.floor(p);
const weight = p - intPoint;
const p0 = points[intPoint === 0 ? intPoint : intPoint - 1];
const p1 = points[intPoint];
const p2 = points[intPoint > points.length - 2 ? points.length - 1 : intPoint + 1];
const p3 = points[intPoint > points.length - 3 ? points.length - 1 : intPoint + 2];
return {
isReal: isRealI === 0,
name: isRealI === 0 ? points[t * divisions / this.config.line.pointsPow].name : null,
value: this.catmullRom(weight, p0.value, p1.value, p2.value, p3.value)
};
}
catmullRom(t, p0, p1, p2, p3) {
const v0 = (p2 - p0) * 0.5;
const v1 = (p3 - p1) * 0.5;
const t2 = t * t;
const t3 = t * t2;
return (2 * p1 - 2 * p2 + v0 + v1) * t3 + (-3 * p1 + 3 * p2 - 2 * v0 - v1) * t2 + v0 * t + p1;
}
// 连接点绘制线
drawLine(data) {
this.ctx.beginPath();
this.ctx.lineWidth = this.config.line.width * this.dpr;
this.ctx.strokeStyle = this.config.line.lineColor;
this.ctx.lineJoin = 'round';
data.forEach(item => {
this.ctx.lineTo(item.x, item.y);
})
this.ctx.stroke();
this.ctx.closePath();
if (this.config.line.points.show) {
data.forEach(item => {
if (item.isReal) {
this.ctx.beginPath();
this.ctx.fillStyle = this.config.line.points.outside.color;
this.ctx.arc(item.x, item.y, this.config.line.points.outside.r * this.dpr, 0, 2 * Math.PI);
this.ctx.fill();
this.ctx.closePath();
this.ctx.beginPath();
this.ctx.fillStyle = this.config.line.points.insideArc.color;
this.ctx.arc(item.x, item.y, this.config.line.points.insideArc.r * this.dpr, 0, 2 * Math.PI);
this.ctx.fill();
this.ctx.closePath();
}
})
}
}
//初始化坐标系
initCoordinateSystem(data) {
data.forEach(item => {
if (typeof item.value === 'number') {
if (item.value > this.dataValueMax) {
this.dataValueMax = item.value;
} else if (item.value < this.dataValueMin) {
this.dataValueMin = item.value;
}
}
})
this.yLabel = this.config.yLabel.isRounding ? this.buildYLabelRounding() : this.buildYLabel();
this.xLabel = this.buildXLabel(JSON.parse(JSON.stringify(this.data)));
}
// x轴值处理
buildXLabel(data) {
let xLabels = [];
if (data.length === 1) {
this.config.xLabel.line.num = 1;
xLabels = data;
} else if (data.length === 2) {
this.config.xLabel.line.num = 2;
xLabels = data;
} else if (data.length < this.config.xLabel.line.num * 2 + (this.config.xLabel.line.num - 2)) {
this.config.xLabel.line.num = 2;
xLabels = [data[0], data[data.length - 1]];
} else {
let xLableStep = Math.floor((data.length - this.config.xLabel.line.num) / (this.config.xLabel.line.num - 1));
for (let i = 0; i < this.config.xLabel.line.num - 1; i++) {
xLabels.push(data[xLableStep * i + i]);
}
xLabels.push(data[data.length - 1]);
}
let y = this.canvas.height - (this.config.xLabel.font.padding[2] + this.config.padding[2]) * this.dpr;
let xWidthStep = (this.canvas.width - this.yLabel[0].x - (this.config.yLabel.font.padding[1] + this.config.padding[1]) * this.dpr) / (xLabels.length - 1);
for (let i = 0; i < xLabels.length; i++) {
xLabels[i].x = this.yLabel[0].x + this.config.yLabel.font.padding[1] * this.dpr + xWidthStep * i;
xLabels[i].y = y;
xLabels[i].textAlign = i === 0 ? 'left' : (i === xLabels.length - 1 ? 'right' : 'center');
xLabels[i].textBaseline = 'bottom';
}
return xLabels
}
// 取整y轴值处理
buildYLabelRounding() {
let newMax = Math.ceil(this.dataValueMax * 100);
let newMin = Math.floor(this.dataValueMin * 100);
let difference = newMax - newMin;
let step = difference / this.config.yLabel.line.num;
let isShowNought = step;
// 寻找距离0最近的y
// 小幅波动特殊处理
// 如果newMin > 0 则newMin距离0最近 如果小于可接受比例,则展示0
// 如果newMax < 0 则newMax距离0最近 如果小于可接受比例,则展示0
// 否则数据路过0 让y轴坐标线距离0最近的参数回归0
if (difference < 10) {
step = 10;
newMax = Math.ceil((newMax + 20) / 10) * 10;
newMin = newMax - step * this.config.yLabel.line.num;
}
let stepIndex = 1;
while (difference >= Math.pow(10, stepIndex + 1) * (this.config.yLabel.line.num - 1)) {
stepIndex++;
}
let ceilNumber = Math.pow(10, stepIndex);
if (newMin >= 0) {
if (newMin < isShowNought) {
newMax = Math.ceil(newMax / ceilNumber) * ceilNumber;
step = Math.ceil(newMax / this.config.yLabel.line.num / ceilNumber) * ceilNumber;
if (newMax % step) {
newMax = step * Math.ceil(newMax / step);
}
newMin = newMax - step * this.config.yLabel.line.num;
} else {
newMin = Math.floor(newMin / ceilNumber) * ceilNumber;
step = Math.ceil((newMax - newMin) / this.config.yLabel.line.num / ceilNumber) * ceilNumber;
newMax = newMin + step * this.config.yLabel.line.num;
}
} else if (newMax <= 0) {
if (-newMax < isShowNought) {
newMin = Math.floor(newMin / ceilNumber) * ceilNumber;
step = Math.ceil(-newMin / this.config.yLabel.line.num / ceilNumber) * ceilNumber;
if (-newMin % step) {
newMin = step * Math.floor(newMin / step);
}
newMax = newMin + step * this.config.yLabel.line.num;
} else {
newMax = Math.ceil(newMax / ceilNumber) * ceilNumber;
step = Math.ceil((newMax - newMin) / this.config.yLabel.line.num / ceilNumber) * ceilNumber;
newMin = newMax - step * this.config.yLabel.line.num;
}
} else {
// 计算到0的步时
let i = 0;
// newMax = Math.ceil(newMax / ceilNumber) * ceilNumber;
// newMin = Math.floor(newMin / ceilNumber) * ceilNumber;
let newValue = newMax > -newMin ? -newMin : newMax;
let newValueOld = newValue;
while (newValue - step >= 0) {
newValue -= step;
i++;
}
let supplementValue1 = newValueOld - step * i;
let supplementValue2 = step * (i + 1) - newValueOld;
// 让y轴坐标线距离0最近的参数回归0 加大step
if (i === 0) {
if (newMax > -newMin) {
step = Math.ceil(newMax / (this.config.yLabel.line.num - 1) / ceilNumber) * ceilNumber;
newMax = step * (this.config.yLabel.line.num - 1);
newMin = -step;
} else {
step = Math.ceil(-newMin / (this.config.yLabel.line.num - 1) / ceilNumber) * ceilNumber;
newMax = step;
newMin = -step * (this.config.yLabel.line.num - 1);
}
} else if (supplementValue1 > supplementValue2) {
if (newMax > -newMin) {
// console.log(1, i);
// 采用newMin计算进入 0上方步长小 用newMax加大step
step = Math.ceil(newMax / (this.config.yLabel.line.num - (i + 1)) / ceilNumber) * ceilNumber;
newMax = step * (this.config.yLabel.line.num - (i + 1));
newMin = newMax - step * this.config.yLabel.line.num;
} else {
// console.log(2, i);
// 采用newMax计算进入 0下方步长小 用newMin加大step
step = Math.ceil(-newMin / (this.config.yLabel.line.num - (i + 1)) / ceilNumber) * ceilNumber;
newMin = -step * (this.config.yLabel.line.num - (i + 1));
newMax = newMin + step * this.config.yLabel.line.num;
}
} else {
if (newMax > -newMin) {
// console.log(3, i);
// 采用newMin计算进入 0下方步长小 用newMin加大step
step = Math.ceil(-newMin / i / ceilNumber) * ceilNumber;
newMin = -step * i;
newMax = newMin + step * this.config.yLabel.line.num;
} else {
// console.log(4, i);
// 采用newMax计算进入 0上方步长小 用newMax加大step
step = Math.ceil(newMax / i / ceilNumber) * ceilNumber;
newMax = step * i;
newMin = newMax - step * this.config.yLabel.line.num;
}
}
}
this.dataValueMax = newMax / 100;
this.dataValueMin = newMin / 100;
step = step / 100;
return this.buildYLabel(step);
}
// y轴值处理
buildYLabel(step) {
if (!step) {
let difference = this.dataValueMax - this.dataValueMin;
step = difference / this.config.yLabel.line.num;
}
this.ctx.font = this.config.yLabel.font.size * this.dpr + 'px ' + this.config.yLabel.font.family;
let dataValueMaxTextWidth = this.ctx.measureText((this.dataValueMax > 0 ? '+' : '') + this.dataValueMax.toFixed(2)).width;
let dataValueMinTextWidth = this.ctx.measureText((this.dataValueMax > 0 ? '+' : '') + this.dataValueMin.toFixed(2)).width;
let yLableTextWidth = (dataValueMaxTextWidth > dataValueMinTextWidth ? dataValueMaxTextWidth : dataValueMinTextWidth) + (this.config.padding[3] + this.config.yLabel.font.padding[3]) * this.dpr;
let cur = '';
let yLabels = [];
for (let i = 0; i <= this.config.yLabel.line.num; i++) {
cur = (this.dataValueMin + i * step).toFixed(2);
if (+cur === 0) {
cur = '0.00';
} else if (+cur > 0) {
cur = `+${cur}`;
}
yLabels.push({
value: cur,
x: yLableTextWidth,
y: this.calculateY(+cur),
textAlign: 'right',
textBaseline: 'middle'
});
}
return yLabels
}
calculateY(value) {
return (this.config.yLabel.font.size / 2 + this.config.padding[0]) * this.dpr + (this.dataValueMax - value) / (this.dataValueMax - this.dataValueMin) * (this.canvas.height - (this.config.padding[0] + this.config.padding[2] + this.config.xLabel.font.size + this.config.xLabel.font.padding[0] + this.config.xLabel.font.padding[2] + this.config.yLabel.font.size / 2) * this.dpr);
}
//绘制坐标系
drawCoordinateSystem() {
// 绘制y轴
if (this.config.yLabel.line.show) {
for (let i = 0; i < this.yLabel.length; i++) {
this.ctx.beginPath();
this.ctx.fillStyle = this.config.yLabel.font.color;
this.ctx.textAlign = this.yLabel[i].textAlign;
this.ctx.textBaseline = this.yLabel[i].textBaseline;
this.ctx.font = this.config.yLabel.font.size * this.dpr + 'px ' + this.config.yLabel.font.family;
this.ctx.fillText(this.yLabel[i].value, this.yLabel[i].x, this.yLabel[i].y)
this.ctx.closePath();
}
this.ctx.beginPath();
this.ctx.lineWidth = this.config.yLabel.line.width * this.dpr;
this.ctx.strokeStyle = this.config.yLabel.line.lineColor;
this.ctx.moveTo(this.yLabel[0].x + this.config.yLabel.font.padding[1] * this.dpr, this.yLabel[0].y);
this.ctx.lineTo(this.yLabel[this.yLabel.length - 1].x + this.config.yLabel.font.padding[1] * this.dpr, this.yLabel[this.yLabel.length - 1].y);
this.ctx.stroke();
this.ctx.closePath();
}
// 绘制x轴
if (this.config.xLabel.line.show) {
for (let i = 0; i < this.xLabel.length; i++) {
this.ctx.beginPath();
this.ctx.fillStyle = this.config.xLabel.font.color;
this.ctx.textAlign = this.xLabel[i].textAlign;
this.ctx.textBaseline = this.xLabel[i].textBaseline;
this.ctx.font = this.config.xLabel.font.size * this.dpr + 'px ' + this.config.xLabel.font.family;
this.ctx.fillText(this.xLabel[i].name, this.xLabel[i].x, this.xLabel[i].y)
this.ctx.closePath();
}
this.ctx.beginPath();
this.ctx.lineWidth = this.config.xLabel.line.width * this.dpr;
this.ctx.strokeStyle = this.config.xLabel.line.lineColor;
this.ctx.moveTo(this.xLabel[0].x, this.xLabel[0].y - (this.config.xLabel.font.padding[0] + this.config.xLabel.font.size) * this.dpr);
this.ctx.lineTo(this.xLabel[this.xLabel.length - 1].x, this.xLabel[0].y - (this.config.xLabel.font.padding[0] + this.config.xLabel.font.size) * this.dpr);
this.ctx.stroke();
this.ctx.closePath();
}
// 网格横线
if (this.config.grid.horizontalLine.show) {
for (let i = 1; i < this.yLabel.length; i++) {
this.ctx.beginPath();
this.ctx.lineWidth = this.config.grid.horizontalLine.width * this.dpr;
this.ctx.strokeStyle = this.config.grid.horizontalLine.lineColor;
this.ctx.moveTo(this.xLabel[0].x, this.yLabel[i].y);
this.ctx.lineTo(this.xLabel[this.xLabel.length - 1].x, this.yLabel[i].y);
this.ctx.stroke();
this.ctx.closePath();
}
}
// 网格竖线
if (this.config.grid.verticalLine.show) {
for (let i = 1; i < this.xLabel.length; i++) {
this.ctx.beginPath();
this.ctx.lineWidth = this.config.grid.verticalLine.width * this.dpr;
this.ctx.strokeStyle = this.config.grid.verticalLine.lineColor;
this.ctx.moveTo(this.xLabel[i].x, this.yLabel[this.yLabel.length - 1].y);
this.ctx.lineTo(this.xLabel[i].x, this.xLabel[0].y - (this.config.xLabel.font.padding[0] + this.config.xLabel.font.size) * this.dpr);
this.ctx.stroke();
this.ctx.closePath();
}
}
}
}
js源码padding图解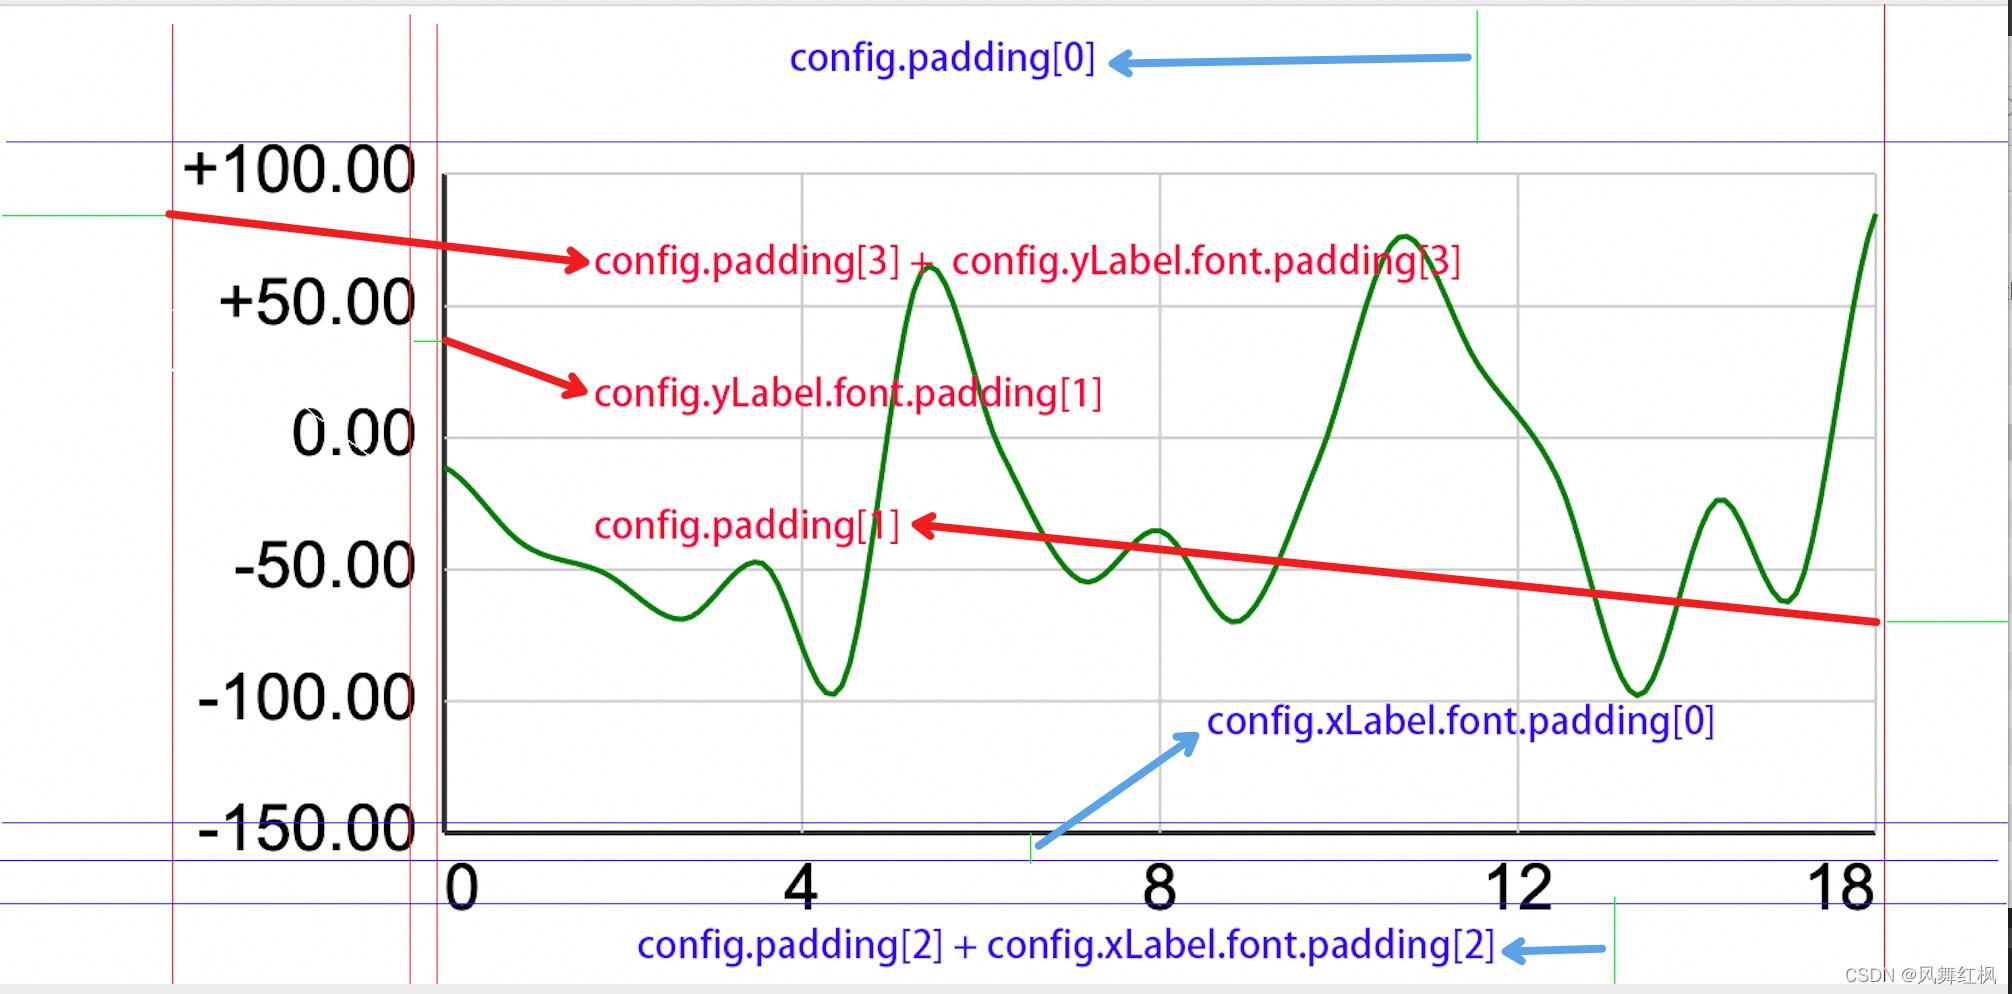
结语
后面时候继续完善增加文章开始提到的其他类图表,加油冲冲冲!


 4613
4613


 被折叠的 条评论
为什么被折叠?
被折叠的 条评论
为什么被折叠?
 到【灌水乐园】发言


