


最近信用办项目要将有关统计的平面柱状图改为立体柱状图,用了jfreechart。简单例子,分享一下。
1,首先,引入IText-2.1.5.jar jcommon-1.0.17.jar jfreechart-1.0.14.jar
2,代码
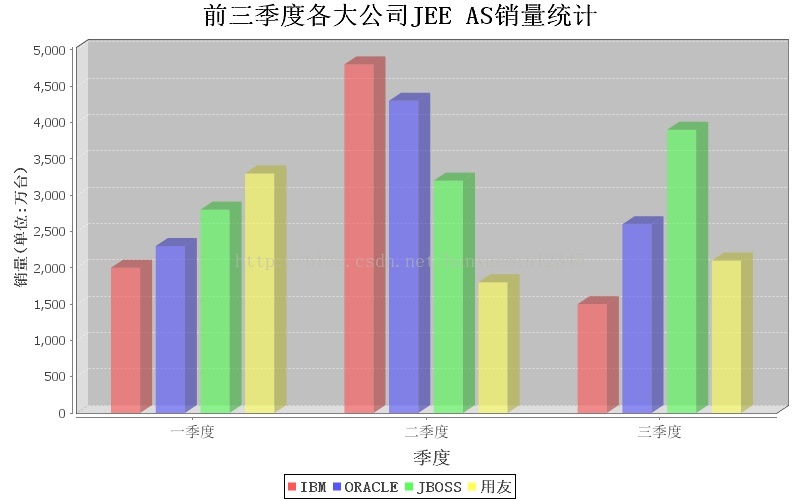
柱状图:
<span style="font-family:KaiTi_GB2312;font-size:18px;">import java.awt.Font;
import java.io.File;

import org.jfree.chart.ChartFactory;
import org.jfree.chart.ChartUtilities;
import org.jfree.chart.JFreeChart;
import org.jfree.chart.plot.CategoryPlot;
import org.jfree.chart.plot.PlotOrientation;
import org.jfree.data.category.DefaultCategoryDataset;

public class AppBar {

	public static void main(String[] args) throws Exception {
		DefaultCategoryDataset ds = new DefaultCategoryDataset();
		ds.addValue(2000, "IBM", "一季度");
		ds.addValue(2300, "ORACLE", "一季度");
		ds.addValue(2800, "JBOSS", "一季度");
		ds.addValue(3300, "用友", "一季度");

		ds.addValue(4800, "IBM", "二季度");
		ds.addValue(4300, "ORACLE", "二季度");
		ds.addValue(3200, "JBOSS", "二季度");
		ds.addValue(1800, "用友", "二季度");

		ds.addValue(1500, "IBM", "三季度");
		ds.addValue(2600, "ORACLE", "三季度");
		ds.addValue(3900, "JBOSS", "三季度");
		ds.addValue(2100, "用友", "三季度");

		String title = "前三季度各大公司JEE AS销量统计" ;
		JFreeChart chart = ChartFactory.createBarChart3D(title, "季度", "销量(单位:万台)", ds, PlotOrientation.VERTICAL, true, false, false);

		//中文
		chart.getTitle().setFont(new Font("宋体", Font.BOLD, 25));//大标题

		//提示条
		chart.getLegend().setItemFont(new Font("宋体", Font.BOLD, 15));

		CategoryPlot plot = (CategoryPlot) chart.getPlot();
		//域轴字体
		plot.getDomainAxis().setLabelFont(new Font("宋体", Font.BOLD, 18));
		plot.getDomainAxis().setTickLabelFont(new Font("宋体", Font.PLAIN, 15));//小标签字体

		//range
		plot.getRangeAxis().setLabelFont(new Font("宋体", Font.BOLD, 15));

		plot.setForegroundAlpha(0.6f);

		ChartUtilities.saveChartAsJPEG(new File("f:\\bar.jpg"), chart, 800, 500);
	}
}
</span>
运行结果:
饼图:
<span style="font-family:KaiTi_GB2312;font-size:18px;">import java.awt.Font;
import java.io.File;

import javax.imageio.ImageIO;

import org.jfree.chart.ChartFactory;
import org.jfree.chart.ChartUtilities;
import org.jfree.chart.JFreeChart;
import org.jfree.chart.labels.StandardPieSectionLabelGenerator;
import org.jfree.chart.plot.PiePlot;
import org.jfree.data.general.DefaultPieDataset;

public class App {

	public static void main(String[] args) throws Exception {
		//
		String title = "各大公司JEE AS市场占有率统计" ;
		DefaultPieDataset ds = new DefaultPieDataset();
		ds.setValue("IBM", 2000);
		ds.setValue("ORACLE", 3500);
		ds.setValue("JBOSS", 1570);
		ds.setValue("用友", 4400);
		JFreeChart chart = ChartFactory.createPieChart3D(title, ds, true, false, false);

		//中文
		chart.getTitle().setFont(new Font("宋体", Font.BOLD, 25));//标题字体
		chart.getLegend().setItemFont(new Font("宋体", Font.PLAIN, 18));

		//绘图区
		PiePlot plot = (PiePlot) chart.getPlot();
		plot.setLabelFont(new Font("宋体", Font.PLAIN, 15));

		//背景
		//chart.setBackgroundImage(ImageIO.read(new File("f:/sunset.jpg")));//图表区背景
		//plot.setBackgroundImage(ImageIO.read(new File("f:/water.jpg")));

		//设置分裂效果  二维支持 ,三维无此效果
		plot.setExplodePercent("IBM", 0.1f);
		plot.setExplodePercent("JBOSS", 0.2f);

		//设置前景色透明度
		plot.setForegroundAlpha(0.7f);

		//设置标签生成器
		//{0}:公司名称
		//{1}:销量
		//{2}:百分比
		//{3}:总量
		//{4}:
		plot.setLabelGenerator(new StandardPieSectionLabelGenerator("{0}({1}/{3}-{2})"));
		ChartUtilities.saveChartAsJPEG(new File("f:\\pie.jpg"), chart, 800, 500);
	}
}
</span>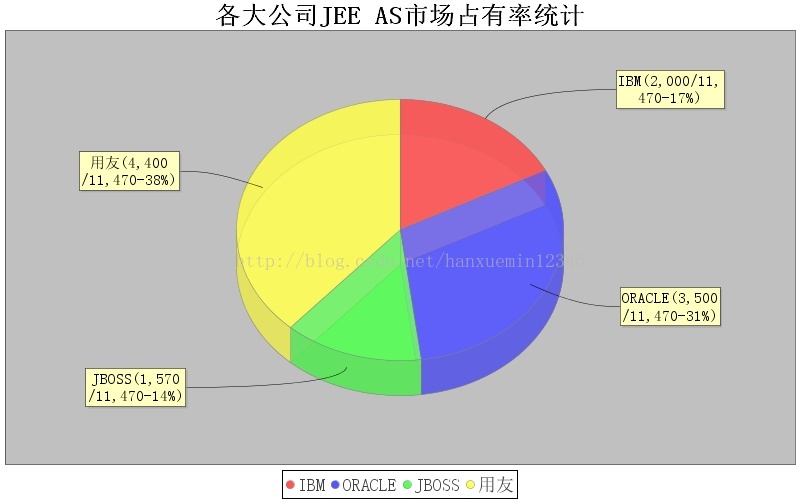
折线图:
<span style="font-family:KaiTi_GB2312;font-size:18px;">import java.awt.Font;
import java.io.File;

import org.jfree.chart.ChartFactory;
import org.jfree.chart.ChartUtilities;
import org.jfree.chart.JFreeChart;
import org.jfree.chart.plot.CategoryPlot;
import org.jfree.chart.plot.PlotOrientation;
import org.jfree.data.category.DefaultCategoryDataset;

public class AppLine {

	public static void main(String[] args) throws Exception {
		DefaultCategoryDataset ds = new DefaultCategoryDataset();
		ds.addValue(2000, "IBM", "一季度");
		ds.addValue(2300, "ORACLE", "一季度");
		ds.addValue(2800, "JBOSS", "一季度");
		ds.addValue(3300, "用友", "一季度");

		ds.addValue(4800, "IBM", "二季度");
		ds.addValue(4300, "ORACLE", "二季度");
		ds.addValue(3200, "JBOSS", "二季度");
		ds.addValue(1800, "用友", "二季度");

		ds.addValue(1500, "IBM", "三季度");
		ds.addValue(2600, "ORACLE", "三季度");
		ds.addValue(3900, "JBOSS", "三季度");
		ds.addValue(2100, "用友", "三季度");

		String title = "前三季度各大公司JEE AS销量统计" ;
		JFreeChart chart = ChartFactory.createLineChart(title, "季度", "销量(单位:万台)", ds, PlotOrientation.VERTICAL, true, false, false);

		//中文
		chart.getTitle().setFont(new Font("宋体", Font.BOLD, 25));//大标题

		//提示条
		chart.getLegend().setItemFont(new Font("宋体", Font.BOLD, 15));

		CategoryPlot plot = (CategoryPlot) chart.getPlot();
		//域轴字体
		plot.getDomainAxis().setLabelFont(new Font("宋体", Font.BOLD, 18));
		plot.getDomainAxis().setTickLabelFont(new Font("宋体", Font.PLAIN, 15));//小标签字体

		//range
		plot.getRangeAxis().setLabelFont(new Font("宋体", Font.BOLD, 15));

		plot.setForegroundAlpha(0.6f);

		ChartUtilities.saveChartAsJPEG(new File("f:\\line.jpg"), chart, 800, 500);
	}
}</span>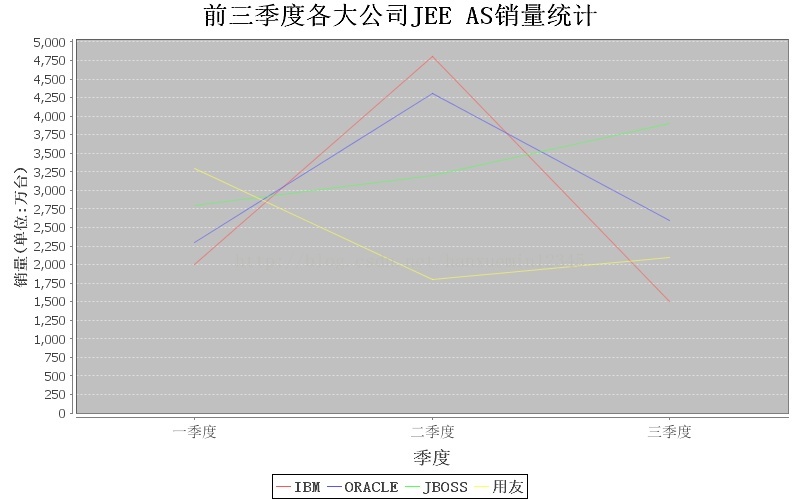


 5068
5068

 被折叠的 条评论
为什么被折叠?
被折叠的 条评论
为什么被折叠?
 到【灌水乐园】发言


