


一、项目背景
近年来,随着各项高新技术的发展,在线上进行学习资源的共享有着欣欣向荣的发展趋势。尤其是在前几年新冠肺炎疫情的冲击下,学生返校进行线下上课愈加困难。在这样的种种契机下,琳琅满目的线上教育平台纷纷出现在世面上。随着教育平台的增加,通过数据分析挖掘消费者的潜在需求、消费偏好成为平台商业过程中的重要环节。
如何利用教育平台的用户信息,掌握用户课程偏好成为了线上教育的热点话题。因此,利用数据分析技术对教育平台的线上信息和用户学习信息进行研究具有重大意义。
本项目目的如下:
- 探寻用户行为规律,寻找高价值用户。
- 分析商品,寻找高贡献商品。
- 分析产品途径。
二、使用“人货场”拆解方式建立指标体系
建立指标体系如下:
三、问题确认
1.【人】基于RFM模型分类用户群,对不同人群给出不同运营策略。
2.【货】分类别找出最受欢迎的商品以及最大交易额的商品。
3.【场】从空间以及时间角度统计用户人数。
四、数据预处理
1.缺失值处理
缺失情况说明:
我们将缺失数据分成三类,分别为空值与0与一些无意义的符号。对于不同的类别,我们将采取不一样的措施。 1、针对数值为 0 的情况,需要回归到原始数据中去判断该数据为 0 时是否具有实际意义。如果没有就将其作为缺失值做删除处理 2、针对数据为空值的情况,如果该特征数据缺失情况低于 10%,则结合该 特征的重要性进行综合判断。如果字段重要性较低,则考虑直接删除,如果字段重要性较高,则进行插值法或者采用数据均值进行填补 3、针对数据为特殊符号的情况,需要结合原始数据判断该数据为缺失值还是异常值。如果是缺失值则如 1 操作进行处理。如果为异常值,则进行异常值处理,具体异常值处理过程将在下文中进行阐述。
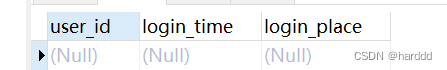
login表:
select *
from login
where user_id is null or user_id = ' '
or login_time is null or login_time = ' '
or login_ place is null or login place = ' ';
结果:
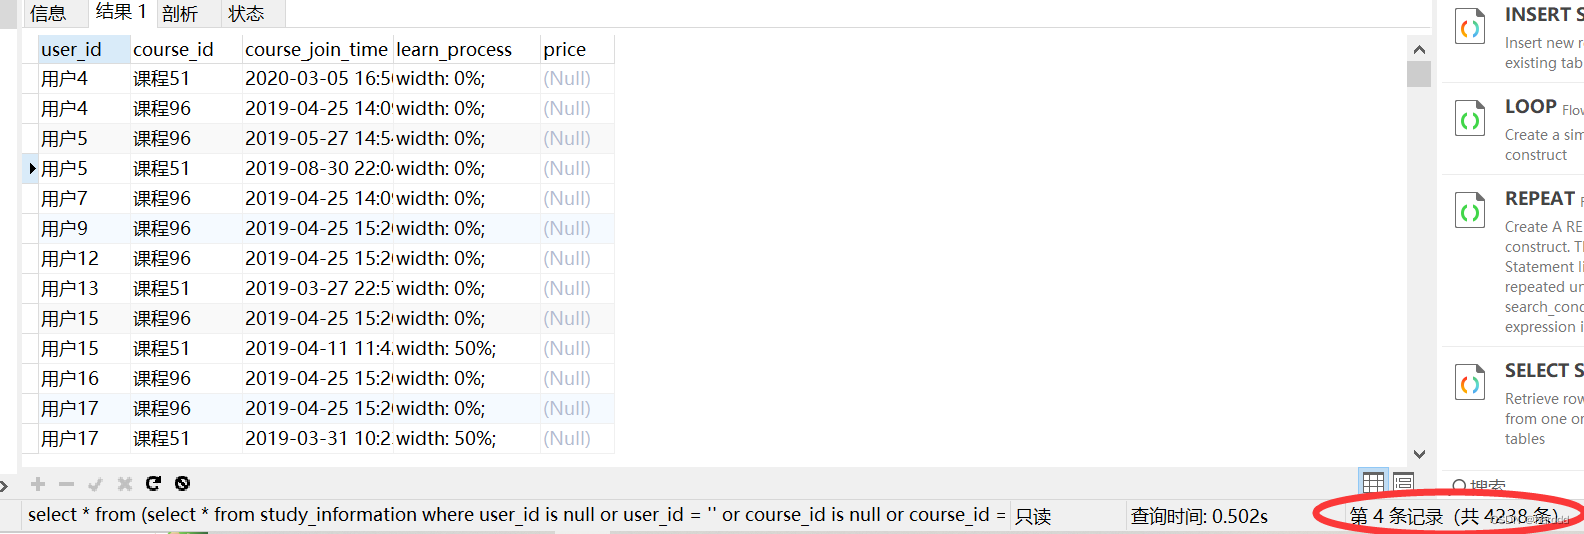
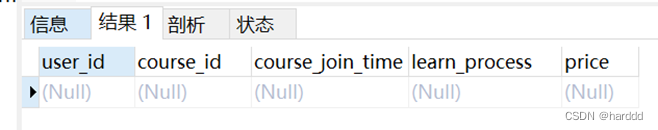
- study_information表:
我们发现price有0的数据,但结合实际意义我们可以知道,这是代表免费课程的意思。
另外我们还发现数据有空值:
select *
from study_information
where user_id is null or user_id = ' '
or course_id is null or course_id = ' '
or course_join_time is null or course_join_time = ' '
or learn_process is null or learn_process = ' '
or price is null or price =  ' ';
结果
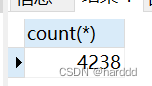
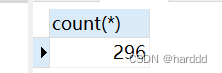
再逐个检查哪一个字段缺失,我们通过计算price缺失的数据条数,发现和总缺失数据条数一样,最终发现是price缺少。
select count(*)
from (
select * from study_information
where user_id is null or user_id = ' '
or course_id is null or course_id = ' '
or course_join_time is null or course_join_time ' '
or learn_process is null or learn_process = ' '
or price is null or price = ''
) a
where price is null;
结果:
而针对空值部分的数据则考虑采取以下措施:对于其余用户出现过的课程,则采用均值代替,对于之前从未出现过程的课程而言,则做删除处理。处理过程如下:
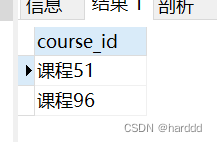
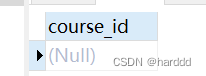
首先课程价格为空的是两个课程:51和96,我们再去搜索是否有别的人选过这两个课并且有price。
select course_id
from study_information
where price is null
group by course_id;
select course_id
from study_information
where price is not null
and (course_id = '课程51' or course_id = '课程96');
结果:
我们发现没有其他选过这个课的人并且有price信息,因为这两个课程占比不大,所以我们删除这些空值行:
DELETE from study_ information
where price iS null;|
Users表:
select *
from users
where user_ id is null or user_id = ' ';
select *
from users
where school is null or school = ' ';
我们发现user_id和school字段有空值,因为user_id比较重要,所以删除这些空值行。而school不太重要我们不做处理。
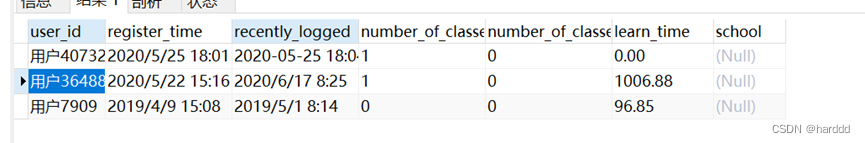
2.异常值处理:
我们发现users表recently_logged数据有问题
select count (*)
from users
where recently_ logged = '--'
结果:
对于这些数据,我们将其分为两类,一类是在study_information出现过的用户,我们用最近的加入课程时间代替最近登陆时间。另一类是在study_information没出现过的用户,我们用它们的注册时间代替最近登陆时间。
update users join
(select user_ id, max(course_join_time) as new from study_information
group by user_ id) s
on users.user_id = s.user_id
set users.recently_logged = s.new
where users.recently_logged = '--';
update users
set recently_logged = register_time
where recently_logged = '--';
3.重复值处理
Login:
select *
from login
group by user_id, login_time, login_place
having count(*) > 1;
结果:
Study_information:
select * from study_information
group by user_id, course_id, course_join_time, learn_process, price
having count(*) > 1;
结果:
 Login表和Study_information均没有重复数据。
Users
select *
from users
group by user_id, register_time, recently_logged, number_of_classes_out, number_of_classes_join, 1earn_time, school
having count(*) >= 1;
有一部分重复数据,我们对所有数据加入一个id字段,我们删除了重复数据保留id最小的。
delete from users where
users.id in
(select id from
    (select *, rank() over(partition by user_id, register_time, recently_ 1ogged,
     number_of_classes_out, number_of_ classes_join,
     learn_time, school order by id asc) as r from users) s
where r > 1);
五、‘人货场’模型建立
1.用户指标体系
我们用最近一次加入课程时间距离表被发出的日期的日期差作为Recency,最近一年加课次数作为Frequency,加入课程的总价格作为Monetary。以这个为基础将用户分为八类:重要价值用户、重要发展用户、重要保持用户、重要挽留用户、一般价值用户、一般发展用户、一般保持用户、一般挽留用户。
| Recency | Frequency | Monetary | 用户分类 |
| 高 | 高 | 高 | 重要价值用户 |
| 高 | 低 | 高 | 重要发展用户 |
| 低 | 高 | 高 | 重要保持用户 |
| 低 | 低 | 高 | 重要挽留用户 |
| 高 | 高 | 低 | 一般价值用户 |
| 高 | 低 | 低 | 一般发展用户 |
| 低 | 高 | 低 | 一般保持用户 |
| 低 | 低 | 低 | 一般挽留用户 |
我们首先计算出每个用户的Recency、Frequency、Monetary,并用视图保存。
select `study_information`.`user_id` AS `user_id`,
(to_days('2020-06-18') - to_days(max(`study_information`.`course_join_time`))) AS `Recency`,
sum(if((cast(`study_information`.`course_join_time` as date) >= ((2019 - 6) - 18)),1,0)) AS `Frequency`,
sum(`study_information`.`price`) AS `Monetary`
from `study_information`
group by `study_information`.`user_id`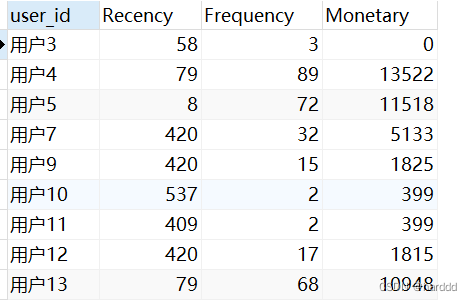
再然后我们计算出R、F、M三者最大最小值,将最小值与最大值之间区间分为五段、对不同段赋分1-5分,其中要注意R是越小分值越高,其余两者则是越大分值越高。对每个用户算出Rvalue、Fvalue、Mvalue。
select min(`rfm`.`Recency`) AS `minr`,max(`rfm`.`Recency`) AS `maxr`
min(`rfm`.`Frequency`) AS `minf`, max(`rfm`.`Frequency`) AS `maxf`,
min(`rfm`.`Monetary`) AS `minm`,max(`rfm`.`Monetary`) AS `maxm` from `rfm`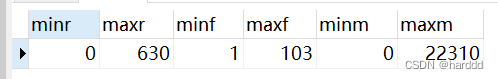
select `rfm`.`user_id` AS `user_id`,
`rfm`.`Recency` AS `Recency`,`rfm`.`Frequency` AS `Frequency`,
`rfm`.`Monetary` AS `monetary`,
(case when (`rfm`.`Recency` >= ((((`rr`.`maxr` - `rr`.`minr`) / 5) * 4) + `rr`.`minr`)) then 1 when ((`rfm`.`Recency` >= ((((`rr`.`maxr` - `rr`.`minr`) / 5) * 3) + `rr`.`minr`)) and (`rfm`.`Recency` < ((((`rr`.`maxr` - `rr`.`minr`) / 5) * 4) + `rr`.`minr`))) then 2 when ((`rfm`.`Recency` >= ((((`rr`.`maxr` - `rr`.`minr`) / 5) * 2) + `rr`.`minr`)) and (`rfm`.`Recency` < ((((`rr`.`maxr` - `rr`.`minr`) / 5) * 3) + `rr`.`minr`))) then 3 when ((`rfm`.`Recency` >= ((((`rr`.`maxr` - `rr`.`minr`) / 5) * 1) + `rr`.`minr`)) and (`rfm`.`Recency` < ((((`rr`.`maxr` - `rr`.`minr`) / 5) * 2) + `rr`.`minr`))) then 4 when (`rfm`.`Recency` < ((((`rr`.`maxr` - `rr`.`minr`) / 5) * 1) + `rr`.`minr`)) then 5 end) AS `rvalue`,
(case when (`rfm`.`Frequency` >= ((((`rr`.`maxf` - `rr`.`minf`) / 5) * 4) + `rr`.`minf`)) then 5 when ((`rfm`.`Frequency` >= ((((`rr`.`maxf` - `rr`.`minf`) / 5) * 3) + `rr`.`minf`)) and (`rfm`.`Frequency` < ((((`rr`.`maxf` - `rr`.`minf`) / 5) * 4) + `rr`.`minf`))) then 4 when ((`rfm`.`Frequency` >= ((((`rr`.`maxf` - `rr`.`minf`) / 5) * 2) + `rr`.`minf`)) and (`rfm`.`Frequency` < ((((`rr`.`maxf` - `rr`.`minf`) / 5) * 3) + `rr`.`minf`))) then 3 when ((`rfm`.`Frequency` >= ((((`rr`.`maxf` - `rr`.`minf`) / 5) * 1) + `rr`.`minf`)) and (`rfm`.`Frequency` < ((((`rr`.`maxf` - `rr`.`minf`) / 5) * 2) + `rr`.`minf`))) then 2 when (`rfm`.`Frequency` < ((((`rr`.`maxf` - `rr`.`minf`) / 5) * 1) + `rr`.`minf`)) then 1 end) AS `fvalue`,
(case when (`rfm`.`Monetary` >= ((((`rr`.`maxm` - `rr`.`minm`) / 5) * 4) + `rr`.`minm`)) then 5 when ((`rfm`.`Monetary` >= ((((`rr`.`maxm` - `rr`.`minm`) / 5) * 3) + `rr`.`minm`)) and (`rfm`.`Monetary` < ((((`rr`.`maxm` - `rr`.`minm`) / 5) * 4) + `rr`.`minm`))) then 4 when ((`rfm`.`Monetary` >= ((((`rr`.`maxm` - `rr`.`minm`) / 5) * 2) + `rr`.`minm`)) and (`rfm`.`Monetary` < ((((`rr`.`maxm` - `rr`.`minm`) / 5) * 3) + `rr`.`minm`))) then 3 when ((`rfm`.`Monetary` >= ((((`rr`.`maxm` - `rr`.`minm`) / 5) * 1) + `rr`.`minm`)) and (`rfm`.`Monetary` < ((((`rr`.`maxm` - `rr`.`minm`) / 5) * 2) + `rr`.`minm`))) then 2 when (`rfm`.`Monetary` < ((((`rr`.`maxm` - `rr`.`minm`) / 5) * 1) + `rr`.`minm`)) then 1 end) AS `mvalue`
from (`rfm` join `rfm_min_and_max` `rr`)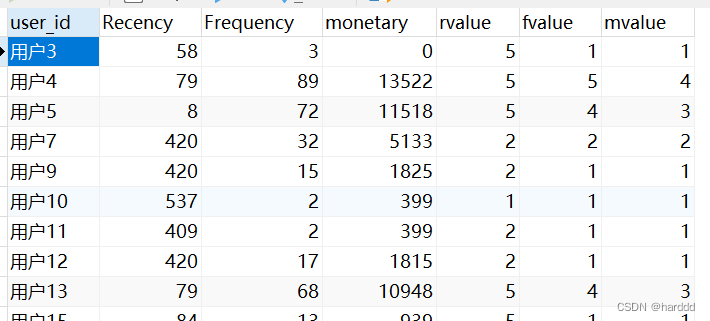
我们再计算出Rvalue、Fvalue、Mvalue的平均值。
select avg(`rfmvalues`.`rvalue`) AS `ar`,
avg(`rfmvalues`.`fvalue`) AS `af`,
avg(`rfmvalues`.`mvalue`) AS `am`
from `rfmvalues`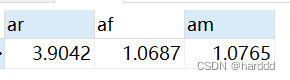
对于高于平均值的我们认为是高,低于的则是低,我们对用户进行分类。
select `rfmvalues`.`user_id` AS `user_id`,
`rfmvalues`.`Recency` AS `Recency`,
`rfmvalues`.`Frequency` AS `Frequency`,
`rfmvalues`.`monetary` AS `Monetary`,
`rfmvalues`.`rvalue` AS `rvalue`,
`rfmvalues`.`fvalue` AS `fvalue`,
`rfmvalues`.`mvalue` AS `mvalue`,
(case when ((`rfmvalues`.`rvalue` > `a`.`ar`) and (`rfmvalues`.`fvalue` > `a`.`af`) and (`rfmvalues`.`mvalue` > `a`.`am`)) then '重要价值用户' when ((`rfmvalues`.`rvalue` > `a`.`ar`) and (`rfmvalues`.`fvalue` <= `a`.`af`) and (`rfmvalues`.`mvalue` > `a`.`am`)) then '重要发展用户' when ((`rfmvalues`.`rvalue` <= `a`.`ar`) and (`rfmvalues`.`fvalue` > `a`.`af`) and (`rfmvalues`.`mvalue` > `a`.`am`)) then '重要保持用户' when ((`rfmvalues`.`rvalue` <= `a`.`ar`) and (`rfmvalues`.`fvalue` <= `a`.`af`) and (`rfmvalues`.`mvalue` > `a`.`am`)) then '重要挽留用户' when ((`rfmvalues`.`rvalue` > `a`.`ar`) and (`rfmvalues`.`fvalue` > `a`.`af`) and (`rfmvalues`.`mvalue` <= `a`.`am`)) then '一般价值用户' when ((`rfmvalues`.`rvalue` > `a`.`ar`) and (`rfmvalues`.`fvalue` <= `a`.`af`) and (`rfmvalues`.`mvalue` <= `a`.`am`)) then '一般发展用户' when ((`rfmvalues`.`rvalue` <= `a`.`ar`) and (`rfmvalues`.`fvalue` > `a`.`af`) and (`rfmvalues`.`mvalue` <= `a`.`am`)) then '一般保持用户' when ((`rfmvalues`.`rvalue` <= `a`.`ar`) and (`rfmvalues`.`fvalue` <= `a`.`af`) and (`rfmvalues`.`mvalue` <= `a`.`am`)) then '一般挽留用户' end) AS `用户分类`
from (`rfmvalues` join `rfmavg` `a`)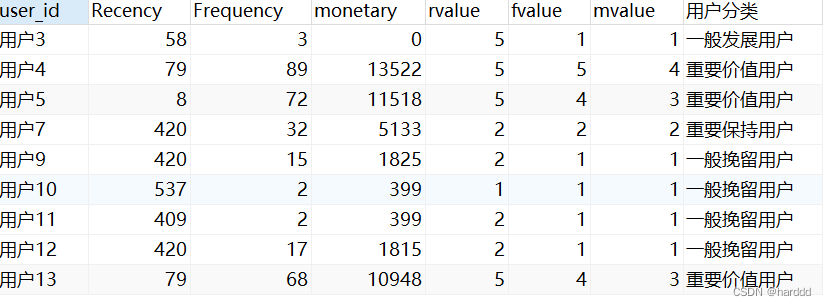
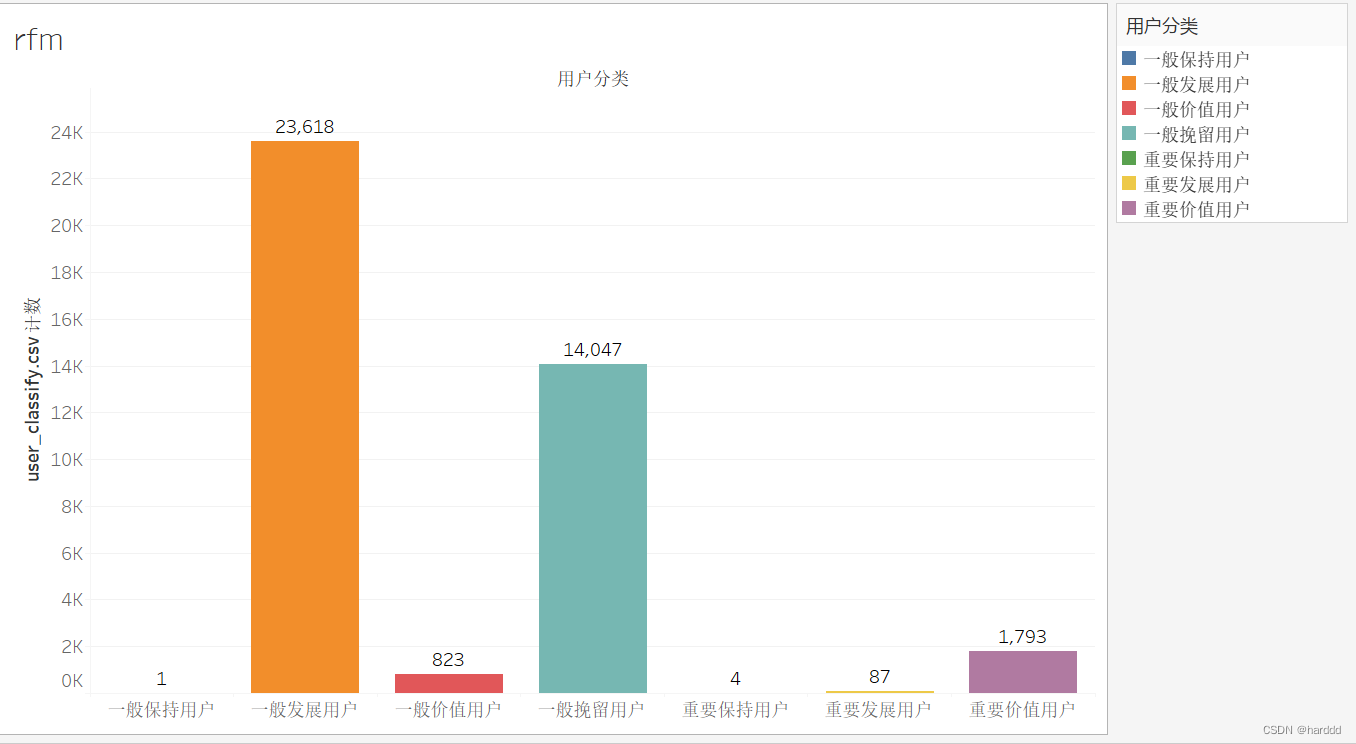
可以看出这家平台的经营并不理想,大部分为一般发展用户,甚至没有重要挽留用户。我们给出的策略如下:重要价值用户:保持长期联系与重点关注;重要保持用户:发放小额优惠券,吸引用户回流;重要发展客户:促导用户办理会员,或者开通积分活动。
2.商品分析(best and worst)
1.best 课程
我们先求出最受欢迎的免费以及非免费课程和最大交易总额课程。
(select course_id as 'most_popular', price, times, category
from course_classify
where category = 'free'
order by times desc
limit 5)
union all
(select course_id as 'most_popular' ,price, times, category
from course_classify
where category = 'not_free'
order by times desc
limit 5)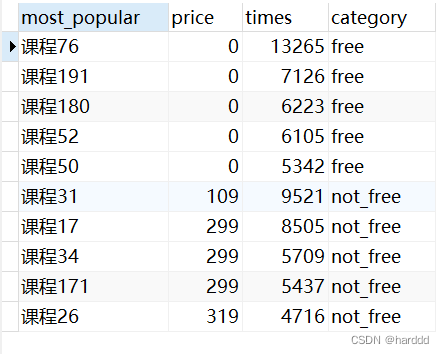
select course_id as 'max_trading' ,price,times, price * times as 'trading_volume'
from course_classify
order by price * times desc
limit 5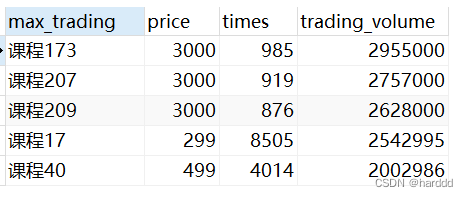
2.worst 课程
(select course_id as 'least_popular', price, times, category
from course_classify
where category = 'free'
order by times asc
limit 5)
union all
(select course_id as 'least_popular' ,price, times, category
from course_classify
where category = 'not_free'
order by times asc
limit 5);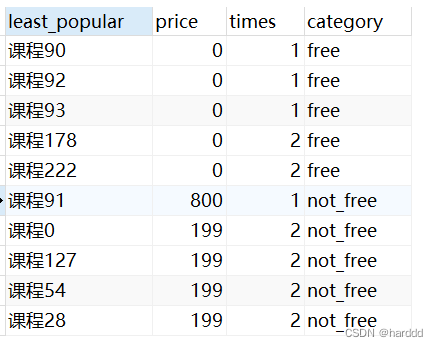
select course_id as 'min_trading' ,price,times, price * times as 'trading_volume'
from course_classify
where price != 0
order by price * times asc
limit 5;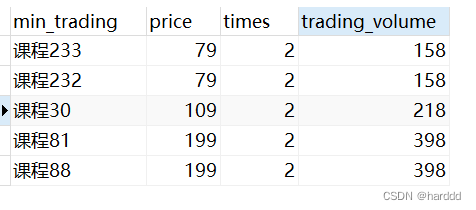
对于平台而言,应该多关注数据好的课程有什么优点,打造更多的爆品课程,而对于数据不好看的课程分析内在原因改进它们。
3.平台分析(空间时间两角度分析)
因为登陆地点是将国家省份城市放在一起,登陆时间是日期与时间在同一个字段里,所以我们先用substring函数和substring_index函数将字段拆分。
SELECT user_id, SUBSTRING_INDEX(login_time,' ', 1) as login_date, SUBSTRING_INDEX(login_time,' ', -1) as login_time,
SUBSTRING(login_place, 1, 2) as '国家', SUBSTRING(login_place, 3, 2) as '省份', SUBSTRING(login_place, 5, 2) as '城市',
case substring(SUBSTRING_INDEX(login_time,' ', -1), 1, 2)
when '00' then '00:00-01:00'
when '01' then '01:00-02:00' when '02' then '02:00-03:00' when '03' then '03:00-04:00' when '04' then '04:00-05:00' when '05' then '05:00-06:00' when '06' then '06:00-07:00' when '07' then '07:00-08:00' when '08'then '08:00-09:00' when '09' then '09:00-10:00' when '10' then '10:00-11:00' when '11' then '11:00-12:00' when '12' then '12:00-13:00' when '13'then '13:00-14:00' when '14' then '14:00-15:00' when '15' then '15:00-16:00' when '16' then '16:00-17:00' when
'17' then '17:00-18:00' when '18' then '18:00-19:00' when '19' then '19:00-20:00' when '20' then '20:00-21:00' when'21' then '21:00-22:00' when '22' then '22:00-23:00' when '23' then '23:00-24:00' end
as timesatage
from login
where  (SUBSTRING(login_place, 3, 3) != '黑龙江' and SUBSTRING(login_place, 3, 3) !='内蒙古')
UNION ALL
SELECT user_id, SUBSTRING_INDEX(login_time,' ', 1) as login_date, SUBSTRING_INDEX(login_time,' ', -1) as login_time,
SUBSTRING(login_place, 1, 2) as '国家', SUBSTRING(login_place, 3, 2) as '省份', SUBSTRING(login_place, 5, 2) as '城市',
case substring(SUBSTRING_INDEX(login_time,' ', -1), 1, 2)
when '00' then '00:00-01:00'
when '01' then '01:00-02:00' when '02' then '02:00-03:00' when '03' then '03:00-04:00' when '04' then '04:00-05:00' when '05' then '05:00-06:00' when '06' then '06:00-07:00' when '07' then '07:00-08:00' when '08'then '08:00-09:00' when '09' then '09:00-10:00' when '10' then '10:00-11:00' when '11' then '11:00-12:00' when '12' then '12:00-13:00' when '13'then '13:00-14:00' when '14' then '14:00-15:00' when '15' then '15:00-16:00' when '16' then '16:00-17:00' when
'17' then '17:00-18:00' when '18' then '18:00-19:00' when '19' then '19:00-20:00' when '20' then '20:00-21:00' when'21' then '21:00-22:00' when '22' then '22:00-23:00' when '23' then '23:00-24:00' end
as timesatage
from login
where  (SUBSTRING(login_place, 3, 3) = '黑龙江' OR SUBSTRING(login_place, 3, 3) ='内蒙古')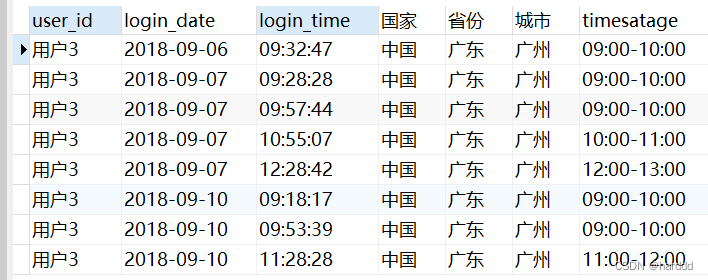
由于这个表比较重要我们将其导出作为loginafter表再导入Navicat以方便。
1.空间角度--用户分布分析
国家分布:
SELECT 国家,  count(*) as '数量',
concat(round(count(*)/
(select count(*) from loginafter)
,4) * 100,'%') as '占比'
from loginafter
group by 国家;
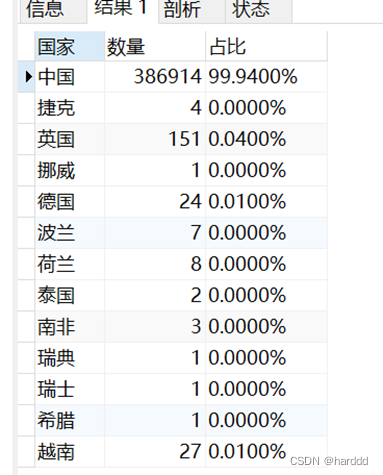
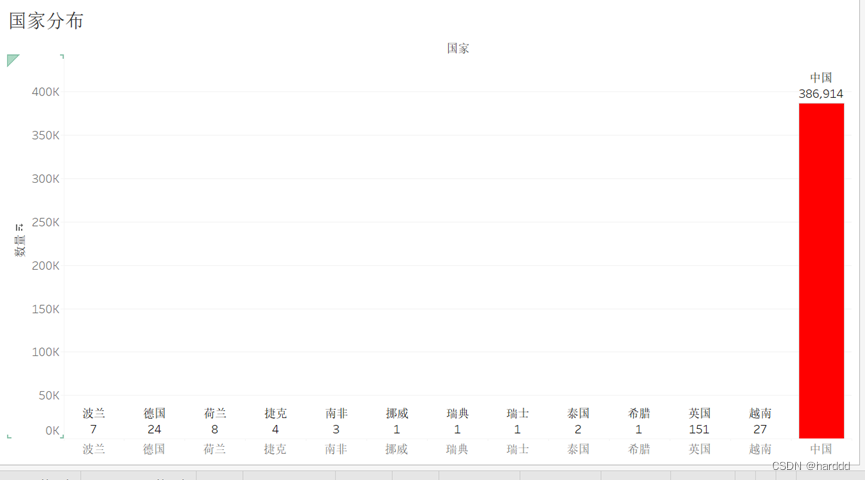
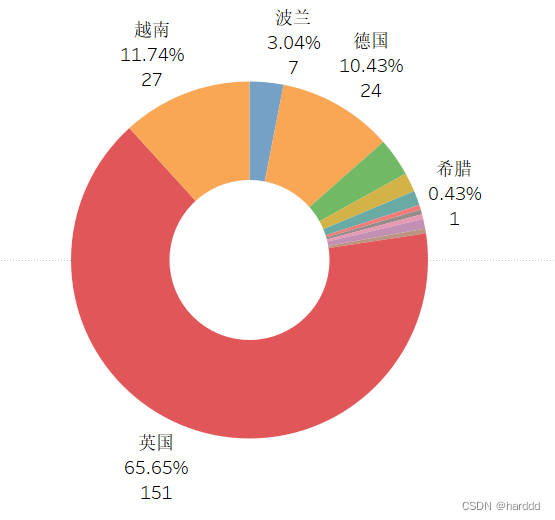
可以发现绝大部分用户都是在中国登陆的,只有0.06%用户在海外登录,其中又以英国最多。
SELECT 国家, count(*) as '数量',
concat( round( count(*)/
(select count(*) from loginafter where 国家 != '中国')
,4) *
100, '%')as '占比'
from loginafter
where 国家 != '中国'
group by 国家;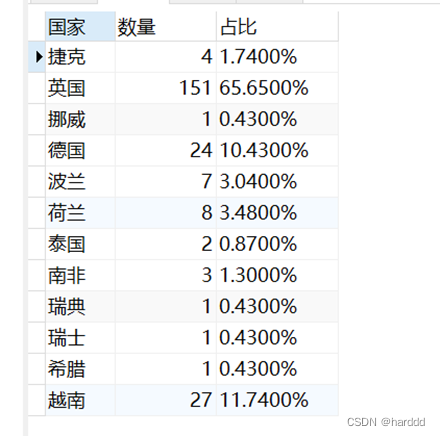
省份分布:
我们发现还有一部分数据无省份,我们在分析省份分布时删除这部分数据,并导出新表,再通过Tableau做图。
select *
from loginafter
where 国家 = '中国' and 省份 is null;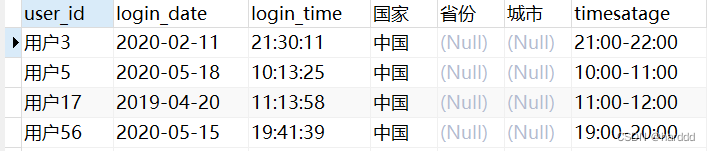
剔除掉这部分数据后,我们用Tableau制作图像如下:
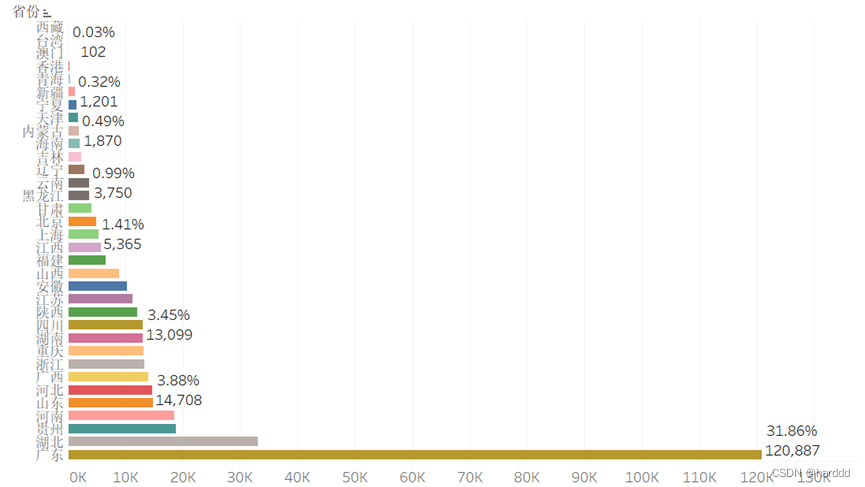

我们发现来自广东的用户是最多的,超过了后20名的省份的总和,如果要线下进行某些调查,广东省会是很好的一个展开的地方。
重点省份城市分布:
我们再针对广东省重点分析。
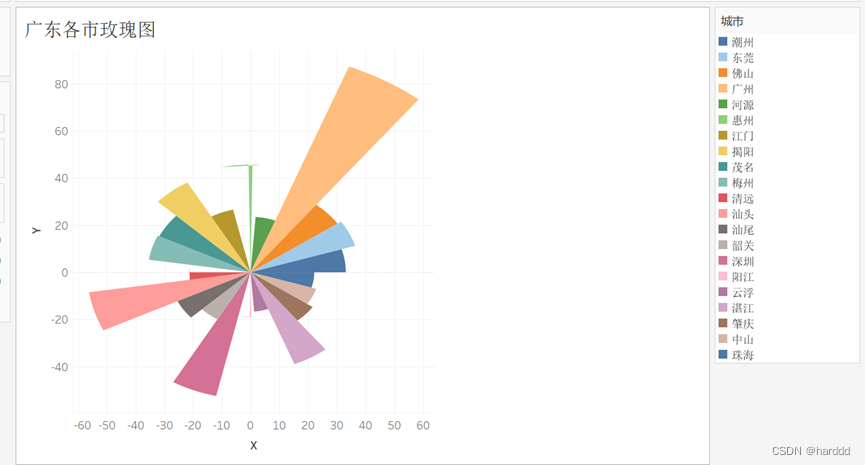
数据大部分集中在广州。
2.时间角度--工作日非工作日用户分布分析
我们先利用Python生成一个日期和工作日节假日对应的表,用于后续和loginafter表连接以区分login_date是否为工作日。
import numpy as np
import pandas as pd
from datetime import datetime
import time
from chinese_calendar import is_workday, is_holiday
df = pd.DataFrame(pd.read_excel(r'C:\Users\33541\Desktop\数据分析\教育平台的线上课程用户行为\日期.xlsx'))
m = df.shape[0]
print(df)
for i in range(0,m):
    day = df['日期'][i]
    df['是否工作日'][i] = is_workday(day.date())
df.to_csv(r'C:\Users\33541\Desktop\数据分析\教育平台的线上课程用户行为\是否工作日日期.csv',index = False, encoding='utf-8')
导入的Excel只是简单的18-20年日期表,我们通过pandas和datetime库判断是否工作日并输出csv文件,再将其导入Navicat与loginafter表连接得到是否工作日字段。
select loginafter.*,
case when 是否工作日 = 'True' then '工作日'  when 是否工作日 = 'False' then '节假日' end as 'is_workday'
from loginafter left join `是否工作日日期`
on login_date = 日期;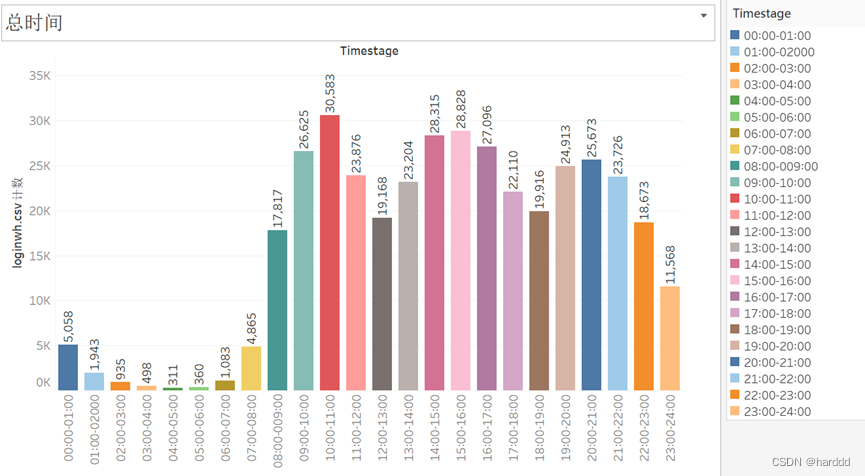
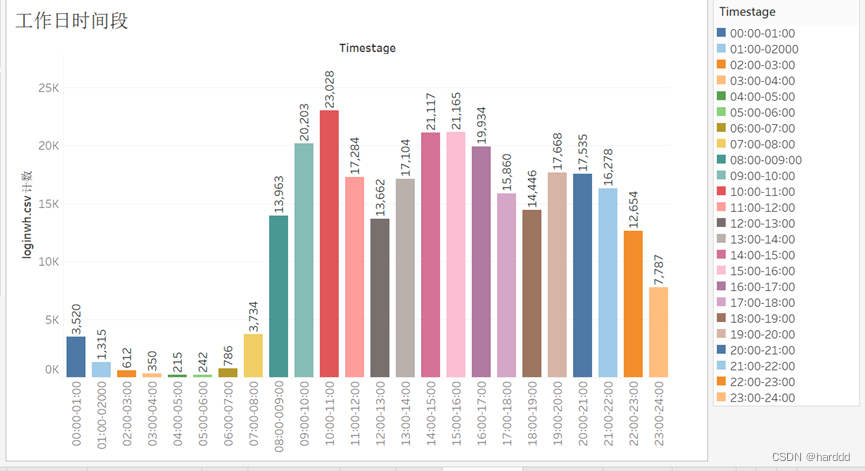
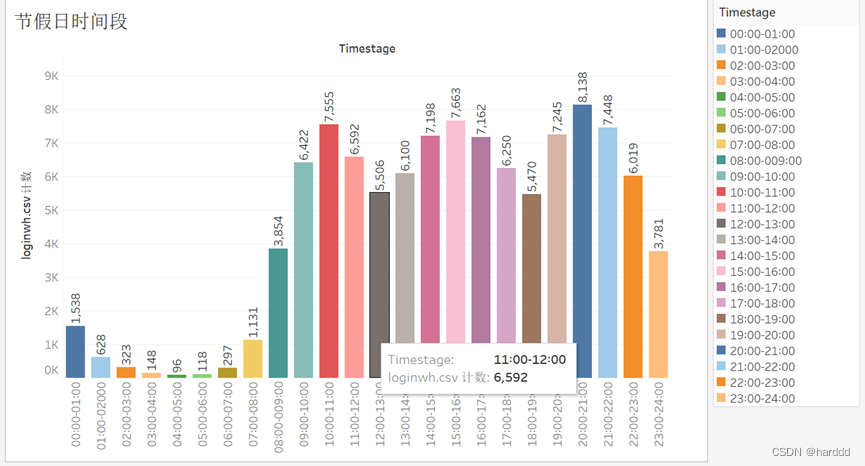
可以发现三个表高峰期都在上午九点,下午三点和晚上九点附近,不同的是节假日的最高峰出现在晚上,而工作日的在白天。
六、管理决策建议
1.用户方面
针对不同类别的用户,制定不同的运营策略。对于重要价值用户:保持长期联系与重点关注;对于重要保持用户:发放小额优惠券,吸引用户回流;对于重要发展客户:促导用户办理会员,或者开通积分活动。
2.商品方面
对于平台而言,应该挖掘课程内在逻辑,分析数据好的课程有什么优点,比如宣传的力度大亦或者授课老师水平高,通过这样平台才可能保持住优点进而打造出更多的爆品课程;而对于数据不好看的课程则要分析内在原因改进它们,整体提升课程质量,否则这些课程只会白白浪费平台各种运营的成本。
3.平台方面
从地区用户的分布情况来看,存在明显地区差异。因此对于用户数量大的地区,平台可以加大宣传力度,增加顾客粘性,抢占市场。其次,对于目前只有少部分用户的地区而言,不可盲目夸大范围, 投入资本。需要在保证重点地区人员稳定的情况下,再进行逐一攻破。
另一方面,工作日和非工作日的登陆频次基本一致,均在上午 9: 00-11:00,下午 14:00-17:00,晚上 20:00-21:00 出现三个高峰,波动趋势基本一致。所以平台应该在这三个时间段加强系统维护,加大宣传力度,吸引用户购买付费课程。


 3102
3102

 被折叠的 条评论
为什么被折叠?
被折叠的 条评论
为什么被折叠?
 到【灌水乐园】发言


