


Unsupervised Learning
Dimensionality Reduction & Feature Extraction via PCA(EigenFace)
%matplotlib inline
import itertools
import numpy as np
import matplotlib.pyplot as plt
import pandas as pd
import scipy

from sklearn import cluster
from sklearn import datasets
from sklearn import metrics
from sklearn.neighbors import kneighbors_graph
from sklearn.preprocessing import StandardScaler

from sklearn import decomposition #PCA
import time
Modified Olivetti faces dataset
faces = datasets.olivetti_faces.fetch_olivetti_faces()
print(faces.DESCR)
downloading Olivetti faces from http://cs.nyu.edu/~roweis/data/olivettifaces.mat to /home/hz/scikit_learn_data
Modified Olivetti faces dataset.
The original database was available from (now defunct)
http://www.uk.research.att.com/facedatabase.html
The version retrieved here comes in MATLAB format from the personal
web page of Sam Roweis:
http://www.cs.nyu.edu/~roweis/
There are ten different images of each of 40 distinct subjects. For some
subjects, the images were taken at different times, varying the lighting,
facial expressions (open / closed eyes, smiling / not smiling) and facial
details (glasses / no glasses). All the images were taken against a dark
homogeneous background with the subjects in an upright, frontal position (with
tolerance for some side movement).
The original dataset consisted of 92 x 112, while the Roweis version
consists of 64x64 images.
faces_images = faces['images']
faces_data = faces.data
faces_images.shape
(400, 64, 64)
faces_data.shape(400, 4096)
faces_images即是faces_data数据图片格式表示,便于绘制图片
现在绘制64张人脸图像
fig = plt.figure(figsize=(16,16))
for i in range(64):
    plt.subplot(8,8,i+1)
    plt.imshow(faces_images[i], cmap=plt.cm.gray)
    plt.grid(False)
    plt.xticks([])
    plt.yticks([])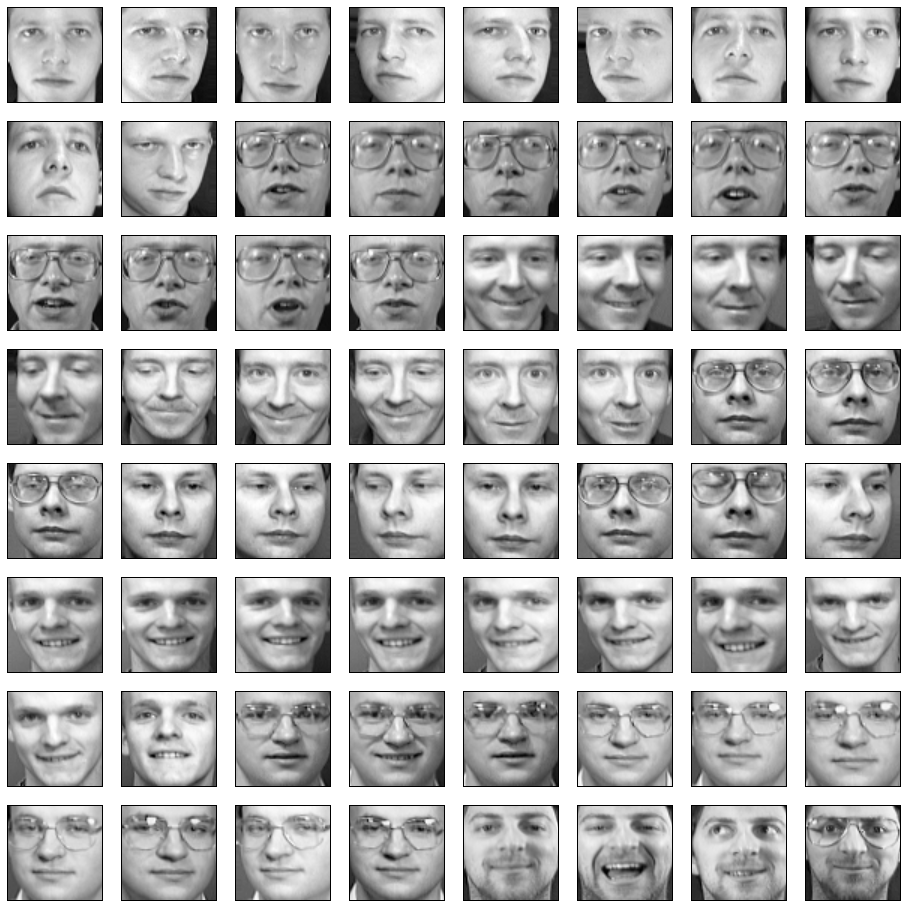
n_eigenfaces = 16
pca = decomposition.RandomizedPCA(n_components=n_eigenfaces, whiten=True)

pca.fit(faces_data)
RandomizedPCA(copy=True, iterated_power=3, n_components=16, random_state=None,
whiten=True)
pca.components_.shape(16, 4096)
plt.figure(figsize=(16,16))
plt.suptitle('EigenFaces')
for i in range(pca.components_.shape[0]):
    plt.subplot(4,4,i+1)
    plt.imshow(pca.components_[i].reshape(64,64), cmap=plt.cm.gray)
    plt.grid(False)
    plt.xticks([])
    plt.yticks([])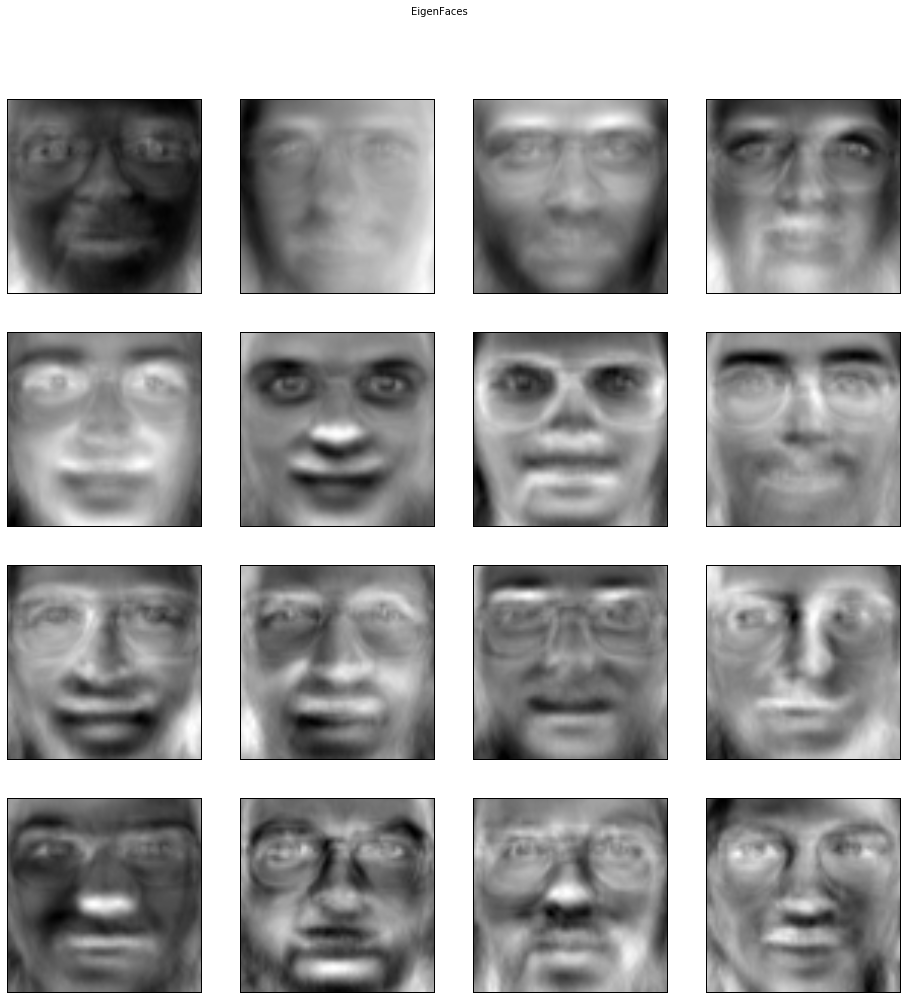
with plt.style.context('fivethirtyeight'):
    plt.figure(figsize=(16,12))
    plt.title('Explained VAriance Ratio over Component')
    plt.plot(pca.explained_variance_)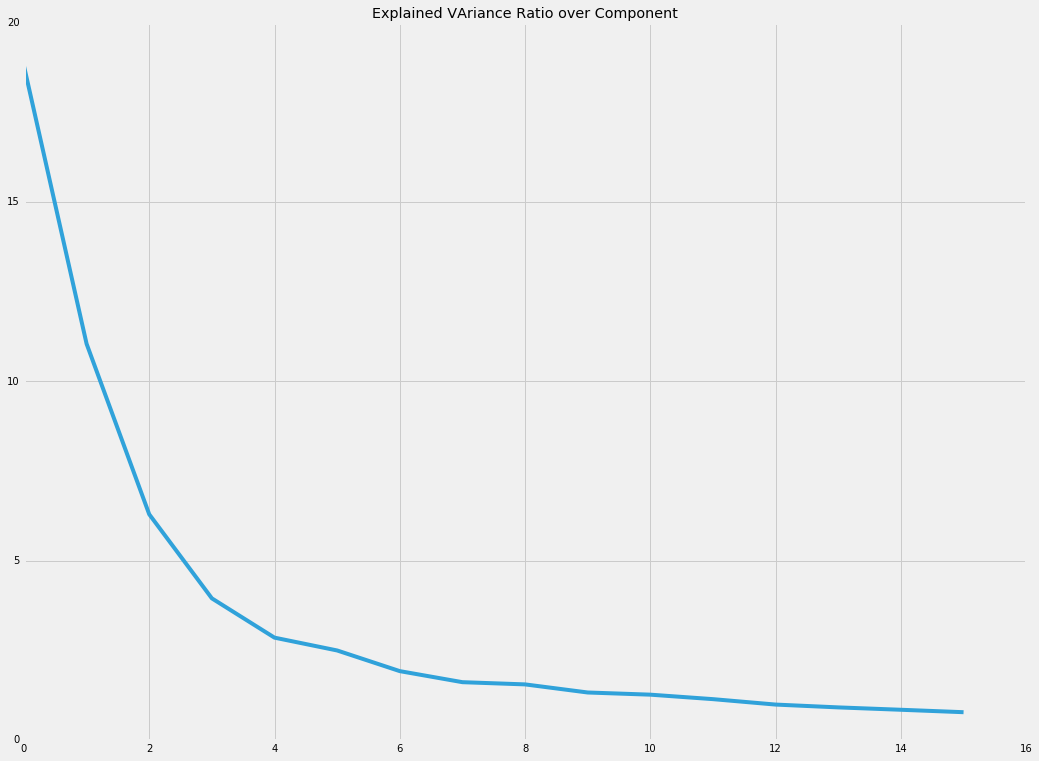
with plt.style.context('fivethirtyeight'):
    plt.figure(figsize=(16,12))
    plt.title('Cumulative Explained Variance over EigenFace')
    plt.plot(pca.explained_variance_ratio_.cumsum())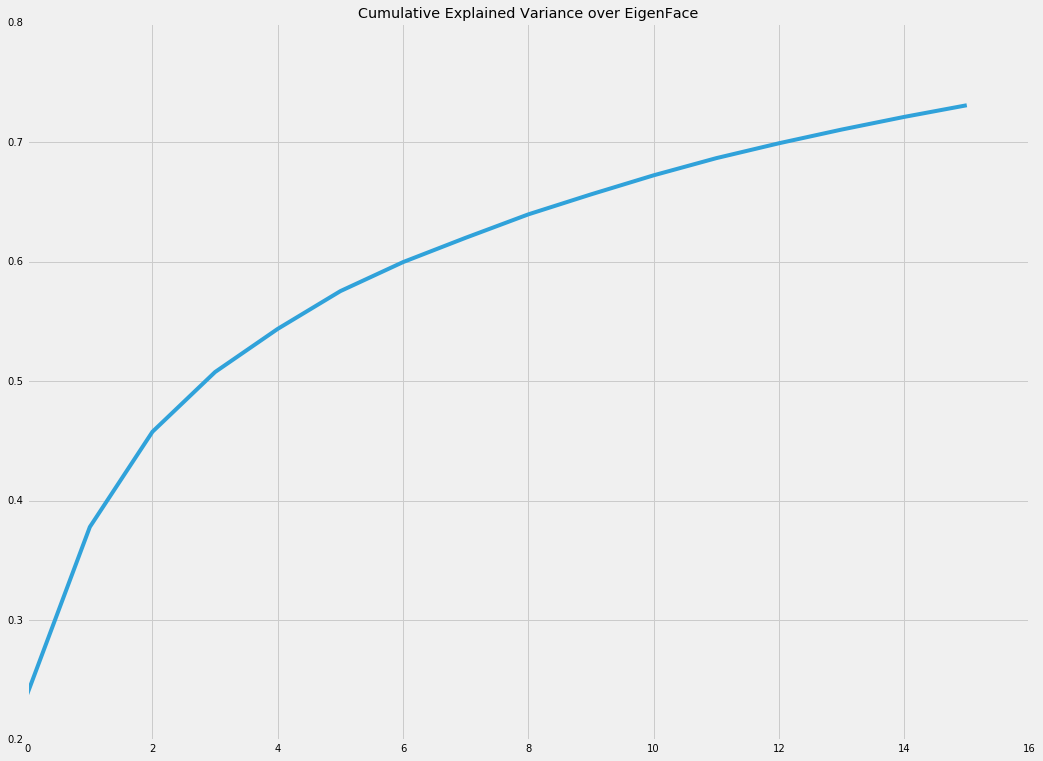
print('PCA captures {:.2f} percent of the variance in the dataset'.format(pca.explained_variance_ratio_.sum() * 100))PCA captures 73.09 percent of the variance in the dataset
n_eigenfaces = 121

pca = decomposition.RandomizedPCA(n_components=n_eigenfaces, whiten=True)
pca.fit(faces_data)
RandomizedPCA(copy=True, iterated_power=3, n_components=121,
random_state=None, whiten=True)
with plt.style.context('fivethirtyeight'):
    plt.figure(figsize=(16,12))
    plt.title('Cumulative Explained Variance over EigenFace')
    plt.plot(pca.explained_variance_ratio_.cumsum())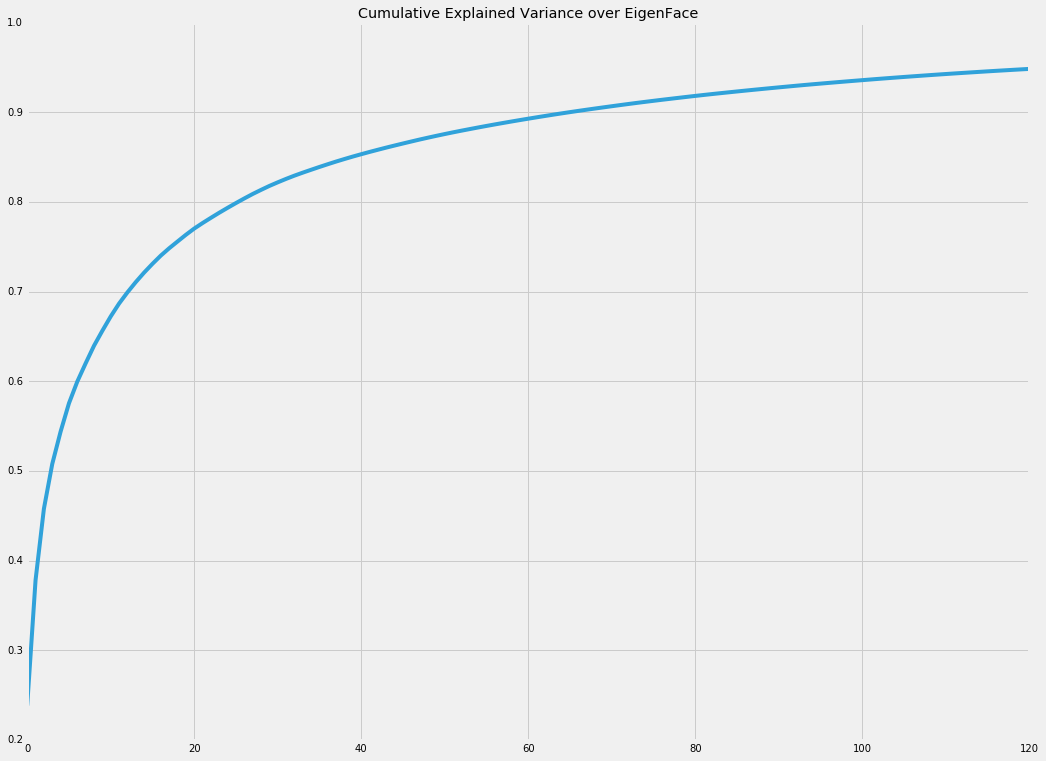
print('PCA captures {:.2f} percent of the variance in the dataset'.format(pca.explained_variance_ratio_.sum() * 100))PCA captures 94.84 percent of the variance in the dataset
plt.figure(figsize=(16, 16));
plt.suptitle('EigenFaces');
for ii in range(pca.components_.shape[0]):
    plt.subplot(11, 11, ii + 1) # It starts with one
    plt.imshow(pca.components_[ii].reshape(64, 64), cmap=plt.cm.gray)
    plt.grid(False);
    plt.xticks([]);
    plt.yticks([]);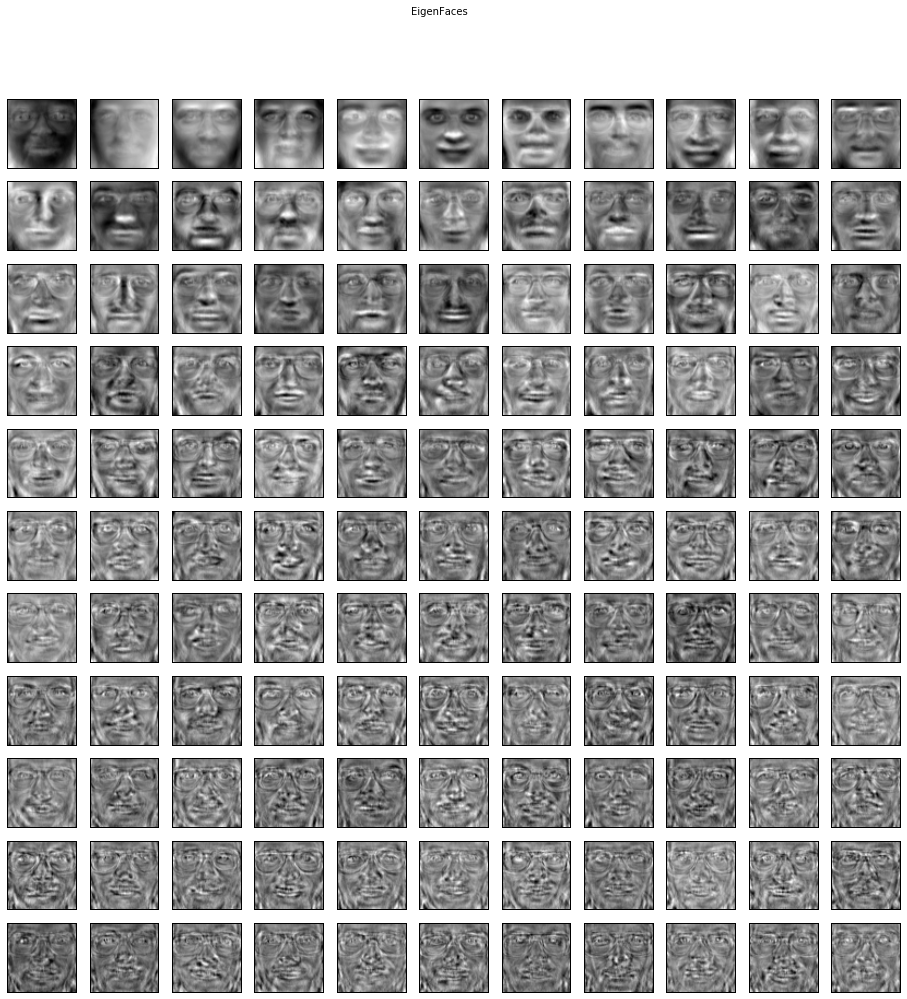


 9464
9464

 被折叠的 条评论
为什么被折叠?
被折叠的 条评论
为什么被折叠?
 到【灌水乐园】发言


