


K均值聚类
#3-5-1K均值聚类
import mglearn
import numpy as np
import matplotlib.pyplot as plt
import pandas as pd
from sklearn.cluster import KMeans
from sklearn.datasets import load_breast_cancer
from sklearn.datasets import make_moons
from sklearn.datasets import make_blobs
from sklearn.datasets import make_circles
from sklearn.datasets import load_iris
from sklearn.datasets import fetch_lfw_people
from sklearn.datasets import load_digits
from sklearn.decomposition import NMF
from sklearn.decomposition import PCA
from sklearn.ensemble import RandomForestClassifier
from sklearn.ensemble import GradientBoostingClassifier
from sklearn.svm import LinearSVC
from sklearn.svm import SVC
from sklearn.neighbors import KNeighborsClassifier
from sklearn.neural_network import MLPClassifier
from sklearn.linear_model import LogisticRegression
from sklearn.model_selection import train_test_split
from sklearn.manifold import TSNE
from sklearn.tree import DecisionTreeClassifier
from sklearn.preprocessing import MinMaxScaler
from sklearn.preprocessing import StandardScaler
from numpy.core.umath_tests import inner1d
from mpl_toolkits.mplot3d import Axes3D,axes3d
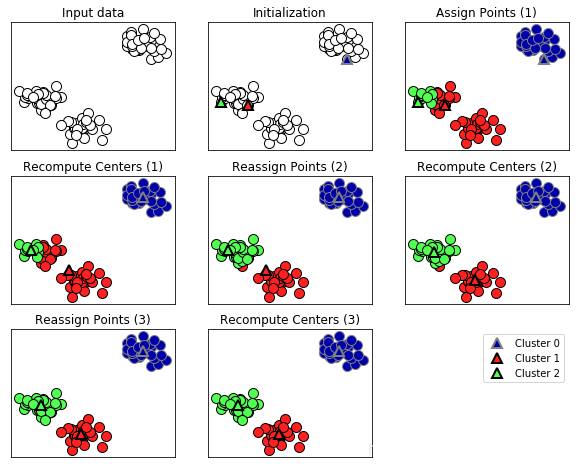
mglearn.plots.plot_kmeans_algorithm()
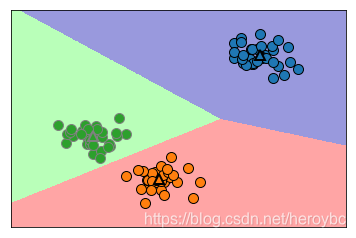
mglearn.plots.plot_kmeans_boundaries()
x,y = make_blobs(random_state=1)
kmeans = KMeans(n_clusters=3)
kmeans.fit(x)
print("cluster memberships:<n{}".format(kmeans.labels_))
print(kmeans.predict(x))
cluster memberships:<n[1 2 2 2 0 0 0 2 1 1 2 2 0 1 0 0 0 1 2 2 0 2 0 1 2 0 0 1 1 0 1 1 0 1 2 0 2
2 2 0 0 2 1 2 2 0 1 1 1 1 2 0 0 0 1 0 2 2 1 1 2 0 0 2 2 0 1 0 1 2 2 2 0 1
1 2 0 0 1 2 1 2 2 0 1 1 1 1 2 1 0 1 1 2 2 0 0 1 0 1]
[1 2 2 2 0 0 0 2 1 1 2 2 0 1 0 0 0 1 2 2 0 2 0 1 2 0 0 1 1 0 1 1 0 1 2 0 2
2 2 0 0 2 1 2 2 0 1 1 1 1 2 0 0 0 1 0 2 2 1 1 2 0 0 2 2 0 1 0 1 2 2 2 0 1
1 2 0 0 1 2 1 2 2 0 1 1 1 1 2 1 0 1 1 2 2 0 0 1 0 1]
mglearn.discrete_scatter(x[:,0],x[:,1],kmeans.labels_,markers='o')
mglearn.discrete_scatter(kmeans.cluster_centers_[:,0],kmeans.cluster_centers_[:,1],[0,1,2],markers='^',markeredgewidth=5)
fig,axes = plt.subplots(1,2,figsize=(10,5))
kmeans = KMeans(n_clusters=2)
kmeans.fit(x)
assignments = kmeans.labels_
mglearn.discrete_scatter(x[:,0],x[:,1],assignments,ax=axes[0])
kmeans = KMeans(n_clusters=5)
kmeans.fit(x)
assignments = kmeans.labels_
mglearn.discrete_scatter(x[:,0],x[:,1],assignments,ax=axes[1])

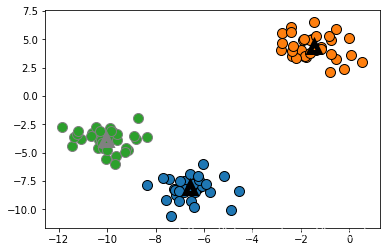
x_v,y_v = make_blobs(n_samples=200,cluster_std=[1.0,2.5,0.5],random_state=170)
y_p = KMeans(n_clusters=3,random_state=0).fit_predict(x_v)
mglearn.discrete_scatter(x_v[:,0],x_v[:,1],y_p)
plt.legend(['cluster 0','cluster 1','cluster 2'],loc='best')
plt.xlabel('feature 0')
plt.xlabel('feature 1')
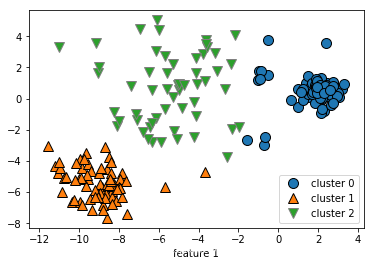
x,y =make_blobs(random_state=170,n_samples=600)  #随机生成一些分组数据
rng = np.random.RandomState(74)
transformation = rng.normal(size=(2,2))  #变换数据使其拉长
x = np.dot(x,transformation)
kmeans = KMeans(n_clusters=3)
kmeans.fit(x)
y_p = kmeans.predict(x)
plt.scatter(x[:,0],x[:,1],c=y_p,cmap=mglearn.cm3)
plt.scatter(kmeans.cluster_centers_[:,0],kmeans.cluster_centers_[:,1],marker="^",c[0,1,2],s=100,linewidth=5,cmap=mglearn.cm3)
plt.xlabel('feature 0')
plt.xlabel('feature 1')

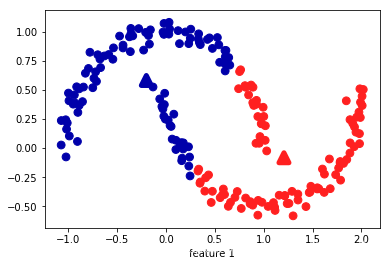
x,y = make_moons(n_samples=200,noise=0.05,random_state=0)
kmeans = KMeans(n_clusters=2)
kmeans.fit(x)
y_p = kmeans.predict(x)
plt.scatter(x[:,0],x[:,1],c=y_p,cmap=mglearn.cm2,s=60)
plt.scatter(kmeans.cluster_centers_[:,0],kmeans.cluster_centers_[:,1],marker="^",c=[mglearn.cm2(0),mglearn.cm2(1)],s=100,linewidth=5)
plt.xlabel('feature 0')
plt.xlabel('feature 1')
people = fetch_lfw_people(min_faces_per_person=20,resize=0.7) #灰度图像,按最小比例缩小以加快处理速度
image_shape = people.images[0].shape
counts = np.bincount(people.target)  #计算每个目标出现的次数
mask = np.zeros(people.target.shape,dtype=np.bool)
for target in np.unique(people.target):
    mask[np.where(people.target == target)[0][:50]] = 1  #每个人只取50张照片
x_people = people.data[mask]
y_people = people.target[mask]
x_people = x_people / 255  #将灰度值稳定在0~1之间,而不是0~255之间
x_train,x_test,y_train,y_test = train_test_split(x_people,y_people,stratify=y_people,random_state=0)
pca = PCA(n_components=2)
nmf = NMF(n_components=100,random_state=0)
nmf.fit(x_train)
kmeans = KMeans(n_clusters=100,random_state=0)
kmeans.fit(x_train)
x_reconstructed_pca = pca.inverse_transform(pca.transform(x_test))
x_reconstructed_kmeans = kmeans.cluster_centers_(kmeans.predict(x_test))
x_reconstructed_nmf = np.dot(nmf.transform(x_test),nmf_components_)
fig,axes = plt.subplots(3,5,figsize=(8,8),subplot_kw={'xticks':(),'yticks':()})
fig.suptitle("extracted components")
for ax,comp_keams,comp_pca,comp_nmf in zip(axes.T,kmeans.cluster_centers_,pca.components_,nmf.components_):
    ax[0].imshow(comp_kmeans.reshape(image_shape))
    ax[1].imshow(comp_pca.reshape(image_shape),cmap='viridis')
    ax[2].imshow(comp_nmf.reshape(image_shape))
axes[0,0].set_ylabel('kmeans')
axes[1,0].set_ylabel('pca')
axes[2,0].set_ylabel('nmf')
fig,axes = plt.subplots(4,5,figsize=(8,8),subplot_kw={'xticks':(),'yticks':()})
fig.suptitle("reconstructions")
for ax,orig,rec_kmeans,rec_pca,rec_nmf in zip(axes.T,x_test,x_reconstructed_kmeans,x_reconstructed_pca,x_reconstructed_nmf):
    ax[0].imshow(orig.reshape(image_shape))
    ax[1].imshow(rec_kmeans.reshape(image_shape))
    ax[2].imshow(rec_pca.reshape(image_shape))
    ax[3].imshow(rec_nmf.reshape(image_shape))
axes[0,0].set_ylabel('original')
axes[1,0].set_ylabel('kmeans')
axes[2,0].set_ylabel('pca')
axes[3,0].set_ylabel('nmf')
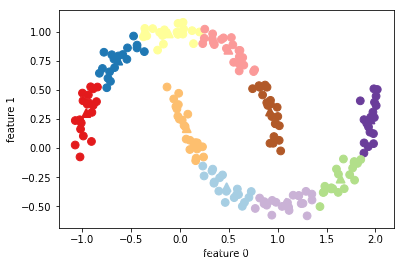
x,y = make_moons(n_samples=200,noise=0.05,random_state=0)
kmeans = KMeans(n_clusters=10,random_state=0)
kmeans.fit(x)
y_pred = kmeans.predict(x)
plt.scatter(x[:,0],x[:,1],c=y_pred,s=60,cmap='Paired')
plt.scatter(kmeans.cluster_centers_[:,0],kmeans.cluster_centers_[:,1],s=60,marker='^',c=range(kmeans.n_clusters),linewidth=2,cmap='Paired')
plt.xlabel('feature 0')
plt.ylabel('feature 1')
print("cluster memberships:{}".format(y_pred))
distance_features = kmeans.transform(x)
print("distance feature shape:{}".format(distance_features.shape))
print("distance feature:{}".format(distance_features))
distance feature shape:(200, 10)
distance feature:[[0.9220768 1.46553151 1.13956805 … 1.16559918 1.03852189 0.23340263]
[1.14159679 2.51721597 0.1199124 … 0.70700803 2.20414144 0.98271691]
[0.78786246 0.77354687 1.74914157 … 1.97061341 0.71561277 0.94399739]
…
[0.44639122 1.10631579 1.48991975 … 1.79125448 1.03195812 0.81205971]
[1.38951924 0.79790385 1.98056306 … 1.97788956 0.23892095 1.05774337]
[1.14920754 2.4536383 0.04506731 … 0.57163262 2.11331394 0.88166689]]
凝聚聚类
#3-5-2凝聚聚类
import mglearn
import numpy as np
import matplotlib.pyplot as plt
import pandas as pd
from numpy.core.umath_tests import inner1d
from mpl_toolkits.mplot3d import Axes3D,axes3d
from scipy.cluster.hierarchy import dendrogram,ward
from sklearn.cluster import KMeans,AgglomerativeClustering
from sklearn.datasets import load_breast_cancer,make_moons,make_circles,make_blobs
from sklearn.datasets import load_iris,fetch_lfw_people,load_digits
from sklearn.decomposition import NMF,PCA
from sklearn.ensemble import RandomForestClassifier,GradientBoostingClassifier
from sklearn.svm import SVC,LinearSVC
from sklearn.neighbors import KNeighborsClassifier
from sklearn.neural_network import MLPClassifier
from sklearn.linear_model import LogisticRegression
from sklearn.model_selection import train_test_split
from sklearn.manifold import TSNE
from sklearn.tree import DecisionTreeClassifier
from sklearn.preprocessing import MinMaxScaler,StandardScaler
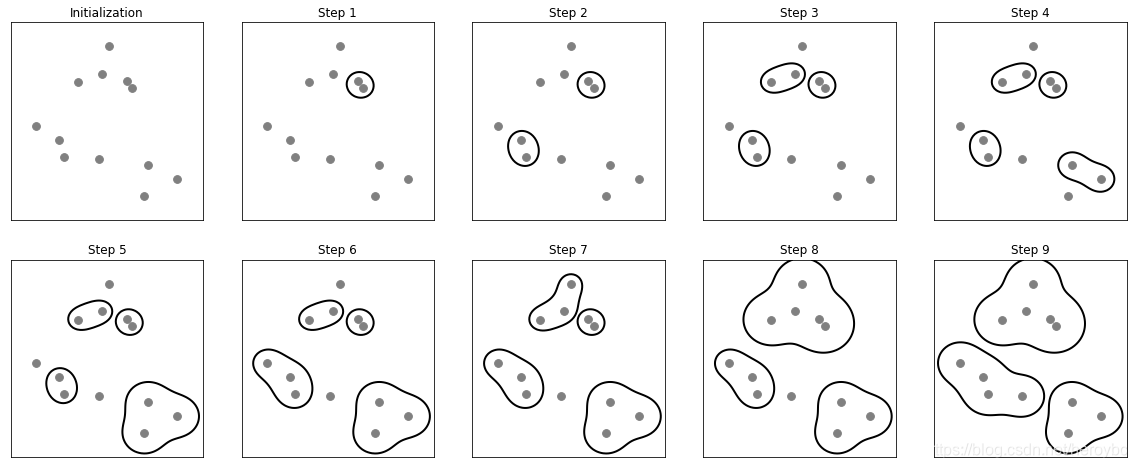
mglearn.plots.plot_agglomerative_algorithm()
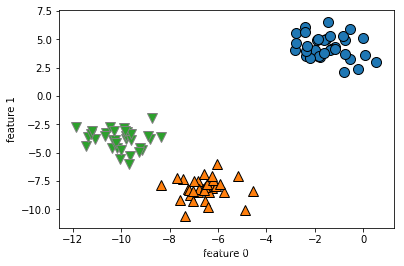
x,y = make_blobs(random_state=1)
agg = AgglomerativeClustering(n_clusters=3)
assignment = agg.fit_predict(x)
mglearn.discrete_scatter(x[:,0],x[:,1],assignment)
plt.xlabel('feature 0')
plt.ylabel('feature 1')
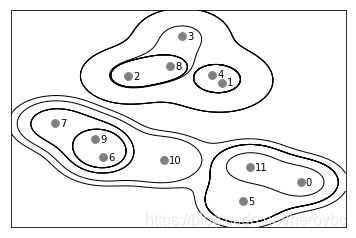
mglearn.plots.plot_agglomerative()
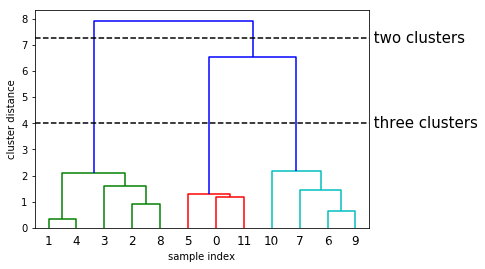
x,y = make_blobs(random_state=0,n_samples=12)
linkage_array = ward(x)  #得出链接数组
dendrogram(linkage_array)  #距离得出树状图
ax = plt.gca()
bounds = ax.get_xbound()
ax.plot(bounds,[7.25,7.25],'--',c='k')
ax.plot(bounds,[4,4],'--',c='k')
ax.text(bounds[1],7.25,' two clusters',va='center',fontdict={'size':15})
ax.text(bounds[1],4,' three clusters',va='center',fontdict={'size':15})
plt.xlabel('sample index')
plt.ylabel('cluster distance')
DBSCAN具有噪声的基于密度空间聚类
#3-5-3DBSCAN具有噪声的基于密度空间聚类
import mglearn
import numpy as np
import matplotlib.pyplot as plt
import pandas as pd
from numpy.core.umath_tests import inner1d
from mpl_toolkits.mplot3d import Axes3D,axes3d
from scipy.cluster.hierarchy import dendrogram,ward
from sklearn.cluster import KMeans,AgglomerativeClustering,DBSCAN
from sklearn.datasets import load_breast_cancer,make_moons,make_circles,make_blobs
from sklearn.datasets import load_iris,fetch_lfw_people,load_digits
from sklearn.decomposition import NMF,PCA
from sklearn.ensemble import RandomForestClassifier,GradientBoostingClassifier
from sklearn.svm import SVC,LinearSVC
from sklearn.neighbors import KNeighborsClassifier
from sklearn.neural_network import MLPClassifier
from sklearn.linear_model import LogisticRegression
from sklearn.model_selection import train_test_split
from sklearn.manifold import TSNE
from sklearn.tree import DecisionTreeClassifier
from sklearn.preprocessing import MinMaxScaler,StandardScaler
x,y = make_blobs(random_state=0,n_samples=12)
dbscan = DBSCAN()
clusters = dbscan.fit_predict(x)
print('cluster memberships:{}'.format(clusters))
cluster memberships:[-1 -1 -1 -1 -1 -1 -1 -1 -1 -1 -1 -1]
mglearn.plots.plot_dbscan()
min_samples: 2 eps: 1.000000 cluster: [-1 0 0 -1 0 -1 1 1 0 1 -1 -1]
min_samples: 2 eps: 1.500000 cluster: [0 1 1 1 1 0 2 2 1 2 2 0]
min_samples: 2 eps: 2.000000 cluster: [0 1 1 1 1 0 0 0 1 0 0 0]
min_samples: 2 eps: 3.000000 cluster: [0 0 0 0 0 0 0 0 0 0 0 0]
min_samples: 3 eps: 1.000000 cluster: [-1 0 0 -1 0 -1 1 1 0 1 -1 -1]
min_samples: 3 eps: 1.500000 cluster: [0 1 1 1 1 0 2 2 1 2 2 0]
min_samples: 3 eps: 2.000000 cluster: [0 1 1 1 1 0 0 0 1 0 0 0]
min_samples: 3 eps: 3.000000 cluster: [0 0 0 0 0 0 0 0 0 0 0 0]
min_samples: 5 eps: 1.000000 cluster: [-1 -1 -1 -1 -1 -1 -1 -1 -1 -1 -1 -1]
min_samples: 5 eps: 1.500000 cluster: [-1 0 0 0 0 -1 -1 -1 0 -1 -1 -1]
min_samples: 5 eps: 2.000000 cluster: [-1 0 0 0 0 -1 -1 -1 0 -1 -1 -1]
min_samples: 5 eps: 3.000000 cluster: [0 0 0 0 0 0 0 0 0 0 0 0]

x,y = make_moons(random_state=0,n_samples=200,noise=0.05)
scaler = StandardScaler()
scaler.fit(x)
x_scaled = scaler.transform(x)
dbscan = DBSCAN(eps=0.5)
clusters = dbscan.fit_predict(x_scaled)
plt.scatter(x_scaled[:,0],x_scaled[:,1],c=clusters,cmap=mglearn.cm2,s=60)
plt.xlabel('feature 0')
plt.ylabel('feature 1')

聚类算法的对比与评估
#3-5-4聚类算法的对比与评估
import mglearn
import numpy as np
import matplotlib.pyplot as plt
import pandas as pd
from numpy.core.umath_tests import inner1d
from mpl_toolkits.mplot3d import Axes3D,axes3d
from scipy.cluster.hierarchy import dendrogram,ward
from sklearn.cluster import KMeans,AgglomerativeClustering,DBSCAN
from sklearn.datasets import load_breast_cancer,make_moons,make_circles,make_blobs
from sklearn.datasets import load_iris,fetch_lfw_people,load_digits
from sklearn.decomposition import NMF,PCA
from sklearn.ensemble import RandomForestClassifier,GradientBoostingClassifier
from sklearn.svm import SVC,LinearSVC
from sklearn.neighbors import KNeighborsClassifier
from sklearn.neural_network import MLPClassifier
from sklearn.linear_model import LogisticRegression
from sklearn.model_selection import train_test_split
from sklearn.manifold import TSNE
from sklearn.metrics import accuracy_score
from sklearn.metrics.cluster import adjusted_rand_score,silhouette_score
from sklearn.tree import DecisionTreeClassifier
from sklearn.preprocessing import MinMaxScaler,StandardScaler
x,y = make_moons(n_samples=200,noise=0.05,random_state=0)
scaler = StandardScaler() #平均值为0,方差为1
scaler.fit(x)
x_scaled = scaler.transform(x)
fig,axes = plt.subplots(1,4,figsize=(15,3),subplot_kw={'xticks':(),'yticks':()})
algorithms = [KMeans(n_clusters=2),AgglomerativeClustering(n_clusters=2),DBSCAN()]
random_state = np.random.RandomState(seed=0)
random_clusters = random_state.randint(low=0,high=2,size=len(x))
axes[0].scatter(x_scaled[:,0],x_scaled[:,1],c=random_clusters,cmap=mglearn.cm3,s=60)
axes[0].set_title('random assignment-ARI:{:.2f}'.format(adjusted_rand_score(y,random_clusters)))
for ax,algorithm in zip(axes[1:],algorithms): #绘制簇分配和簇中心
    clusters = algorithm.fit_predict(x_scaled)
    ax.scatter(x_scaled[:,0],x_scaled[:,1],c=clusters,cmap=mglearn.cm3,s=60)
    ax.set_title('{}-ARI:{:.2f}'.format(algorithm.__class__.__name__,adjusted_rand_score(y,clusters)))

cluster1 = [0,0,1,1,0] #这两种标签对应于相同的聚类
cluster2 = [1,1,0,0,1]
print('accuracy:{:.2f}'.format(accuracy_score(cluster1,cluster2)))  #错误评估
print('ARI:{:.2f}'.format(adjusted_rand_score(cluster1,cluster2)))
accuracy:0.00
ARI:1.00
x,y = make_moons(n_samples=200,noise=0.05,random_state=0)
scaler = StandardScaler()
scaler.fit(x)
x_scaled = scaler.transform(x)
fig,axes = plt.subplots(1,4,figsize=(15,3),subplot_kw={'xticks':(),'yticks':()})
random_state = np.random.RandomState(seed=0)
random_clusters = random_state.randint(low=0,high=2,size=len(x))
axes[0].scatter(x_scaled[:,0],x_scaled[:,1],c=random_clusters,cmap=mglearn.cm2,s=60)
axes[0].set_title('random assignment:{:.2f}'.format(silhouette_score(x_scaled,random_clusters)))
algorithms = [KMeans(n_clusters=2),AgglomerativeClustering(n_clusters=2),DBSCAN()]
for ax,algorithm in zip(axes[1:],algorithms): #绘制簇分配和簇中心
    clusters = algorithm.fit_predict(x_scaled)
    ax.scatter(x_scaled[:,0],x_scaled[:,1],c=clusters,cmap=mglearn.cm2,s=60)
    ax.set_title('{} :{:.2f}'.format(algorithm.__class__.__name__,silhouette_score(x_scaled,clusters)))

#人脸数据集的文件路径(deepin)->file:///home/s/scikit_learn_data/lfw_home,网址:https://ndownloader.figshare.com/files/5976015
people = fetch_lfw_people(min_faces_per_person=20,resize=0.7) #灰度图像,按最小比例缩小以加快处理速度
image_shape = people.images[0].shape
#counts = np.bincount(people.target)  #计算每个目标出现的次数
mask = np.zeros(people.target.shape,dtype=np.bool)
for target in np.unique(people.target):
    mask[np.where(people.target == target)[0][:50]] = 1  #每个人只取50张照片
x_people = people.data[mask]
y_people = people.target[mask]
x_people = x_people / 255
pca = PCA(n_components=100,whiten=True,random_state=0)
pca.fit_transform(x_people)
x_pca = pca.transform(x_people)
dbscan = DBSCAN()
labels = dbscan.fit_predict(x_pca)
print('unique labels:{}'.format(np.unique(labels)))
unique labels:[-1]
dbscan = DBSCAN(min_samples=3)
labels = dbscan.fit_predict(x_pca)
print('unique labels:{}'.format(np.unique(labels)))
unique labels:[-1]
dbscan = DBSCAN(min_samples=3,eps=15)
labels = dbscan.fit_predict(x_pca)
print('unique labels:{}'.format(np.unique(labels)))
unique labels:[-1 0]
#计算簇的点数,第一个为噪声点,+1是因为不能有负值
print('number of points per cluster:{}'.format(np.bincount(labels+1)))
noise = x_people[labels==-1]  #噪声的图像
fig,axes = plt.subplots(3,9,subplots_kw={'xticks':(),'yticks':()},figsize=(12,4))
for image,ax in zip(noise,axes.ravel()):
    ax.imshow(image.reshape(image_shape),vmin=0,vmax=1)

for eps in [1,3,5,7,9,11,13]:  #尝试不同的簇
    print('eps={}'.format(eps))
    dbscan = DBSCAN(eps=eps,min_samples=3)
    label = dbscan.fit_predict(x_pca)
    print('cluster present:{}'.format(np.unique(labels)))
    print('cluster sizes:{}'.format(np.bincount(labels+1)))
eps=1
cluster present:[-1 0]
cluster sizes:[ 32 2031]
eps=3
cluster present:[-1 0]
cluster sizes:[ 32 2031]
eps=5
cluster present:[-1 0]
cluster sizes:[ 32 2031]
eps=7
cluster present:[-1 0]
cluster sizes:[ 32 2031]
eps=9
cluster present:[-1 0]
cluster sizes:[ 32 2031]
eps=11
cluster present:[-1 0]
cluster sizes:[ 32 2031]
eps=13
cluster present:[-1 0]
cluster sizes:[ 32 2031]
dbscan = DBSCAN(min_samples=3,eps=7)
labels = dbscan.fit_predict(x_pca)
for cluster in range(max(labels)+1):
    mask = labels == cluster
    n_images = np.sum(mask)
    fig,axes = plt.subplots(1,n_images,figsize=(n_images * 1.5,4),subplot_kw={'xticks':(),'yticks':()})
    for image,label,ax in zip(x_people[mask],y_people[mask],axes):
        ax.imshow(image.reshape(image_shape),vmin=0,vmax=1)
        ax.set_title(people.target_names[label].split()[-1])


km = KMeans(n_clusters=10,random_state=0)
labels_km = km.fit_predict(x_pca)
print('cluster sizes k-means:{}'.format(np.bincount(labels_km)))
cluster sizes k-means:[155 175 238 75 358 257 91 219 323 172]
fig,axes = plt.subplots(2,5,subplot_kw={'xticks':(),'yticks':()},figsize=(12,4))
for center,ax in zip(km.cluster_centers_,axes.ravel()):
    ax.imshow(pca.inverse_transform(center).reshape(image_shape),vmin=0,vmax=1)

mglearn.plots.plot_kmeans_faces(km,pca,x_pca,x_people,y_people,people.target_names)

#用ward凝聚聚类提取簇
agglomerative = AgglomerativeClustering(n_clusters=10)
labels_agg = agglomerative.fit_predict(x_pca)
print('cluster sizes agglomerative clustering:{}'.format(np.bincount(labels_agg)))
cluster sizes agglomerative clustering:[169 660 144 329 217 85 18 261 31 149]
print('ARI:{:.2f}'.format(adjusted_rand_score(labels_agg,labels_km)))
ARI:0.09
linkage_array = ward(x_pca)
plt.figure(figsize=(20,5))
dendrogram(linkage_array,p=7,truncate_mode='level',no_labels=True)
plt.xlabel('sample index')
plt.ylabel('cluster distance')

#凝聚聚类
n_cluster = 10
for cluster in range(n_cluster):
    mask = labels_agg == cluster
    fig,axes = plt.subplots(1,10,subplot_kw={'xticks':(),'yticks':()},figsize=(15,8))
    axes[0].set_ylabel(np.sum(mask))
    for image,label,asdf,ax in zip(x_people[mask],y_people[mask],labels_agg[mask],axes):
        ax.imshow(image.reshape(image_shape),vmin=0,vmax=1)
        ax.set_title(people.target_names[label].split()[-1],fontdict={'fontsize':9})


agglomerative = AgglomerativeClustering(n_clusters=40)
labels_agg = agglomerative.fit_predict(x_pca)
print('cluster sizes Agglomerative clustering:{}'.format(np.bincount(labels_agg)))
n_cluster = 40
for cluster in [10,13,19,22,36]:
    mask = labels_agg == cluster
    fig,axes = plt.subplots(1,15,subplot_kw={'xticks':(),'yticks':()},figsize=(15,8))
    cluster_size = np.sum(mask)
    axes[0].set_ylabel('#{}:{}'.format(cluster,cluster_size))
    for image,label,asdf,ax in zip(x_people[mask],y_people[mask],labels_agg[mask],axes):
        ax.imshow(image.reshape(image_shape),vmin=0,vmax=1)
        ax.set_title(people.target_names[label].split()[-1],fontdict={'fontsize':9})
    for i in range(cluster_size,15):
        axes[i].set_visible(False)
cluster sizes Agglomerative clustering:[ 43 120 100 194 56 58 127 22 6 37 65 49 84 18 168 44 47 31
78 30 166 20 57 14 11 29 23 5 8 84 67 30 57 16 22 12
29 2 26 8]


 被折叠的 条评论
为什么被折叠?
被折叠的 条评论
为什么被折叠?
 到【灌水乐园】发言


